FanGraphs Power Rankings: August 7–13

What a difference a week makes. With plenty of teams streaking up and down the standings, the playoff picture in both leagues is as murky as ever. We’re also at the point in the season where we can start thinking about which teams are positioned to play spoiler down the stretch.

A reminder for how these rankings are calculated: first, we take the three most important components of a team — their offense (wRC+), their pitching (a 50/50 blend of FIP- and RA9-, weighted by starter and reliever IP share), and their defense (RAA) — and combine them to create an overall team quality metric. I also add in a factor for “luck,” adjusting a team’s win percentage based on expected win-loss record. The result is a power ranking, which is then presented in tiers below.

Tier 1 – The Best of the Best
Team Record “Luck” wRC+ SP- RP- RAA Team Quality Playoff Odds
Braves 75-42 -1 124 95 84 -6 157 100.0%
Rangers 70-48 -5 121 91 102 14 167 91.7%

The Rangers continued their red-hot August with series wins against the A’s and Giants last week. They’re just three games behind the Orioles for the best record in the American League and have held off the surging Astros and Mariners to maintain their grip on the AL West.

The Braves emerged from their most congested portion of their schedule with five wins in eight games last week. They outscored the Mets 34–3 over the first three games of their four-game weekend series before losing on Sunday night, 7–6. Matt Olson took over the MLB home run lead by blasting four last week; he’s now up to 43 on the season, already a career high.

Tier 2 – On the Cusp of Greatness
Team Record “Luck” wRC+ SP- RP- RAA Team Quality Playoff Odds
Rays 71-49 -3 117 88 102 9 154 95.9%
Blue Jays 66-54 0 108 92 85 -3 148 65.7%
Dodgers 71-46 0 116 98 95 1 141 100.0%
Orioles 73-45 8 103 100 86 -8 107 98.4%
Mariners 63-54 1 103 93 89 12 142 34.6%
Astros 68-51 0 105 97 97 6 129 90.4%

All of a sudden, the Rays are facing all sorts of woes. On Saturday, they placed Shane McClanahan on the 60-day IL with a forearm injury that will cost him the rest of the season. For a team that’s already lost Drew Rasmussen and Jeffrey Springs to season-ending injuries (not to mention the back issue that forced Tyler Glasnow to miss his start last week), it’s another unfortunate hit to the pitching depth. Then, on Sunday, reports emerged that Wander Franco was being investigated regarding some concerning social media posts.

The Blue Jays have struggled with consistency all season long; to wit, they split a series with the Guardians and lost a series to the Cubs last week, allowing the surging Mariners to come within a game and a half of the final Wild Card spot in the AL. With Hyun Jin Ryu back from his Tommy John surgery and Yusei Kikuchi in the middle of the best run of his career, Toronto optioned Alek Manoah back to Triple-A to continue working out his issues. Bo Bichette still looks like he’s a couple of weeks away from returning from his knee injury, though Jordan Romano and Kevin Kiermaier look like they’ll be back from the IL this week.

The Dodgers have lost just once in August and pushed their current win streak to eight games with a sweep of the Rockies last weekend. They didn’t have the splashiest of trade deadlines, but Lance Lynn has surprisingly provided some stability to a starting rotation that is only just now getting healthy again, and Clayton Kershaw was activated from the IL last week and contributed a solid start on Thursday. Los Angeles now has a commanding 8.5-game lead in the NL West, a shocking gap considering it wasn’t even in first place at the All-Star break.

Tier 3 – Solid Contenders
Team Record “Luck” wRC+ SP- RP- RAA Team Quality Playoff Odds
Phillies 65-54 2 100 90 93 -2 120 84.2%
Cubs 61-57 -4 105 101 93 7 131 54.0%
Twins 62-58 -2 103 87 97 -9 117 90.5%
Giants 63-55 2 94 97 89 11 113 65.5%
Brewers 65-54 5 89 96 92 22 103 83.5%
Padres 56-62 -9 105 89 101 22 148 21.9%

Wednesday was a night of celebration for the Phillies: Weston Wilson crushed a home run in his first major league plate appearance; Nick Castellanos blasted two home runs, the second of which was his 200th career dinger; and as the headlining act, Michael Lorenzen fired a no-hitter in his first start in Philadelphia since coming over at the trade deadline. They couldn’t keep the good vibes going over the weekend, scoring just once over their final two games against the Twins. Still, the struggles of every other NL Wild Card hopeful have given the Phillies a three-game lead in that race.

The Giants barely avoided a sweep at the hands of the Rangers with a dramatic, walk-off win in the tenth inning on Sunday. That victory salvaged a 2–4 week and helped them stay 1.5 games ahead of the Marlins in the NL Wild Card race. That series against Texas began an extremely tough stretch of schedule against playoff contenders that includes the Rays, Braves (twice), Phillies, Reds, Padres, and Cubs before finally easing up in September.

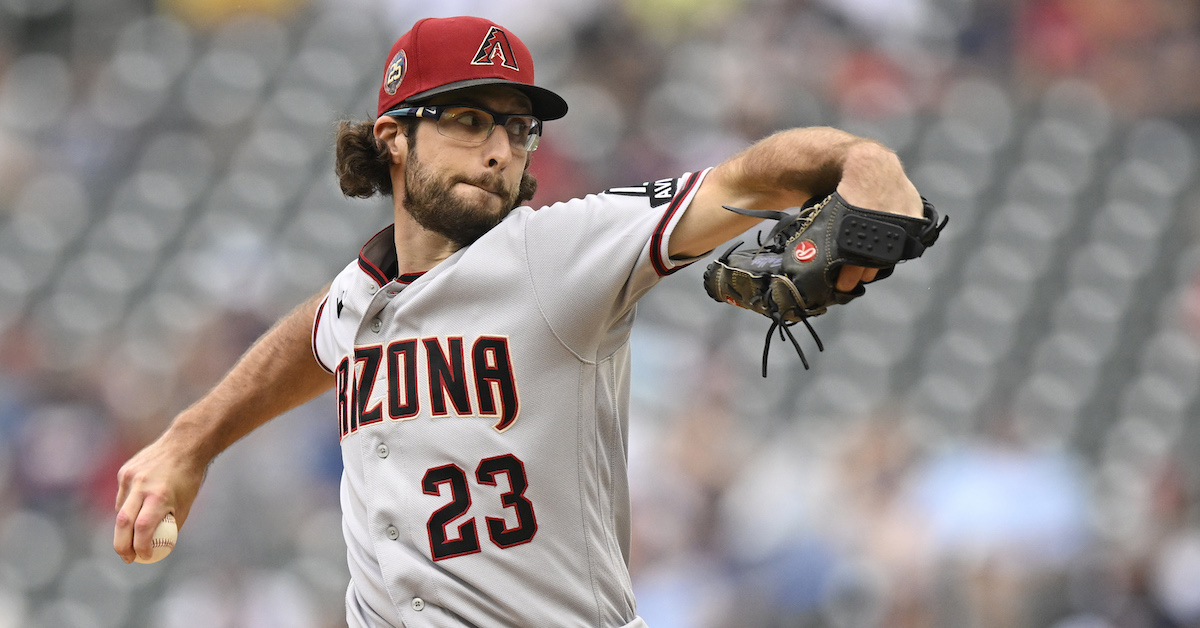
The Padres are quickly running out of opportunities to turn their season around at the last minute. After a particularly lackluster performance in a losing effort in Seattle on Wednesday, there were some pointed comments from Juan Soto after the game. They bounced back in their first game against the Diamondbacks in a huge weekend series but lost on Saturday and Sunday and are now 5.5 games back for the final wild card spot. They’ll have another shot at Arizona this weekend, which now seems like a make-or-break series.

Tier 4 – The Melee
Team Record “Luck” wRC+ SP- RP- RAA Team Quality Playoff Odds
Red Sox 62-56 0 104 104 95 -39 91 15.6%
Angels 59-60 0 109 104 106 -4 106 1.9%
Yankees 60-58 1 96 108 86 9 99 5.7%
Diamondbacks 59-59 2 99 102 103 15 99 20.7%
Guardians 57-62 -3 91 93 93 3 101 8.5%
Marlins 62-57 7 97 95 98 -14 87 44.9%
Reds 62-58 4 96 109 97 -15 54 23.9%

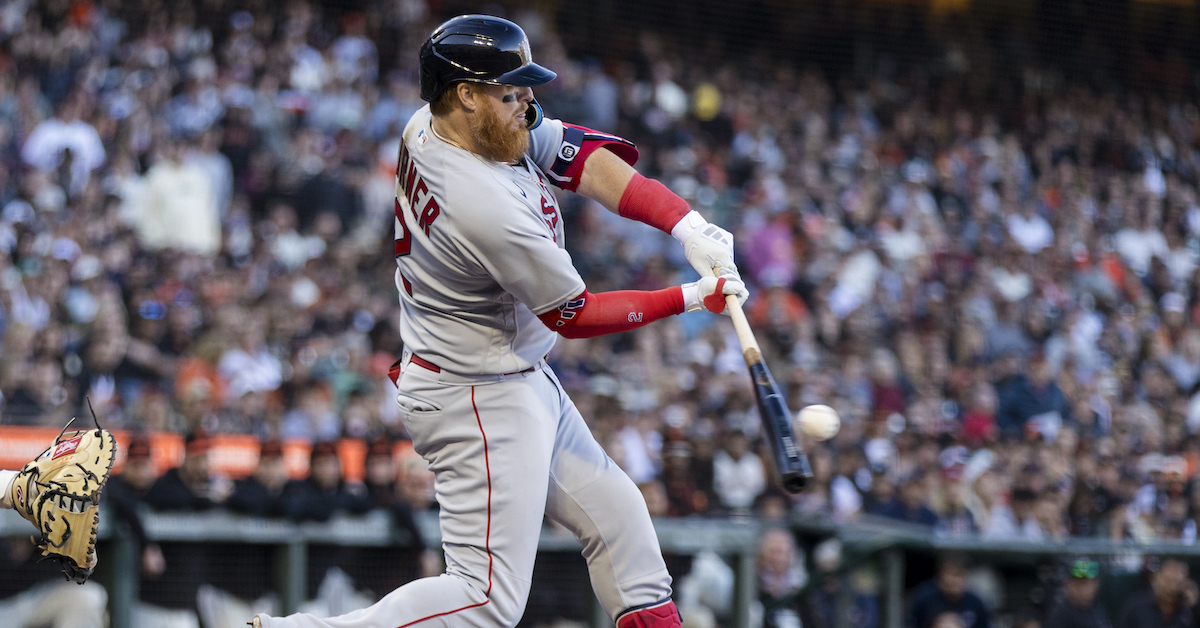
After an ugly 2–8 stretch to start the month, the Red Sox have gotten back on track with series wins against the Royals and Tigers last week. Trevor Story, Chris Sale, and Garrett Whitlock are back off the IL, and Triston Casas is powering the offense nearly singlehandedly. That’s a lot of last-minute reinforcements for Boston, which has a lot of work to do to get back into the AL Wild Card race.

The Angels showed some signs of life in a series win against the Giants early last week, but they were short-lived; the Astros handed them back-to-back 11–3 defeats over the weekend, and Los Angeles barely avoided a sweep with a close 2–1 victory on Sunday. The Angels’ postseason hopes are hanging by a thread, and they’re almost at the point where they need to start looking toward an Ohtani-less season next year. They’ll have plenty of opportunities to affect the playoff picture by playing spoiler down the stretch, but they need to find ways to get some of their youngsters more playing time to assess what they’re working with moving forward.

The four-way race for the final NL Wild Card spot ended this week with the Marlins a half-game ahead of the Reds and Cubs. They got there thanks to a series win against Cincinnati earlier in the week and then a dramatic series win against the Yankees capped off by a walk-off victory on Sunday. All four teams won their series over the weekend, though Arizona is at a significant disadvantage thanks to its slide down the standings earlier in the month.

Tier 5 – No Man’s Land
Team Record “Luck” wRC+ SP- RP- RAA Team Quality Playoff Odds
Cardinals 52-66 -4 111 106 101 1 119 0.4%
Pirates 53-65 2 90 105 98 1 67 0.2%
Mets 53-65 0 101 107 115 -11 62 0.8%
Nationals 53-66 2 95 111 113 5 63 0.0%
Tigers 53-65 4 87 107 98 4 62 1.0%

The race for the final two protected draft lottery picks is probably going to come down to these five teams. They’re separated by just a single game in the standings, and each of them looks stronger than the bottom four teams in the standings (though the Nationals are actually ineligible to receive a lottery pick since they earned one last year). These five teams are also the most likely to play spoiler down the stretch, since all of them can put together a competitive performance on any given night.

Tier 6 – Hope Deferred
Team Record wRC+ SP- RP- RAA Team Quality Playoff Odds
White Sox 47-72 -3 86 108 108 -10 28 0.0%
Royals 38-81 -6 86 114 114 18 46 0.0%
Rockies 45-73 2 76 120 100 -12 22 0.0%
Athletics 33-85 0 89 135 128 -11 17 0.0%

If there’s one thing Rockies fans could enjoy about their team during these lean years, it was a winning record at home. Over the last decade, Colorado has posted a losing record in Coors Field twice, and one of those years was the pandemic-shortened 2020 season. They’re at risk of losing that home field advantage this year, having gone 25–30 so far. They still have home series against the Diamondbacks, Braves, Blue Jays, Cubs, Giants, Dodgers, and Twins on the docket, which means they could play a significant role as a spoiler down the stretch — but only if they can turn Coors Field back into a tough place to play in.

Complete Power Rankings
Rank Team Record “Luck” wRC+ SP- RP- RAA Team Quality Playoff Odds Δ
1 Braves 75-42 -1 124 95 84 -6 157 100.0% 0
2 Rangers 70-48 -5 121 91 102 14 167 91.7% 0
3 Rays 71-49 -3 117 88 102 9 154 95.9% 0
4 Blue Jays 66-54 0 108 92 85 -3 148 65.7% 0
5 Dodgers 71-46 0 116 98 95 1 141 100.0% 1
6 Orioles 73-45 8 103 100 86 -8 107 98.4% -1
7 Mariners 63-54 1 103 93 89 12 142 34.6% 0
8 Astros 68-51 0 105 97 97 6 129 90.4% 1
9 Phillies 65-54 2 100 90 93 -2 120 84.2% 3
10 Cubs 61-57 -4 105 101 93 7 131 54.0% -2
11 Twins 62-58 -2 103 87 97 -9 117 90.5% 0
12 Giants 63-55 2 94 97 89 11 113 65.5% -2
13 Brewers 65-54 5 89 96 92 22 103 83.5% 1
14 Padres 56-62 -9 105 89 101 22 148 21.9% -1
15 Red Sox 62-56 0 104 104 95 -39 91 15.6% 1
16 Angels 59-60 0 109 104 106 -4 106 1.9% -1
17 Yankees 60-58 1 96 108 86 9 99 5.7% 0
18 Diamondbacks 59-59 2 99 102 103 15 99 20.7% 0
19 Guardians 57-62 -3 91 93 93 3 101 8.5% 0
20 Marlins 62-57 7 97 95 98 -14 87 44.9% 0
21 Reds 62-58 4 96 109 97 -15 54 23.9% 0
22 Cardinals 52-66 -4 111 106 101 1 119 0.4% 0
23 Pirates 53-65 2 90 105 98 1 67 0.2% 1
24 Mets 53-65 0 101 107 115 -11 62 0.8% -1
25 Nationals 53-66 2 95 111 113 5 63 0.0% 1
26 Tigers 53-65 4 87 107 98 4 62 1.0% -1
27 White Sox 47-72 -3 86 108 108 -10 28 0.0% 1
28 Royals 38-81 -6 86 114 114 18 46 0.0% -1
29 Rockies 45-73 2 76 120 100 -12 22 0.0% 0
30 Athletics 33-85 0 89 135 128 -11 17 0.0% 0

Sunday Notes: Kenley Jansen Looks Back at the 2007 Great Lakes Loons

Kenley Jansen was a 19-year-old catching prospect in the Los Angeles Dodgers organization when he played for the 2007 Great Lakes Loons. Sixteen years and 417 saves later, he looks back at his time in Midland, Michigan fondly. The All-Star closer didn’t hit much — his conversion to the mound in 2009 came for a reason — but the overall experience shaped who he is today.

“I loved everything about that city, man,” said Jansen, a native of Curaçao who also called Midland home in 2008. “It was cold, but probably also my favorite city from my time in the minor leagues. We played at Dow Diamond and that place was packed every night. The fans were great. I lived with Rob Wright and Lori Wright — Danny Wright, too — and I don’t even consider them my host family anymore; they’re part of my family now. I didn’t play very well, but a lot of good things came out of that whole experience. Great Lakes helped transition me from being a kid to being a man.”

The 2007 season was also notable because of his manager and a pair of teammates. Longtime Detroit Tigers backstop Lance Parrish was at the helm of the Midwest League affiliate, the club’s primary catcher was Carlos Santana, and a teenage left-hander was the most-prominent member of the pitching staff. Read the rest of this entry »


Justin Turner On Hitting Heaters

Justin Turner
John Hefti-USA TODAY Sports

Justin Turner has faced a lot of fastballs over the years. Now in his 15th season, and his first with the Boston Red Sox, the 38-year-old infielder has logged 5,597 plate appearances, a good number of them against pitchers with elite heaters. Moreover, he’s had his fair share of success. One of the game’s most-respected hitters, he has a 128 wRC+ to go with a .289/.365/.467 slash line for his career.

Four years after interviewing him for one of the early installments of my Talks Hitting series, I caught up to Turner to focus on one specific aspect of his craft: the art of hitting a fastball.

———

David Laurila: How different is it to prepare for high-velocity fastballs when not all high-velocity fastballs are the same? Does that make sense?

Justin Turner: “It does. There are guys in the game that throw hard and put up big [velocity] numbers, but for whatever reason it doesn’t feel that hard when you’re in the box. There are also guys that don’t throw as hard. but in the box it feels like they’re throwing harder than what the number says. When you get a guy who throws hard and it feels hard, that’s a pretty good combination for their side of it.”

Laurila: Who are some of the pitchers who stand out in those respects?

Turner: “I don’t have a specific example in mind, but there are just some pitchers where you get in the box and… I mean, guys will talk about it. It’s like, ‘Man, that actually feels a little light, it doesn’t feel like 100 [mph].’ I don’t want to call anyone out, trash their fastballs or anything like that.”

Laurila: What about guys where it does feel hard?

Turner:Spencer Strider is a guy that throws hard and it feels hard. Jacob deGrom throws hard and it feels hard. There are guys where the fastball comes out of their hand and it looks like an aspirin. The ball looks smaller because they’re throwing so hard.” Read the rest of this entry »


Pitcher zStats Entering the Homestretch, Part 2 (The Stats!)

Zac Gallen
Nick Wosika-USA TODAY Sports

One of the strange things about projecting baseball players is that even results themselves are small samples. Full seasons result in specific numbers that have minimal predictive value, such as BABIP for pitchers. The predictive value isn’t literally zero; individual seasons form much of the basis of projections, whether math-y ones like ZiPS or simply our personal opinions on how good a player is. But we have to develop tools that improve our ability to explain some of these stats. It’s not enough to know that the number of home runs allowed by a pitcher is volatile; we need to know how and why pitchers allow homers beyond a general sense of pitching poorly or being Jordan Lyles.

Data like that which StatCast provides gives us the ability to get at what’s more elemental, such as exit velocities and launch angles and the like — things that are in themselves more predictive than their end products (the number of homers). StatCast has its own implementation of this kind of exercise in its various “x” stats. ZiPS uses slightly different models with a similar purpose, which I’ve dubbed zStats. (I’m going to make you guess what the z stands for!) The differences in the models can be significant. For example, when talking about grounders, balls hit directly toward the second base bag became singles 48.7% of the time from 2012 to ’19, with 51.0% outs and 0.2% doubles. But grounders hit 16 degrees to the “left” of the bag only became hits 10.6% of the time over the same stretch, and toward the second base side, it was 9.8%. ZiPS uses data like sprint speed when calculating hitter BABIP, because how fast a player is has an effect on BABIP and extra-base hits.

And why is this important and not just number-spinning? Knowing that changes in walk rates, home run rates, and strikeout rates stabilized far quicker than other stats was an important step forward in player valuation. That’s something that’s useful whether you work for a front office, are a hardcore fan, want to make some fantasy league moves, or even just a regular fan who is rooting for your faves. If we improve our knowledge of the basic molecular structure of a walk or a strikeout, then we can find players who are improving or struggling even more quickly, and provide better answers on why a walk rate or a strikeout rate has changed. This is useful data for me in particular because I obviously do a lot of work with projections, but I’m hoping this type of information is interesting to readers beyond that.

Yesterday, I went over how pitchers zStats for the first two months of the season performed over the last two months. Today, we’ll look at the updated data, through the games on August 10. Read the rest of this entry »


What a Difference Ten Days Can Make as Postseason Odds Shift and Swing

Dylan Moore
Stephen Brashear-USA TODAY Sports

After a frantic trade deadline with an excess of buyers, a few committed sellers fielding offers, and a handful of in-betweeners on the cusp of contention, the month of August is doing its best to separate the real contenders from the rest. Ten days in, five teams — the Angels, Yankees, Guardians, Reds and Diamondbacks — have seen their playoff chances slashed by more than half, and a sixth (the Red Sox) has gone from 24.6% to 13.8%. Meanwhile, the Rangers responded to a late-July skid with an eight-game winning streak, the Cubs doubled their playoff odds with series wins over the Reds and Braves, the Phillies played their way into the top Wild Card spot in the National League, and the Mariners swept the Angels and Padres to leapfrog New York, Boston, and Los Angeles in the AL Wild Card race. It’s been quite the shuffle for a ten-day stretch.

Biggest Changes in Playoff Odds in August
Team Entering August Today Change
Cubs 24.50% 50.40% 25.90%
Phillies 66.30% 87.90% 21.60%
Mariners 18.80% 39.40% 20.60%
Twins 70.70% 85.90% 15.20%
Rangers 75.00% 87.80% 12.80%
Giants 60.90% 72.90% 12.00%
Brewers 65.40% 75.90% 10.50%
 
Mets 11.90% 1.70% -10.20%
Red Sox 24.60% 13.80% -10.80%
Yankees 23.10% 9.00% -14.10%
Guardians 27.80% 12.30% -15.50%
Angels 19.50% 2.40% -17.10%
Reds 46.20% 20.90% -25.30%
Diamondbacks 47.70% 17.00% -30.70%

Read the rest of this entry »


Five Things I Liked (Or Didn’t Like) This Week, August 11

Cavan Biggio
David Richard-USA TODAY Sports

Another week, another chance to look around baseball and see something that amazes you. That’s part of what I love about the game: weird and wonderful things are always happening. As always, I noted a few that particularly tickled my fancy, and now I’m going to write a bunch of words about them in the hope that you like them too. Shout out, per usual, to Zach Lowe, who came up with this idea for a column years ago and became my favorite basketball writer as a result. Let’s get going.

1. Cavan Biggio’s Instinctual Brilliance
When the Jays’ trio of legacy-admission prospects were breaking into the majors, I was highest on Cavan Biggio relative to industry consensus. I’ve definitely been wrong in that assessment. Bo Bichette and Vladimir Guerrero Jr. turned into stars, but Biggio is more of a luxury backup. He can play a lot of defensive positions, but none of them particularly well, and he’s a league-average hitter. That’s a perfectly serviceable addition to your team, but it’s hardly going to set the league on fire, and he’s been worse than that in 2023.

But my Biggio crush is still around, and you better believe that I’m going to highlight his fun plays. Let’s set the scene: Monday night in Cleveland, a scoreless game in the top of the eighth. Biggio drew a start at second base, and with Daulton Varsho on first, he clubbed a no-doubter to dead center to give the Jays a 2–0 lead. Hey! Biggio heads, unite, he’s back in business. Read the rest of this entry »


Yusei Kikuchi Is Keeping the Ball in the Yard for a Change

Gary A. Vasquez-USA TODAY Sports

The Toronto Blue Jays have devoted huge resources to their rotation, spending a first-round pick on Alek Manoah, doling out huge free agent contracts to Chris Bassitt and Kevin Gausman, and trading the farm for José Berríos. (And then giving Berríos a huge contract extension as well.)

But Toronto’s best starting pitcher over the past month — and in a three-way tie for the best pitcher in all of baseball, by WAR — has been Yusei Kikuchi, the guy who couldn’t stay in the rotation a year ago. Read the rest of this entry »


How the Draft and the Trade Deadline Affected Our Farm System Rankings

Stephen Brashear-USA TODAY Sports

A large portion of every season’s prospect-related transaction activity takes place between the draft and the trade deadline, a window that, since the draft was moved to July, spans just a few weeks. We can use the way the FanGraphs farm system rankings are calculated to track movement during this period on the baseball calendar and hopefully come to more fully understand how successful rebuilds are born. Over time, we can better contextualize trade and draft hauls by using this methodology to build a historical understanding of prospect movement. Mostly though, these rankings track the depth and impact of talent in each farm system at a specific moment in time. Or, in the case of the below links and tables, four moments in time. There are some methodological caveats to pass along (I’ll get to those momentarily), as well as some very specific examples where the movement communicated in the tables below does not properly capture team activity during the last month of trades and draft signings (which I get into throughout this post).

Let’s start with some basic disclaimers. Remember that while the Craig Edwards research that facilitates this approach is empirical, my subjective player evaluations (and their resulting Future Values) feed the formula that spits out the farm rankings. Just one significant over- or under-evaluation of a player can shift the way a team lines up in these rankings pretty dramatically, especially if you’re focused on the ordinal rankings. The monetary values, in addition to providing an approximate measure and reminder of how the draft and international amateur processes suppress what these guys might earn on an open market, illustrate the ways systems are spaced and clustered with more nuance. If I’m way too light or way too heavy on any single impact prospect, I’m basically infecting a list with half a standard deviation’s worth of error in this regard because Craig’s math favors top-heavy systems rather than ones with depth. Read the rest of this entry »


Effectively Wild Episode 2045: The Designated Hugger

EWFI
Ben Lindbergh, Meg Rowley, and Patreon supporter Samuel Giddins banter about Samuel’s baseball background and history with Effectively Wild, before (9:52) discussing a Juan Soto quote and the type of disappointing team that’s most frustrating. Then (21:35) they answer listener emails about randomizing on-field decisions, the legibility of player autographs, whether teams should employ designated huggers, whether veterans are more clutch, whether we’re misusing the phrase “heating up,” what would happen if Shohei Ohtani asked the Angels to release him, whether teams in a robo-umps world should alternate tall and short hitters in the lineup, offering Ohtani an ownership stake, why we use miles per hour for pitch speeds instead of feet per second, using a matching process in the amateur draft, whether anyone could make a trade if they found a GM’s unlocked phone, mascots as zombie runners, and playoff teams without .300 hitters, plus a Future Blast (1:41:34) from 2045 and a follow-up postscript on a White Sox (un)fun fact.

Audio intro: Benny and a Million Shetland Ponies, “Effectively Wild Theme (Pedantic)
Audio outro: Beatwriter, “Effectively Wild Theme

Link to Samuel’s website
Link to Soto quote
Link to Soto quote source
Link to Neil Paine on the unlucky Padres
Link to The Athletic on autographs
Link to Russell on postseason experience
Link to Russell on pennant-race experience
Link to tweet about Judge/Altuve zones
Link to tweet about Judge’s zone
Link to article about Judge/Altuve zones
Link to old FG post on Judge’s zone
Link to older FG post on Judge’s zone
Link to old FG post on Altuve’s zone
Link to older FG post on Altuve’s zone
Link to EW Stanky Draft
Link to KG on player owners
Link to Goold on player owners
Link to details about Beckham’s contract
Link to list of MLB mascots
Link to data on teams without .300 hitters
Link to graph of teams without .300 hitters
Link to Ryan Nelson on Twitter
Link to EW listener emails database
Link to Rick Wilber’s website
Link to Future Blast wiki
Link to Ben Clemens on Littell
Link to tweet about the Sox
Link to Sox high-K games
Link to worst WP w/13+ K
Link to worst WP w/12+ K

 Sponsor Us on Patreon
 Facebook Group
 Twitter Account
 EW Subreddit
 Effectively Wild Wiki
 iTunes Feed (Please rate and review us!)
 Get Our Merch!
 Email Us: podcast@fangraphs.com


How’s That New Cutter Treating You?

Sonny Gray
Jeff Curry-USA TODAY Sports

Do you remember the springtime? We were so young and carefree, so full of hope. We hadn’t even breathed in our first lungfuls of Canadian wildfire smoke. Pitchers were full of hope, too. They’d spent the whole offseason in a lab, or playing winter ball, or maybe just in a nice condo, trying to figure how to get better.

Amazingly, a lot of them settled on the exact same recipe for success: start throwing a cutter. You couldn’t open up a soon-to-be-shuttered sports section without reading an article about some pitcher whose plan for world domination hinged on whipping up a delicious new cut fastball. Now that we’re in the dog days of summer, it’s time to check and see how those cutters are coming along. Are they browning nicely and just starting to set? Or have they filled the house with smoke, bubbling over the sides of the pan and burning down to a carbonized blob that needs to be scraped off the bottom of the oven with steel wool?

I pulled data on every pitcher who has thrown at least 400 pitches in both 2022 and ’23, focusing on the ones who are throwing a cutter at least 10% of the time this year after throwing it either infrequently or not at all last season. These cutoffs did mean that we missed some interesting players like Brayan Bello and Danny Coulombe, but we’re left with a list of 25 pitchers.

So did their new toys turn them into peak Pedro? The short answer is no. Taken as a whole, they’ve performed roughly as well as they did last season. As you’d expect from any sample, roughly half our pitchers got better, and half got worse. Of the pitchers who improved from last year to this year, I don’t think I can definitively say that any of them reached new heights specifically because of the cutter. Read the rest of this entry »