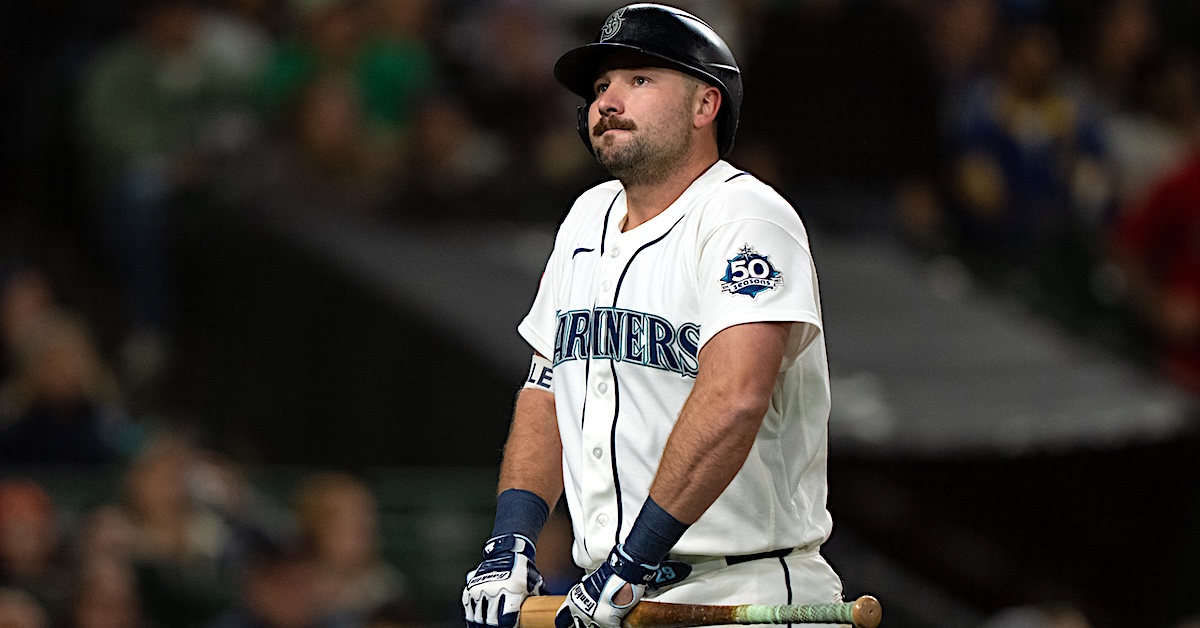
When looking at most April stats, especially the basic ones, I spend a lot of time issuing disclaimers about small sample sizes. After all, any player can do just about anything in 25 or 50 or 100 plate appearances. I’m pretty confident that Joey Wiemer is not going to end the season as the NL MVP, and that Hunter Barco won’t finish the season with the worst WAR in major league history. But conversely, when we’re talking about standings, even if bad/good starts shouldn’t necessarily overconcern us about a player’s future, when it comes to teams, playoffs are determined by wins, which are cumulative numbers with razor-sharp margins. It’s not the end of the world if Cal Raleigh, because of his slow start, finishes with 38 homers instead of his projected 41 (ZiPS DC), but it may doom the Mariners if they underperform their projections by three wins.
The season is just a week old, but there are already sizable impacts in playoff probabilities around the league. To demonstrate this, I ran ZiPS overnight to get the updated playoff odds, so I could compare them to the preseason projections. Six teams have seen their playoff odds change by at least five percentage points. Here’s the full table, as things stand on Friday morning.
Eric A Longenhagen: What’s up hosers? Good afternoon from Catasauqua, PA where I’m seeing family and baseball (mostly Nats affiliates) through next week.
12:02
Guest: Is it possible that Jefferson Rojas has gotten back on track? True that he’s put on muscle?
12:05
Eric A Longenhagen: We didn’t think he ever got off track so much as he was a young player with an aggressive assignment last year. We had him as the top prospect in the system entering the year, 55th overall. He absolutely looks stronger, was selling out for power a little more than I liked when I saw him during the spring, though some of that was probably Breakout Game pressing.
12:05
Lord Thunder: With 17 walks in 15-plus innings including spring training, how long of a leash does Bubba Chandler have before he walks himself back to Triple-A?
12:08
Eric A Longenhagen: I wish Jared Jones were going to be ready to go sooner than mid-to-late May because there’d be a nice, natural swap there if Chandler is this wild until then. You’re seeing why we had McLean ranked first among pitchers and Chandler in the tier behind him. I’m not too worried about it, long term, athletes with this kind of arm speed tend to take a minute to reign it in. They could just let him struggle and learn on the fly and I think it’d be fine. Don’t burn an option year unless you really, really have to.
12:08
Jim: How fast should Jamie Arnold move through the minors?
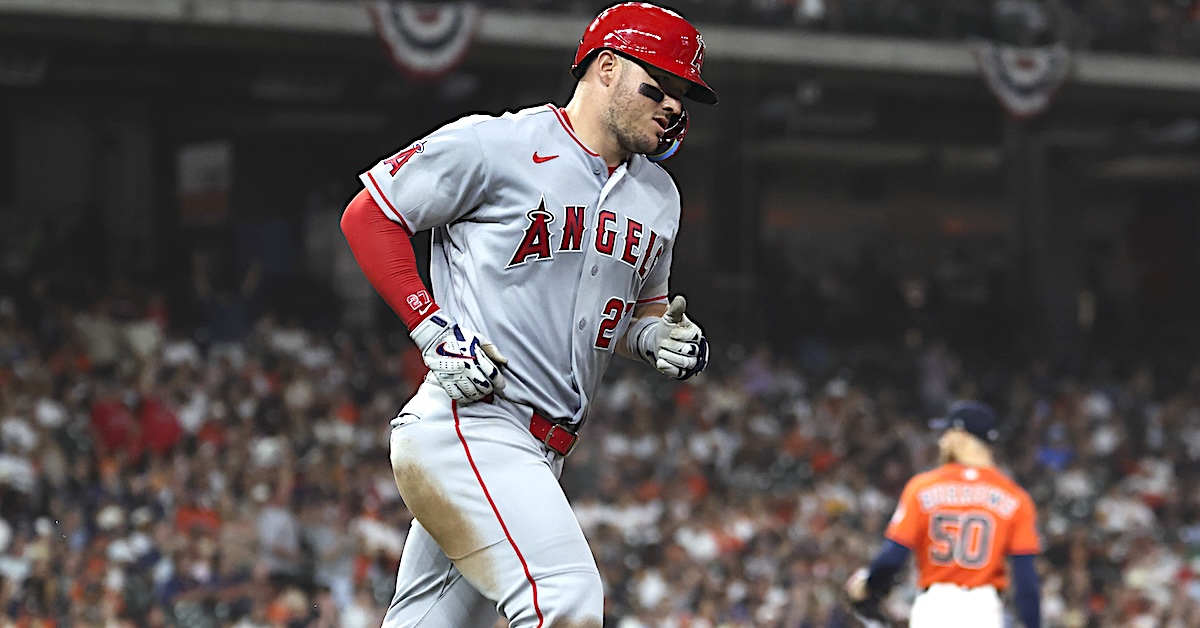
Let me tell you a story about a 34-year-old baseball player. Seven games into the new season, there are some worrying signs about his performance. His swing speed is down half a tick, and two full ticks from 2024. His fast-swing rate has declined precipitously. He’s squaring the ball up less frequently than ever, the opposite of what’s supposed to happen when you rein in your swing. He’s never run a lower hard-hit rate. He’s never run a higher infield fly ball rate. Somebody call an ambulance.
… But not for him. The hitter in question is Mike Trout, and he’s off to a scorching start. He’s slashing an absurd .261/.485/.522, good for a 192 wRC+. Whenever process statistics and result statistics diverge this much, this early in the season, I’m tempted to yell “April” in my best Dan Szymborski voice and move on. But when it’s Trout, one of the best players of all time, I’m willing to be more open-minded. Let’s take a quick peek into what’s changed, what hasn’t, and what’s too early to tell.
The most obvious change in Trout’s statistics this year is that he’s walking 30% of the time. Walks have always been a part of Trout’s game, of course. He has a keen eye at the plate, annually notching one of the lowest chase rates in the game, and he makes enough contact that he can grind his way back into at-bats even after falling behind. But 30% is double his career rate. What gives? Read the rest of this entry »
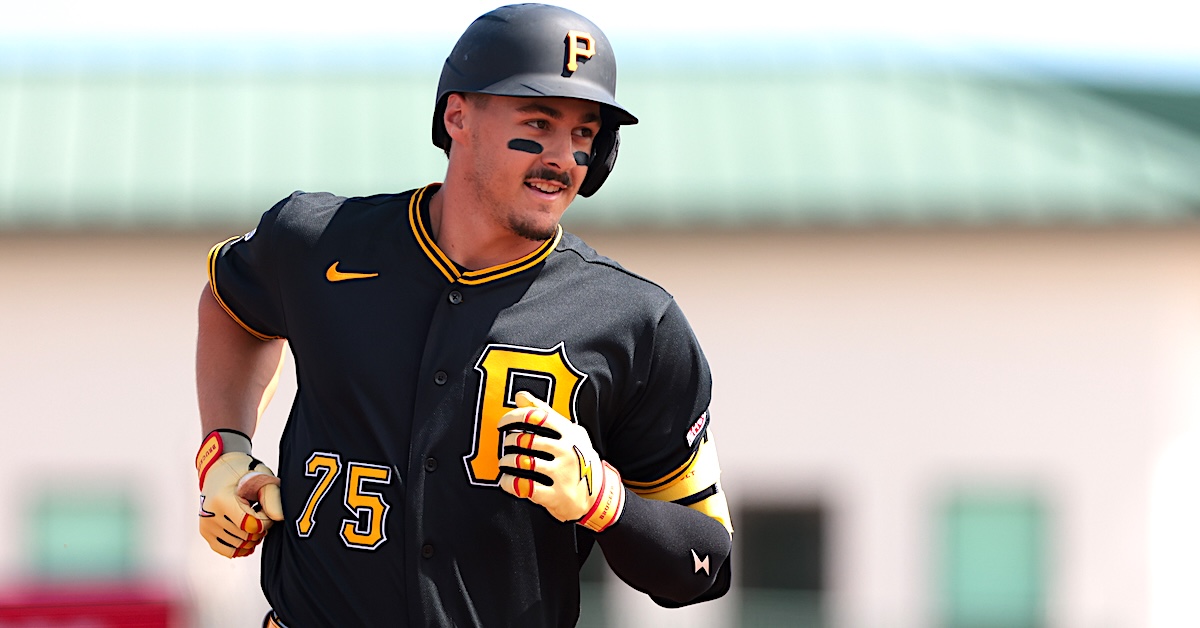
It feels incredibly weird to say this but… it’s a good time to be a Pirates fan? Because Konnor Griffin is coming to the majors. He’ll make his major league debut in Pittsburgh’s home opener on Friday.
Griffin was the Pirates’ first-round pick in 2024, ninth overall, and quickly emerged as the no. 1 overall prospect in baseball. A team that’s been as bad as the Pirates, for as long as they’ve been bad, will have some familiarity with the ballyhooed prospect debut, but I’m not sure even they’ve seen anything like this. I was as big a Paul Skenes fan as anyone, and as pumped as I was to see him hit the majors, he’s surpassed even my expectations.
Well, now Skenes is in the majors to stay. So is Bubba Chandler. The Pirates flirted with spending some money this past offseason, and while a 3-3 record is the definition of unremarkable, the Pirates just went on the road and played the Mets and Reds — two of their erstwhile NL playoff rivals — to a draw. The Pirates might be kind of OK. Life hasn’t been this good, genuinely, in more than 10 years.
But Griffin’s debut is the main event. Because as big as the hype around Skenes was, the expectations for Griffin are even greater. Read the rest of this entry »
Jason Martinez: Welcome to the 1st RosterResource chat of the 2026 regular season. “Happy Konnor Griffin MLB Debut Eve” to those who celebrate.
2:01
Stu: Who gets kicked out of the Yankees rotation when Cole and rodon are back? Thinking about selling Weathers before a potential move to the bullpen, is that premature?
2:03
Jon Becker: They’ve got a lot of time to figure that out (and maybe it’ll get figured out for them) with Cole not back until June. Best guess for right now is Luis Gil, since he didn’t make the season opening rotation and wasn’t good last year, so he’s got the most to prove. I wouldn’t completely discount the possibility of Weathers to the bullpen at some point (playoffs?) but he’d have to be truly awful for it to be the move in the first half of the season. They traded for him to start.
2:03
Bryan Baker: is he really the closer?
2:04
Jason Martinez: You never know with the Rays, who might be just as likely to go with Kevin Kelly for a 1-out save than the most obvious choice. At least for tomorrow, they can’t trust Griffin Jax after his last outing (and he’s also allowed a run in 3 of 4 appearances). And Garrett Cleavinger has walked 2 batters in each of his last 2 outings. Baker looks great so far. He’d be my pick. But things can change quickly.
2:05
Pistol Pete: Red Sox need a shake-up … do you see any big changes?
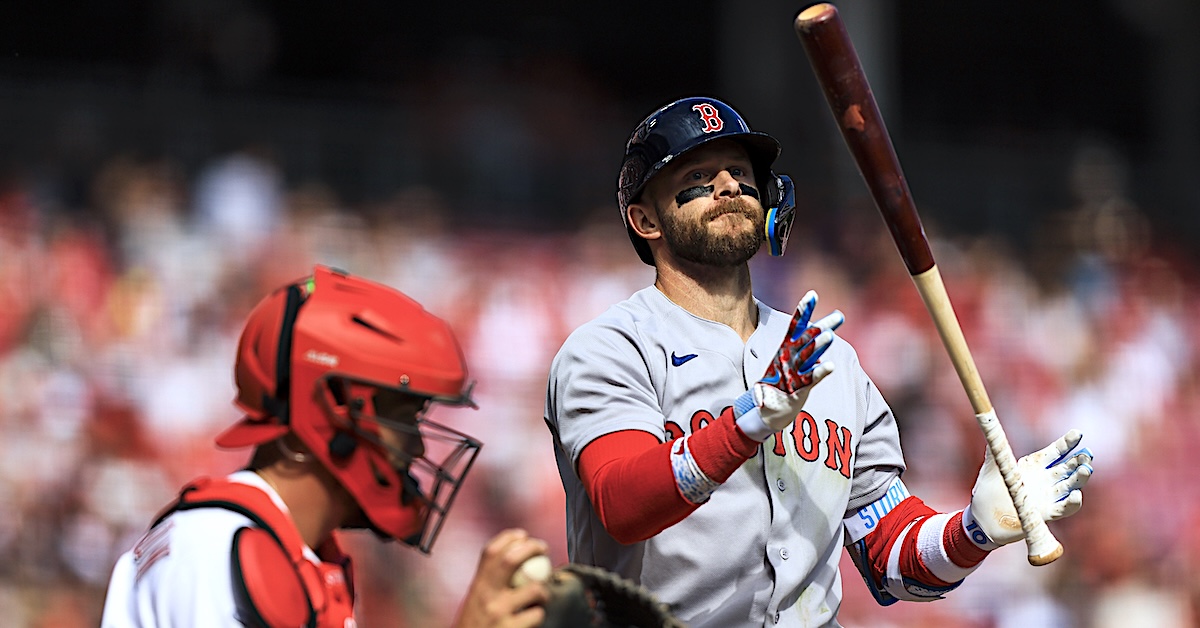
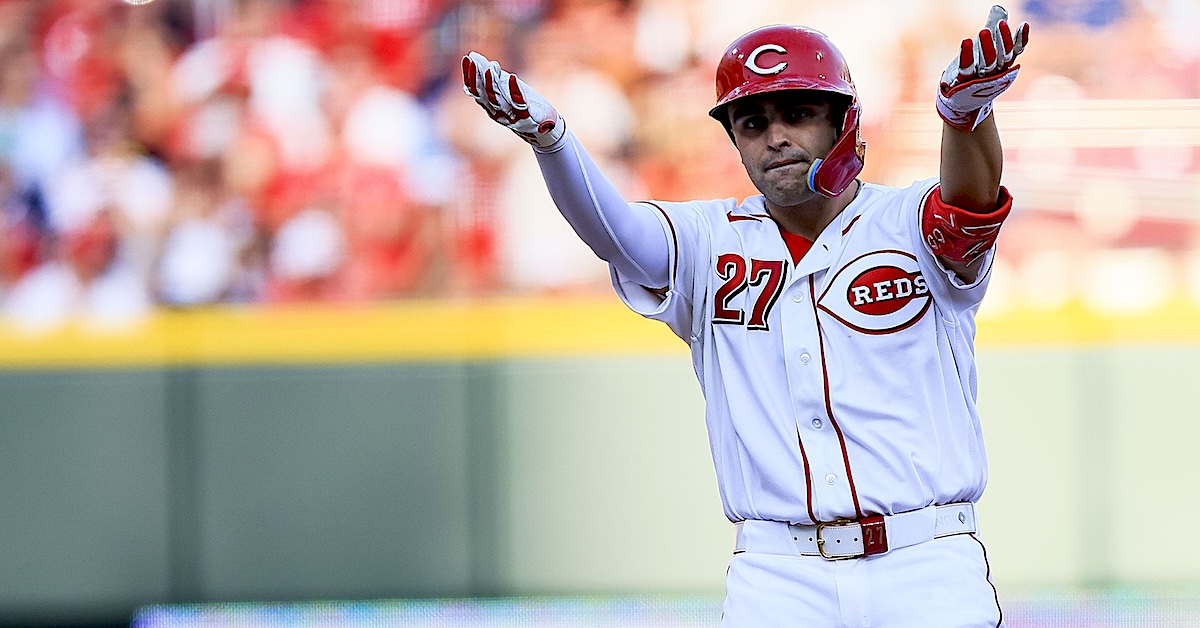
Sal Stewart made a promising showing when the Reds called him up last September, clubbing five home runs in 18 games while helping Cincinnati reach the postseason for the first time since 2020. His 2026 campaign is off to a flying start, as well. Not only did he bank NL Player of the Week honors for the season’s opening week, but his performance underscores the notion — supported by both scouting and statistical projections — that he’s leveled up significantly.
Through the Reds’ first six games, the 22-year-old first baseman has put up video-game numbers, batting .474/.615/.947 (313 wRC+) with two homers in 26 plate appearances. His hot streak began with an eventful Opening Day; while the Reds lost to the Red Sox, 3-0, it was hardly his fault. He went 3-for-4, including a pair of bases-empty doubles, one apiece off starter Garrett Crochet and reliever Garrett Whitlock, as well as a single to right field off Crochet with men on first and second. With third base coach Willie Harris wary of testing two-time Gold Glove winner Wilyer Abreu’s arm, lead runner Matt McLain was held up and ultimately stranded.
Stewart also survived a scare in the fifth inning, when a 110-mph liner off the bat of Roman Anthony hit his left wrist as he tried to backhand the ball. He was shaken up but remained in the game, and reassuringly collected two of his three hits after being drilled. Read the rest of this entry »
Frank Bowen IV/The Enquirer-USA TODAY NETWORK via Imagn Images
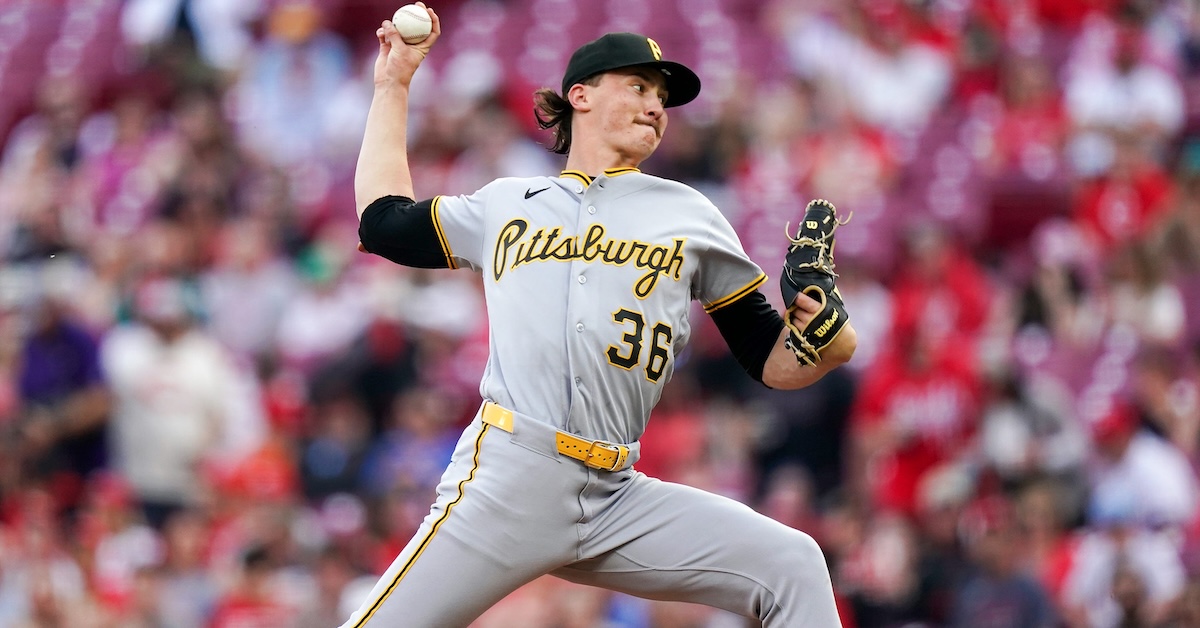
In Bubba Chandler’s first start of the 2026 season, he didn’t allow a single hit. Oh yeah, and he struck out more than 30% of the batters he faced. Spectacular! Just, um, don’t look over at the walk column. Oh, you did? Yeah, fine, he walked more than 30% of the batters he faced, too. Oh, and he allowed a run, and didn’t get out of the fifth inning. To understand what Chandler was up to, and what it might mean for the rest of his year, we’ll have to dig a little deeper.
Chandler leaned heavily on his fastball to start his year, as many pitchers do in their first appearance of the season. He breezed through the first inning with 11 straight fastballs, eclipsing 100 mph on the radar gun four times and essentially daring the Reds to hit it. TJ Friedl waved feebly at 100 above the zone. Matt McLain did the same. Chandler’s fastball is dynamite, particularly when he’s locating it high. It explodes upwards, and some offseason tweaks have it moving less arm side than before, making it even harder to square up.
I could watch a montage of Chandler overpowering Reds hitters all day. In fact, you can too:
You can see how difficult it is to track Chandler’s fastball by watching the check swings. The pitch that Jose Trevino, the last batter in that loop, offered at was more than a foot above the zone. The combination of velo, movement, and Chandler’s loping delivery means that hitters have a lot of trouble figuring out where the ball is going. Read the rest of this entry »
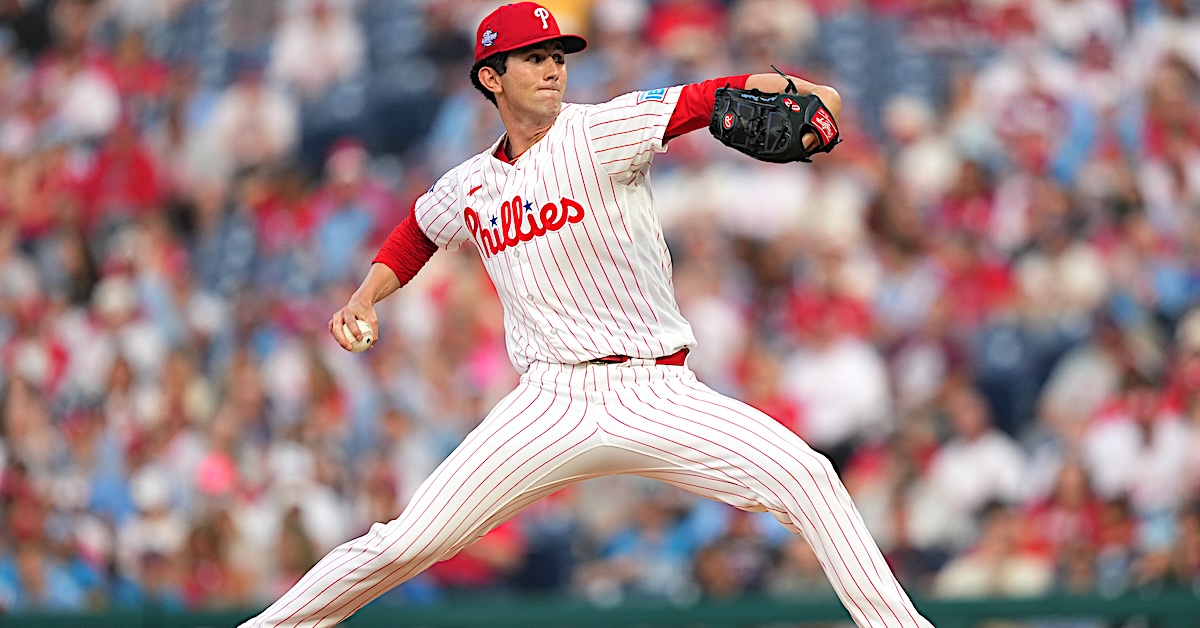
Andrew Painter made his major league debut on Tuesday, as the Phillies were coming off a three-game losing streak. That’s a tough assignment; I know it’s the first week of the season, but that has never stopped Phillies fans — who even in the best of times are always looking for a reason to jump off a bridge — from declaring the team irretrievably cooked.
Not so fast, my friends. Because anyone who’s willing to overreact to a one-game sample in April must be over the moon about Painter.
Painter, who turns 23 next month, was one of the top pitching prospects in the entire sport in the 2022-23 offseason. At age 19, he was promoted to Double-A, where he posted a 2.54 ERA in five starts and struck out 37, while walking just two, in 28 1/3 innings. As 2023 dawned, there was a not-unreasonable expectation that Painter would contribute down the stretch in his age-20 season, perhaps as a bullpen stopper, like a young David Price or Adam Wainwright, or perhaps in the rotation. (Remember, this was before Cristopher Sánchez turned into the world-destroying ace he’s become.)
But Painter’s elbow started barking, and an early hesitation to sending him to get Tommy John surgery led to both 2023 and 2024 being written off. With two years of rust, Painter struggled in 2025, pitching to an ERA over 5.00 across two minor league levels, and the first single-digit K/9 ratio of his professional career. The Phillies pitched well last postseason, but they still could’ve used Painter. He simply hadn’t earned the call-up that he’d seemingly had in the bag since early 2023.
He dropped his arm slot and lost a ton of life off his fastball while returning from Tommy John, but the promise remained. He was no longer the top pitching prospect in baseball, nor the top prospect in the Phillies’ system, but he rated no. 27 overall this past offseason and eighth among pitching prospects, with a 55-FV grade. This is still Philadelphia’s most anticipated rookie pitcher since at least Cole Hamels.
It speaks to the Phillies’ faith in the young right-hander that they did not go out and get anything resembling a like-for-like replacement for the departing Ranger Suarez. With Zack Wheeler on the mend from thoracic outlet syndrome, that left Painter in the big league rotation with no safety net. I genuinely do not know who starting pitcher no. 6 is for the Phillies right now, but I am confronted with the possibility that it might be Bryse Wilson if 40-man roster glut were not a consideration.
So, yeah, there’s a bit of pressure on Painter.
If he was feeling that pressure, you couldn’t tell. Painter, who stands an Ent-like 6-foot-7, strolled serenely to the mound for his first competitive big league action. And as good as the stuff and the results were — don’t worry, I’m getting there — Painter’s composure seemed to impress his teammates most.
But it doesn’t matter how calm a rookie pitcher is if he’s throwing slop and getting shelled. So let’s check Painter’s stuff and results.
Yes, the Nationals’ lineup isn’t that good overall, but it features a few challenging hitters: CJ Abrams, Daylen Lile, and the genuinely capital-D Dangerous James Wood. Joey Wiemer is coming off a run of literally not making an out for 10 straight plate appearances, though it looks like the magic (or quantum ray power) has finally worn off.
The value proposition for Painter is that there’s nothing weird about him. He’s just what an ace looks like. He’s huge, he throws hard, he has a varied arsenal of six pitches… there’s just nothing to talk yourself into on the scouting report.
Painter throws two fastballs, a four-seamer and sinker, both of which sat 94-97 and topped out at 98.7 mph. He hit that figure twice in the first inning, when he was freshest and the adrenaline was surely pumping hardest, but he got back to 98.6 mph in the fourth.
Like a lot of modern starters, Painter has one look for left-handed hitters and another for righties. The platoon advantage works because breaking balls move away from same-handed batters and toward opposite-handed hitters. So pitchers like Painter, who have multiple fastballs and breaking balls, want to work side-to-side against same-handed batters and up-and-down against opposite-handed ones. That means four-seamer, sinker, slider, sweeper against righties, and four-seamer, slider, curveball, changeup against lefties in Painter’s case.
Nationals manager Blake Butera loaded up on the former. With six lefties and two switch-hitters in the lineup, Wiemer was the only right-handed batter Painter faced all evening, so we saw a lot of his four-seamer, slider, curveball, and changeup, and relatively little of his sinker and sweeper.
Painter was kind enough to get at least one strikeout on each pitch from that first group of four, so that you can see all of them in this highlight video.
Painter’s first and last strikeouts came against Wood, and both came from working fastball up, curveball down, to change Wood’s eye level and mess up his timing. He struck out in the fifth inning after taking an 80.6-mph curveball for a strike, and then chasing a 97.2-mph four-seamer up and away.
With the fastball and curveball established, Painter could tunnel his changeup into a middle ground in terms of movement and speed. The scouting report on Painter has “FASTBALL VELOCITY” and “NASTY CURVEBALL” written in all caps, but the changeup is a new weapon, perhaps the only positive development from his forgettable 2025 season in Lehigh Valley.
He was able to paint the bottom left-hand corner of the strike zone with his changeup to get Luis García Jr. looking in the third, and he did it again to Jorbit Vivas in the fourth. Both of those pitches were right on the edge of the zone, but Painter worked there so effectively that the Nats were out of challenges when Vivas tried to summon ABS to bail him out.
And when Painter did allow contact, it was pretty innocuous. He let up 12 balls in play out of 21 batters faced. Only three of those batted balls had an xBA of .100 or higher, and only one reached Baseball Savant’s hard-hit threshold of 95 mph. That was the last pitch Painter threw all night: Abrams ripped it to right for a single, and Phillies manager Rob Thomson, wanting his rookie starter to go out on a positive, pulled the plug.
The damage the Nats did against Painter, such as it was, didn’t do much to discredit the rookie’s effort. Lile seemed to have Painter’s number, reaching twice, but one of those two came on a popup that four different Phillies lost in the lights. As a general rule, when someone tags Jon Bois on social media with “watching baseball,” it doesn’t speak well of what’s depicted.
The state of perpetual garment-rending around the Phillies might be unhelpful, as I mentioned up top, but as debuts go, at home in April against the Nats is a pretty soft assignment for a rookie. Painter aced it, so to speak, but that success only earns him a new set of questions to answer. Can he get it done against deeper lineups? Can he survive a third time through the order? Can he hold his velocity? If so, how far up the rotation can he climb — a question that could become quite relevant given the questions about Wheeler’s health and Aaron Nola’s getting abducted by aliens last year.
But that’s life in the big leagues. The hits just keep on coming. Or, in Painter’s case, maybe they won’t.
This is a free preview of a paid episode. To hear more, please visit our Patreon.
Ben Lindbergh and Meg Rowley banter about rookie batters’ blistering start to the season, then Stat Blast (10:15) about how long it typically takes for there to be no remaining teams that are winless or undefeated (or both), the latest a team won or lost by a margin that matched its record, and the seasons that featured the most Hall of Famers (at all, and in their primes). Then they talk to three listeners who created brand-new apps/sites that enhance the experience of following the season: Tristan Rodman of Baseball Scores (28:00), Zach Gines of First Pitch (46:45), and Ezra Thompson of Play-O-Graph (1:09:30), followed by assorted updates (1:26:58).
The Mariners did not record a single in their first two games of 2026. No team had ever done that in major league history. In fact, only eight teams have ever gone back-to-back games without a single, according to MLB.com’s Sarah Langs.
The reason is obvious. The Mariners didn’t hit a single because they didn’t put the ball in play very often. And frankly, how could they? Guardians pitchers threw less than 40% of their pitches in the zone, and the Mariners were forced to lay off them, drawing walks in 13.6% of their plate appearances during those two games. When the Guardians did enter the zone, the Mariners struggled to make contact, striking out 35.8% of the time. That means only 34 (50.8%) of their plate appearances ended with a batted ball. And because the Mariners employ a number of sluggers, six of those batted balls flew over the fence. Read the rest of this entry »