Editor’s note: This story has been updated to reflect that the results of Justin Turner’s initial COVID test were inconclusive, prompting the processing of his second test to be expedited. That test was positive, resulting in his removal from the game.
The players gathered on the field in various states of face-covering. The winning team was at home, but wasn’t; they gathered in the middle of a dark, huge, faraway stadium, with fans spread haphazardly in the stands, some gathered in jubilant, worrying clusters. And as the trophies were about to be presented, the broadcast was interrupted by an announcement: Justin Turner, one of the most important members of this team for the past eight years, had exited the game mysteriously in the eighth inning. The reason for that exit, the public was somberly told, was that he had received a positive COVID-19 test.
But then, all of a sudden, it cut back to the field, to the smiling, hugging, weeping players, the speeches and the trophies and the booing and the cheering, just as if it was a normal World Series. Even Turner got his on-field shot with the trophy, despite being removed from the game to be isolated and prevent the spread of infection; even Turner joined the team for their group photo.
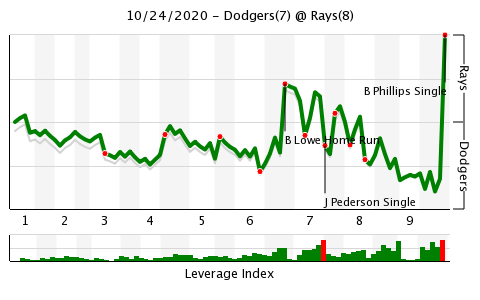
The pandemic rages on, even within the confines of the diamond: a place that so often attempts to shelter itself from the realities of living in society, that had been fighting to keep their bubble — or, at the very least, its appearance — intact. Turner’s test results from yesterday were, apparently, revealed to be inconclusive in the second inning of tonight’s game. His test results from today were confirmed positive later. And yet, they kept playing baseball, right to the very end, through Game 6 of the World Series, with over 11,000 fans in attendance. The Dodgers, appearing in their third Fall Classic over the last four seasons, beat the Rays 3-1. In this truncated, bedeviled, dubious season, in a world rife with uncertainty, and heading into a dark and fearful winter, it was the best team in baseball that emerged victorious. And now, with Turner’s positive test and the questions it raises, the best team in baseball leaves their celebration not to celebrate further, but to rapid testing and quarantining — a shadow hanging over the sublime joy of a championship a long time in the making.
Just a few hours ago, though, none of this — Turner, COVID, the questions facing MLB and the Dodgers going forward — was in the game story. The game story was Randy Arozarena putting an exclamation point on his historic postseason, hitting his 10th October home run off Tony Gonsolin in the first to put the Rays up 1-0. When we look back on this October, Arozarena’s out-of-nowhere explosion into the most fearsome hitter on any postseason team’s lineup, a bonafide star carrying the Rays’ offense on his back, will certainly be near the top of the list of memorable moments.
And the game story was the Dodgers’ bullpen, so often postseason goats, who took over from the clearly struggling Gonsolin after just five outs in what was intended to be a full start from him. It was Dylan Floro, who came in with two on in the second and struck out Arozarena on three pitches to end the inning. It was the mostly-sidelined Alex Wood pitching two perfect, shockingly efficient innings of middle-relief; Pedro Báez, to whom much is always, somehow, given, redeeming the two-homer egg he laid in that wild Game 4; Victor González, who bailed out Báez after Arozarena got yet another hit; Brusdar Graterol, who overcame his wildness — and got a little help from Cody Bellinger’s superb fielding in center — to record two outs in the seventh; and Julio Urías, who closed out the NLCS, once again shutting down the opposing team over the final innings of the game. Read the rest of this entry »