The Ridiculous Firewagon Offenses of College Baseball
The pros are still moseying on down to Florida and Arizona for training camp, but the college baseball regular season starts today. I’ve long been an evangelist for the college game, and it’s hard to overstate how much more accessible it has become just in the past 15 to 20 years. Basically every power conference game gets aired either on cable or streamed on ESPN+ or a similarly accessible provider. I remember having to calculate OPS by hand from the press box in the mid-teens; now FanGraphs has wRC+ for every Division I player, while D1Baseball puts out batted ball stats.
And the quality of play is better now than it’s ever been. That’s true in most sports; societal standards of nutrition and fitness only tend to go up over time, as does the human understanding of science. And the past decade has seen not one revolution in college baseball but several. Professional-quality, data-driven coaching techniques have hit the amateur game. The truncation of the draft to 20 rounds and the imposition of bonus caps have led more elite prospects to college baseball, and the loosening of transfer policy has led more players to find programs where they can flourish.
In every way that matters, Division I baseball is more like the professional game than it’s ever been. So the statistical environments of the two forms of baseball should be pretty similar, right?
Oh, buddy.
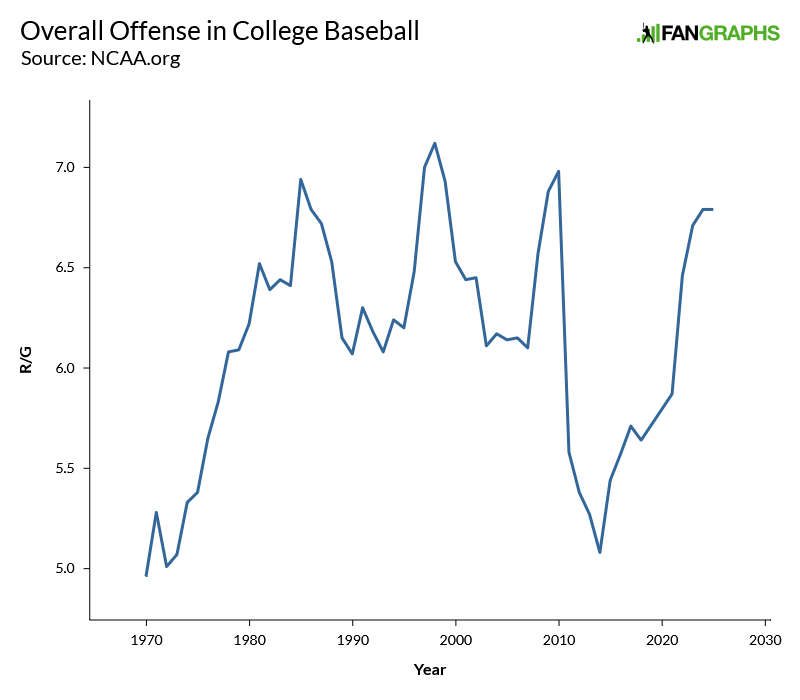
College baseball is a pretty wild offensive environment right now, even by its own standards. See, unlike MLB, the NCAA is pretty open to putting its thumb on the scale to influence the competitive environment. Metal bats came in in 1974, then bat standards were changed in 1999 and again in 2011 to counteract increasingly home run-happy offensive environment:
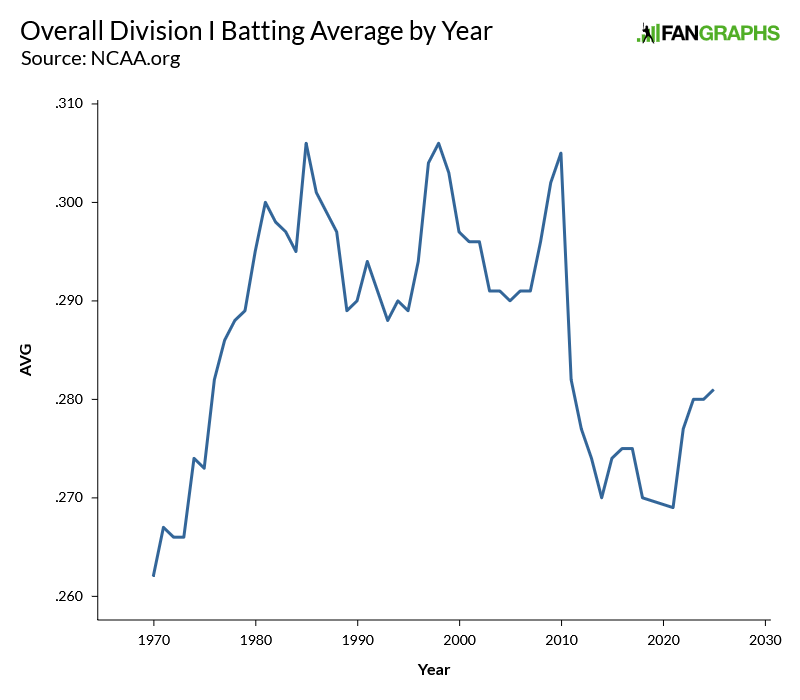
The last switch, to the BBCOR standard in 2011, went a little too far. Offense went through the floor, as you can see in that chart. The same year, the College World Series changed venue. Old Rosenblatt Stadium played like Coors Field; its replacement, which is now called Charles Schwab Field, was not only bigger, it faced into the prevailing wind. In the early 2010s, you had to be Kris Bryant to even get the ball to within 10 feet of the warning track in Omaha, and the abrupt change highlighted just how dead offense had become:
So in 2015, the NCAA introduced a new baseball with flatter seams, similar to what they play with in the minors. Offense rebounded, and since the start of the 2020s, it has exploded.
Players are bigger, stronger, and better-trained than ever before. Hitters, long coached into contact-heavy, small-ball approaches by the most influential coaches of the 1970s, started swinging for the fences like the pros do.
The highest-scoring era of college baseball history was the late 1990s, when Division I as a whole hit .300 three years running and the average team scored seven runs a game. Babe Ruth ushered in the “live ball” era of professional baseball; legendary LSU coach Skip Bertman called his sport’s equivalent “gorilla ball.”
The NCAA has deadened the bats twice in the past 30 years, but in the past three seasons, Division I baseball has averaged 1.15, 1.15, and 1.07 home runs per team per game. All of those numbers are higher than the equivalent figures from any year of the Gorilla Ball era.
Now, treating Division I as a single class is a bit misleading. There are 30 teams in MLB, and as much as people can’t stop griping about how the Dodgers have an unfair advantage over the Pirates or whatever, those 30 teams have fairly similar resources and outlooks on the sport. Certainly when compared to college baseball.
Last season, there were 303 Division I baseball teams, spread across 29 conferences, plus Oregon State, which has been playing as an independent since the dissolution of the Pac-12. Some of those teams play in palatial 10,000-seat parks that sell out every weekend. Others have to travel across town to a park they share with a minor league team. Still others have home fields that barely qualify as a stadium; you’ll see bigger and nicer at some high schools. (Until recently, Manhattan University played at a temporary field in Van Cortlandt Park in New York.)
There are turf fields, grass fields, grass fields with turf mounds. There’s at least one power conference park that has a hill in fair territory, and at least one significant program whose outfield is known to flood and fill with dead fish when it rains too heavily. Some teams play 56 regular season games; others play 40 or fewer owing to bad weather and travel costs.
Here I have a breakdown of the overall stats for all 29 Division I conferences in 2025, plus the one-team independent group:
| League | BA | OBP | SLG | BB% | K% | R/G | HR/G | SB/G | SH/G |
|---|---|---|---|---|---|---|---|---|---|
| Big South | .292 | .397 | .463 | 11.1% | 18.5% | 7.80 | 1.15 | 1.53 | 0.38 |
| SWAC | .295 | .407 | .451 | 12.3% | 17.3% | 7.46 | 0.90 | 2.12 | 0.50 |
| Independent* | .290 | .405 | .500 | 14.0% | 20.9% | 7.40 | 1.65 | 0.58 | 0.48 |
| ACC | .288 | .395 | .477 | 12.1% | 19.2% | 7.35 | 1.37 | 1.21 | 0.39 |
| Atlantic 10 | .288 | .398 | .452 | 11.8% | 18.4% | 7.33 | 1.12 | 1.64 | 0.44 |
| SEC | .285 | .395 | .489 | 12.1% | 21.2% | 7.32 | 1.54 | 1.17 | 0.29 |
| Big 12 | .287 | .387 | .469 | 11.3% | 19.6% | 7.14 | 1.25 | 1.31 | 0.35 |
| Big Ten | .281 | .390 | .460 | 11.7% | 18.5% | 7.10 | 1.27 | 1.16 | 0.38 |
| SoCon | .289 | .395 | .461 | 11.3% | 19.0% | 7.10 | 1.12 | 1.84 | 0.62 |
| MAC | .284 | .390 | .448 | 11.2% | 18.2% | 7.04 | 1.07 | 1.17 | 0.40 |
| Big East | .280 | .391 | .439 | 12.2% | 19.2% | 7.01 | 1.06 | 1.55 | 0.41 |
| Horizon | .276 | .388 | .441 | 12.3% | 20.5% | 6.98 | 1.09 | 1.72 | 0.40 |
| WAC | .290 | .390 | .450 | 10.9% | 18.9% | 6.96 | 1.06 | 1.29 | 0.36 |
| Missouri Valley | .284 | .388 | .463 | 11.8% | 18.9% | 6.95 | 1.23 | 1.16 | 0.25 |
| MAAC | .276 | .384 | .423 | 11.7% | 17.9% | 6.70 | 0.94 | 1.70 | 0.38 |
| C-USA | .278 | .385 | .444 | 11.8% | 20.2% | 6.69 | 1.10 | 1.42 | 0.41 |
| Mountain West | .294 | .379 | .455 | 9.5% | 18.5% | 6.68 | 0.98 | 0.83 | 0.39 |
| Colonial | .278 | .376 | .434 | 10.7% | 19.4% | 6.65 | 1.00 | 1.78 | 0.39 |
| Ohio Valley | .280 | .378 | .428 | 10.8% | 18.0% | 6.65 | 0.96 | 1.25 | 0.54 |
| Southland | .282 | .385 | .426 | 11.3% | 18.5% | 6.60 | 0.91 | 1.08 | 0.47 |
| Northeast | .274 | .387 | .412 | 12.5% | 19.7% | 6.40 | 0.80 | 1.44 | 0.38 |
| American | .273 | .375 | .424 | 11.1% | 19.7% | 6.35 | 1.02 | 0.97 | 0.45 |
| Big West | .277 | .379 | .418 | 10.2% | 19.9% | 6.28 | 0.84 | 0.87 | 0.57 |
| America East | .273 | .375 | .426 | 10.5% | 19.0% | 6.26 | 0.95 | 1.13 | 0.50 |
| Patriot League | .266 | .385 | .390 | 12.4% | 19.4% | 6.18 | 0.57 | 1.35 | 0.54 |
| Sun Belt | .268 | .374 | .422 | 11.0% | 19.8% | 6.13 | 1.00 | 1.07 | 0.58 |
| Summit | .276 | .369 | .408 | 10.1% | 19.5% | 6.08 | 0.78 | 0.84 | 0.44 |
| Ivy League | .262 | .364 | .405 | 10.6% | 20.6% | 6.04 | 0.87 | 1.23 | 0.44 |
| WCC | .268 | .367 | .417 | 9.8% | 19.5% | 6.04 | 1.00 | 1.02 | 0.44 |
| Atlantic Sun | .267 | .369 | .409 | 11.1% | 20.2% | 5.83 | 0.90 | 1.25 | 0.40 |
| League | BA | OBP | SLG | BB% | K% | R/G | HR/G | SB/G | SH/G |
| American League | .244 | .313 | .406 | 8.3% | 22.5% | 4.42 | 1.21 | 0.70 | 0.10 |
| National League | .247 | .317 | .402 | 8.5% | 21.9% | 4.47 | 1.11 | 0.71 | 0.13 |
Red: Professional League
Yellow: Mid-Major Conference with Multiple NCAA Tournament Bids
*Oregon State
Regardless of location, resources, or historical influence, all 29 conferences outscored both major leagues last year by more than a run per game — three runs per game in a few cases. Every conference walks more and strikes out less than the major leagues. Every conference hits for a higher average than the AL and NL, most of them by more than 30 points.
Every conference except the Ivy League had an OBP at least 50 points higher than the AL or NL, probably because those kids think drawing a walk is beneath them. Every conference except the Patriot League outslugged the two major leagues, which is embarrassing considering how much this country spends on national defense. Every conference bunts at least twice as much as either major league, and every conference (excepting the one-team Independent class) steals more bases than the average major league team.
The offensive environment in college baseball is so wild now that we’re starting to see even elite pitching prospects get hit fairly hard. Out of the 303 Division I programs last year, only 12 had a team ERA under 4.00, and nobody had an ERA under 3.00. Coastal Carolina, a Big South team that nonetheless won 56 games and made it to the College World Series final behind an ace who’ll go high in the first round this year, could only manage a 3.20 team ERA.
Last year, there were more MLB pitchers with 50 or more innings and an ERA under 3.00 than there were college pitchers. Even accounting for the shorter collegiate season, the difference gets even more stark when you look at the percentages:
| League | ≥ 50 IP | ERA < 2.00 | Percent | FIP < 2.00 | Percent | ERA < 3.00 | Percent | FIP < 3.00 | Percent |
|---|---|---|---|---|---|---|---|---|---|
| Division I | 882 | 5 | 0.57% | 0 | 0.00% | 57 | 6.46% | 6 | 0.68% |
| MLB | 339 | 11 | 3.24% | 2 | 0.59% | 83 | 24.48% | 44 | 12.98% |
This one kind of snuck up on me, because every season you see a high-first round pick with ridiculous rate stats throw up a bunch of zeroes in Omaha. The grandaddy of this genre, at least for the 2020s, is the legendary Paul Skenes–Rhett Lowder duel in the 2023 College World Series.
That game stayed scoreless through nine innings and ended 2-0, illustrating that pitching could still dominate in the most dinger-happy era of college baseball history. Or so I thought. There have only been three individual college seasons in the 2020s where a pitcher posted an ERA under 2.00 in 100 or more innings; two of those were Skenes and Lowder in 2023.
Also, by winning that game, LSU advanced to a best-of-three championship series against Florida. Those games ended with scores of 4-3, 24-4, and 18-4. In this case, the best pitchers’ duel of the decade was the exception that proved the rule.
So keep that in mind as you’re watching college baseball this season. An OBP that would lead the league in the majors would only be average in the SEC. And don’t write off pitchers with ERAs in the 4.00s; that’s All-Conference territory these days.
Michael is a writer at FanGraphs. Previously, he was a staff writer at The Ringer and D1Baseball, and his work has appeared at Grantland, Baseball Prospectus, The Atlantic, ESPN.com, and various ill-remembered Phillies blogs. Follow him on Twitter, if you must, @MichaelBaumann.
I’ve seen the trends toward more and more offense the past several years, but I’m still surprised how few pitchers have a sub 3 ERA. Is the level of offensive talent just that much higher that even the 75th best college pitcher can’t hit that bar?
For reference, I looked up one of the low point years for my favorite college team, Oregon State. In 2013 they had three starting pitchers that hit a sub 2.5 ERA – Matthew Boyd (2.04), Andrew Moore (1.79), and Ben Holmes (2.44). Boyd obviously made it to the majors as a good SP, but none of these guys were Paul Skenes.
The concentration of talent (both offense and pitching) has become much greater in the last five years with the advent of NIL. The best pitchers and best hitters are all in the SEC and ACC, and occasionally the Big 12. A select few Big East teams (the ones on the west coast, and a random one in the Midwest) can compete, So during conference play, the best face the best and that mutes the pitching numbers.