
OOPSY 2026 Top 100 Prospects
This article unveils OOPSY’s first WAR-based Top 100 prospects list.
Broadly put, OOPSY mirrors the other projections systems at FanGraphs, but it uses its own ingredients, including its own aging curves, regression amounts, recency weights, major league equivalencies, and park factors. In terms of accuracy, it has held its own with the other projection systems, including when projecting rookies.
Since 2024, I have published OOPSY’s top prospect lists over at RotoGraphs with more of a fantasy focus, ranking pitchers by peak ERA and hitters by peak wRC+. In 2025, I began incorporating average fastball velocity into my prospect pitching projections, using data from The Board, as well as Stuff+, provided by Eno Sarris, where possible. Midway through 2025, I started accounting for EV90 in my prospect hitting projections, using data from Prospect Savant; I also include bat speed where data permits. And now that OOPSY accounts for defense as well as baserunning, I can rank prospects by projected WAR, to theoretically align more closely with the valuations used by major league organizations.
Before getting into the rankings, I want to discuss my approach to projecting defense. Previously, OOPSY borrowed its defensive projections from Steamer; now I project it myself. For major league players, the defensive runs above average projections are based on a player’s fielding run value from Statcast, aligning with how FanGraphs’ WAR accounts for defense; OOPSY also uses a positional adjustment, in keeping with FanGraphs’ approach.
The absence of publicly available Statcast fielding data for minor leaguers necessitates a different approach when it comes to prospects. I use a scouting-based approach, leveraging the listed position and Fielding grades from our prospect team’s essential work on The Board. Using scouting grades to help formulate rookie projections is an old idea in the sabermetrics community. For players not listed on The Board, I’ve assigned a primary position based on where they played the most in 2025, using data provided to me by Thomas Nestico, and formulated a naïve projection that assumes the player will be slightly below average at their primary position at the major league level. For players included on The Board, listed position and Fielding grades work well to formulate a simple defensive projection for rookies, with a 10-point increase in Fielding grade associated with a five-run increase in fielding run value above average per 4,000 outs (i.e., per full season):
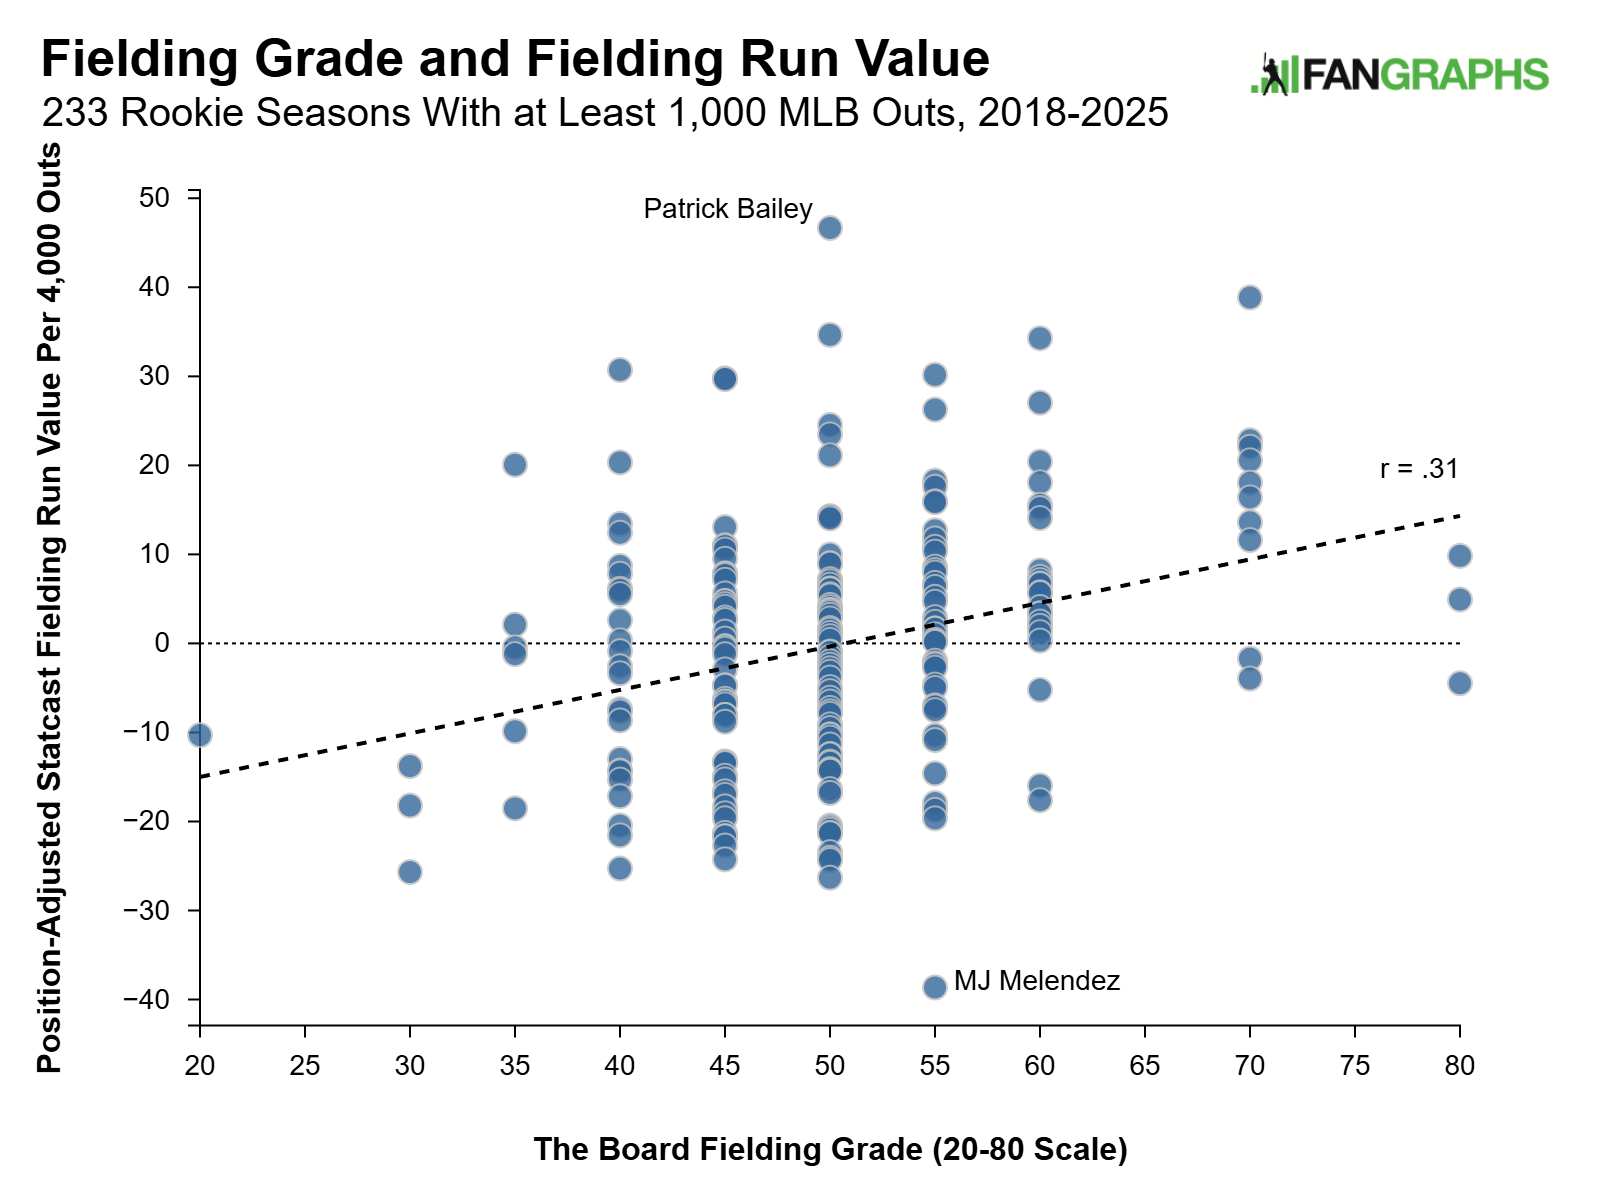
For players included on The Board, I use data from the 2026 Report where available, or else the 2025 Updated Report as a backup. For players with both minor league and major league data, I use Fielding grade in the projections until a player has eclipsed 250 big league innings. After that, I switch to the Statcast-based major league approach. This leads to a rather sharp cutoff at the 250-inning mark, which isn’t ideal, but it offers the advantage of convenience.
A few more things are worth highlighting before getting to the list. First, only domestic minor league (so no DSL) and major league performance is captured. This makes the projections particularly volatile (and thus less useful) for minor leaguers who were drafted in 2025. Because of that, anyone with fewer than 50 career professional plate appearances or total batters faced was excluded from the list. You should check out the ZiPS Top 100 for a system that captures players’ college performance.
Second, these projections are not a substitute for scouting. They cannot account for the diversity of information that a scout can bring to bear when assessing a player. Rather, a projections-based approach can serve as a useful complement by offering a systematic way to incorporate a variety of different numerical indicators at the same time: different measures of performance from different leagues, at different ages, in different seasons. Without the help of projections, it is difficult to summarize all of this information in a consistent, sensible way — or at least it is for me.
Third, prospects are ranked by projected peak single-season WAR, with a player’s peak assumed to occur around age 28, with most of the growth coming before age 25. This differs from the prospect team’s approach, which assigns a Future Value grade meant to approximate a player’s average annual WAR over their first six big league seasons. Naturally, a peak WAR approach results in higher WAR forecasts than the six-year average WAR approach. Peak WAR projections also assume a full season of playing time, which is something to keep in mind for players who may be prone to injury. All projections assume a neutral park in the 2025 major league run environment.
Here are OOPSY’s Top 100 prospects heading into 2026, ranked by peak WAR:
| # | Name | Team | Age | Level | Position | WAR | FanGraphs Rank | ZiPS Rank |
|---|---|---|---|---|---|---|---|---|
| 1 | Konnor Griffin | PIT | 20 | AA | SS | 5 | 1 | 1 |
| 2 | Samuel Basallo | BAL | 21 | MLB | C | 4.9 | 4 | 6 |
| 3 | Rainiel Rodriguez | STL | 19 | A+ | C | 4.8 | 25 | 26 |
| 4 | Kevin McGonigle | DET | 21 | AA | 3B | 4.5 | 5 | 2 |
| 5 | Trey Yesavage | TOR | 22 | MLB | RHP | 4.3 | 8 | 9 |
| 6 | Jonah Tong | NYM | 23 | MLB | RHP | 4.1 | 58 | 20 |
| 7 | Emmanuel Rodriguez | MIN | 23 | AAA | CF | 4.1 | Unranked | 34 |
| 8 | Travis Sykora | WSN | 22 | AA | RHP | 4 | 109 | 42 |
| 9 | Leo De Vries | ATH | 19 | AA | SS | 3.9 | 6 | 5 |
| 10 | Colt Emerson | SEA | 20 | AAA | SS | 3.9 | 11 | 3 |
| 11 | Sebastian Walcott | TEX | 20 | AA | SS | 3.9 | 30 | 22 |
| 12 | Josue Briceño | DET | 21 | AA | 1B | 3.9 | 63 | 31 |
| 13 | Max Clark | DET | 21 | AA | CF | 3.9 | 7 | 4 |
| 14 | Eduardo Quintero | LAD | 20 | A+ | CF | 3.8 | 43 | 41 |
| 15 | Jesús Made | MIL | 19 | AA | SS | 3.8 | 2 | 8 |
| 16 | Payton Tolle | BOS | 23 | MLB | LHP | 3.8 | 18 | 72 |
| 17 | Alfredo Duno | CIN | 20 | A | C | 3.7 | 22 | 18 |
| 18 | Connelly Early | BOS | 24 | MLB | LHP | 3.7 | 38 | 46 |
| 19 | Nolan McLean | NYM | 24 | MLB | RHP | 3.6 | 3 | 13 |
| 20 | Carter Jensen | KCR | 22 | MLB | C | 3.6 | 32 | 15 |
| 21 | Moisés Ballesteros | CHC | 22 | MLB | C | 3.6 | 84 | 35 |
| 22 | Franklin Arias | BOS | 20 | AA | SS | 3.6 | 14 | 11 |
| 23 | Jett Williams | MIL | 22 | AAA | CF | 3.5 | 75 | 29 |
| 24 | Alejandro Rosario | WSN | 23 | A+ | RHP | 3.5 | Unranked | Unranked |
| 25 | JJ Wetherholt | STL | 23 | AAA | 2B | 3.5 | 12 | 14 |
| 26 | Sal Stewart | CIN | 22 | MLB | 3B | 3.5 | 34 | 7 |
| 27 | Cooper Pratt | MIL | 21 | AA | SS | 3.4 | Unranked | 39 |
| 28 | Nelson Rada | LAA | 20 | AAA | CF | 3.4 | Unranked | Unranked |
| 29 | Carson Benge | NYM | 23 | AAA | CF | 3.4 | 21 | 61 |
| 30 | Luis Peña | MIL | 19 | A+ | SS | 3.4 | 24 | 51 |
| 31 | Aron Estrada | BAL | 21 | AA | 2B | 3.3 | Unranked | Unranked |
| 32 | Michael Arroyo | SEA | 21 | AA | 2B | 3.3 | 78 | 12 |
| 33 | Aidan Miller | PHI | 22 | AAA | SS | 3.3 | 13 | 36 |
| 34 | Jarlin Susana | WSN | 22 | AA | RHP | 3.3 | 29 | 69 |
| 35 | Luis Lara | MIL | 21 | AA | CF | 3.3 | Unranked | Unranked |
| 36 | A.J. Ewing | NYM | 21 | AA | CF | 3.3 | Unranked | Unranked |
| 37 | Justin Crawford | PHI | 22 | AAA | CF | 3.3 | Unranked | Unranked |
| 38 | Thomas White | MIA | 21 | AAA | LHP | 3.3 | 9 | 27 |
| 39 | Robby Snelling | MIA | 22 | AAA | LHP | 3.2 | 80 | 25 |
| 40 | Bubba Chandler | PIT | 23 | MLB | RHP | 3.2 | 10 | 16 |
| 41 | Ricky Tiedemann | TOR | 22 | AAA | LHP | 3.1 | Unranked | Unranked |
| 42 | Ryan Clifford | NYM | 22 | AAA | RF | 3.1 | Unranked | 52 |
| 43 | Dauri Fernandez | CLE | 19 | A | SS | 3.1 | Unranked | Unranked |
| 44 | Caleb Bonemer | CHW | 20 | A+ | 3B | 3 | 33 | Unranked |
| 45 | Harry Ford | WSN | 23 | MLB | C | 3 | 74 | 50 |
| 46 | Walker Jenkins | MIN | 21 | AAA | CF | 3 | 31 | Unranked |
| 47 | Kaelen Culpepper | MIN | 23 | AA | SS | 3 | 97 | 67 |
| 48 | Nate George | BAL | 20 | A+ | CF | 3 | Unranked | Unranked |
| 49 | Sam Antonacci | CHW | 23 | AA | 2B | 3 | Unranked | Unranked |
| 50 | Owen Caissie | MIA | 23 | MLB | RF | 3 | 62 | 49 |
| 51 | Carson Williams | TBR | 23 | MLB | SS | 2.9 | 28 | 10 |
| 52 | Eduardo Tait | MIN | 19 | A+ | C | 2.9 | 46 | 30 |
| 53 | Yeremy Cabrera | WSN | 20 | A | CF | 2.9 | Unranked | 54 |
| 54 | Kendall George | LAD | 21 | A+ | CF | 2.9 | Unranked | Unranked |
| 55 | Edwin Arroyo | CIN | 22 | AA | SS | 2.9 | Unranked | Unranked |
| 56 | Adrian Santana | TBR | 20 | A+ | SS | 2.9 | Unranked | Unranked |
| 57 | Roldy Brito | COL | 19 | A | CF | 2.9 | 99 | Unranked |
| 58 | Lazaro Montes | SEA | 21 | AA | RF | 2.9 | 66 | 60 |
| 59 | Eli Willits | WSN | 18 | A | SS | 2.9 | 15 | Unranked |
| 60 | Yordanny Monegro | BOS | 23 | AA | RHP | 2.8 | Unranked | Unranked |
| 61 | John Gil | ATL | 20 | AA | SS | 2.8 | Unranked | Unranked |
| 62 | Dax Kilby | NYY | 19 | A | SS | 2.8 | 69 | Unranked |
| 63 | Starlyn Caba | MIA | 20 | A | SS | 2.8 | Unranked | Unranked |
| 64 | Demetrio Crisantes | ARI | 21 | A+ | 2B | 2.8 | Unranked | Unranked |
| 65 | Gabriel Gonzalez | MIN | 22 | AAA | RF | 2.8 | Unranked | Unranked |
| 66 | Bryce Rainer | DET | 20 | A | SS | 2.8 | 23 | Unranked |
| 67 | Ty Johnson | TBR | 24 | AA | RHP | 2.8 | Unranked | Unranked |
| 68 | William Bergolla Jr. | CHW | 21 | AA | SS | 2.7 | Unranked | Unranked |
| 69 | George Lombard Jr. | NYY | 21 | AA | SS | 2.7 | 49 | 21 |
| 70 | Ethan Salas | SDP | 20 | AA | C | 2.7 | 110 | Unranked |
| 71 | Logan Henderson | MIL | 24 | MLB | RHP | 2.7 | 88 | Unranked |
| 72 | Juneiker Caceres | CLE | 18 | A | RF | 2.7 | Unranked | Unranked |
| 73 | Luis Perales | WSN | 23 | AAA | RHP | 2.7 | Unranked | Unranked |
| 74 | Samuel Zavala | CHW | 21 | A+ | CF | 2.7 | Unranked | Unranked |
| 75 | Mitch Bratt | ARI | 22 | AA | LHP | 2.7 | Unranked | 56 |
| 76 | Chris Suero | NYM | 22 | AA | C | 2.7 | Unranked | Unranked |
| 77 | Trey Gibson | BAL | 24 | AAA | RHP | 2.6 | 83 | Unranked |
| 78 | Dylan Beavers | BAL | 24 | MLB | LF | 2.6 | 39 | Unranked |
| 79 | Ty Southisene | CHC | 20 | A | SS | 2.6 | Unranked | Unranked |
| 80 | Ben Hess | NYY | 23 | AA | RHP | 2.6 | Unranked | Unranked |
| 81 | Coleman Crow | MIL | 25 | AAA | RHP | 2.6 | Unranked | Unranked |
| 82 | Jefferson Rojas | CHC | 21 | AA | SS | 2.6 | 55 | Unranked |
| 83 | Hao-Yu Lee | DET | 23 | AAA | 2B | 2.6 | Unranked | Unranked |
| 84 | Arjun Nimmala | TOR | 20 | A+ | SS | 2.6 | 48 | 37 |
| 85 | Johnny King | TOR | 19 | A | LHP | 2.6 | Unranked | Unranked |
| 86 | Carlos Lagrange | NYY | 23 | AA | RHP | 2.6 | 73 | Unranked |
| 87 | Jacob Reimer | NYM | 22 | AA | 3B | 2.6 | 85 | 28 |
| 88 | Angel Genao | CLE | 22 | AA | SS | 2.6 | 42 | Unranked |
| 89 | Jeferson Quero | MIL | 23 | AAA | C | 2.6 | 76 | 89 |
| 90 | Brandon Sproat | MIL | 25 | MLB | RHP | 2.5 | 37 | 81 |
| 91 | Brice Matthews | HOU | 24 | MLB | 2B | 2.5 | Unranked | 58 |
| 92 | Didier Fuentes | ATL | 21 | MLB | RHP | 2.5 | 90 | 47 |
| 93 | Robert Gasser | MIL | 27 | MLB | LHP | 2.5 | Unranked | Unranked |
| 94 | Ryan Waldschmidt | ARI | 23 | AA | LF | 2.5 | 35 | Unranked |
| 95 | Pedro Ramirez | CHC | 22 | AA | 3B | 2.5 | Unranked | Unranked |
| 96 | Devin Fitz-Gerald | WSN | 20 | A | 3B | 2.5 | Unranked | Unranked |
| 97 | Joe Mack | MIA | 23 | AAA | C | 2.5 | 56 | Unranked |
| 98 | Alex Freeland | LAD | 24 | MLB | SS | 2.5 | Unranked | 43 |
| 99 | Kane Kepley | CHC | 22 | A | CF | 2.5 | Unranked | Unranked |
| 100 | Tre’ Morgan | TBR | 23 | AAA | 1B | 2.5 | Unranked | Unranked |
| 101 | George Klassen | LAA | 24 | AAA | RHP | 2.5 | 57 | Unranked |
| 102 | Asbel Gonzalez | KCR | 20 | AA | CF | 2.5 | Unranked | Unranked |
| 103 | Josue De Paula | LAD | 21 | AA | RF | 2.5 | 17 | 80 |
| 104 | Henry Bolte | ATH | 22 | AAA | RF | 2.4 | Unranked | Unranked |
| 105 | Wyatt Sanford | PIT | 20 | A | SS | 2.4 | Unranked | Unranked |
| 106 | Kevin Alcántara | CHC | 23 | MLB | CF | 2.4 | 60 | Unranked |
| 107 | Gage Jump | ATH | 23 | AA | LHP | 2.4 | 81 | 64 |
| 108 | Hayden Alvarez | LAA | 19 | A | CF | 2.4 | Unranked | Unranked |
| 109 | Wilder Dalis | COL | 19 | A | 3B | 2.4 | Unranked | Unranked |
Level shows a player’s highest level reached in 2025.
Konnor Griffin, Samuel Basallo, and Kevin McGonigle comprise three of the top four, while 19 of the top 20 prospects also made the FanGraphs Top 100, a good source of triangulation for OOPSY’s approach. Overall, about 60% of my Top 100 ranked on the FanGraphs Top 100, matching the share of agreement between the ZiPS Top 100 and the FanGraphs Top 100. Unsurprisingly, the three lists have greater agreement on the names near the top: Twenty-three of my top 25 made the FanGraphs list, and 37 of my top 50, but only 26 of my bottom 59 made it. Similarly, 24 of my top 25 made the ZiPS list, and 38 of my top 50, but only 15 of my bottom 59.
A few other names in the OOPSY top 30 received a 45-FV grade from our prospect team this list cycle, including Cooper Pratt and Nelson Rada. Alejandro Rosario was a 45+-FV prospect last year, while Emmanuel Rodriguez fell out of this year’s Top 100, mostly due to contact-related concerns. We’ll see where they rank this year when the Nationals and Twins lists come out. The two most notable prospects who failed to make OOPSY’s list are Bryce Eldridge and Ryan Sloan. Eldridge projects well offensively, with a 115 peak wRC+, but his first base defensive home limits his WAR forecast. Meanwhile, the bar for A-ball performance is quite high given it is penalized harshly by my major league equivalencies, bumping Sloan outside the Top 100; he could rise quickly if he continues to dominate at more advanced levels this year.
There are a few players who narrowly graduated from prospect eligibility last year who would have done quite well on these rankings had they still been eligible. Chase Burns would have edged out Griffin for the top spot on this list. Stuff+ darling Grant Taylor would have been the fourth-best prospect arm, slotting in just behind Max Clark, with OOPSY expecting an eventual successful transition to starting full-time; his target for 2026 is roughly 100 innings, but he could enter the rotation in 2027. Marcelo Mayer would have slotted in next to Bubba Chandler on the Top 100, with OOPSY viewing him as an above-average infielder at peak. Finally, Jordan Lawlar would have ranked just ahead of Caleb Bonemer. At peak, OOPSY views him as a below-average, but still passable, shortstop, with a slightly above-average wRC+ and lots of stolen bases. He should get a chance to play all over the diamond for the Diamondbacks this year.
The incorporation of defense led to a lot of movement among the prospect hitters compared to OOPSY’s September 2025 fantasy-focused prospect ranking, bringing this list closer to scouting wisdom:
| # | Name | Team | Age | Pos | BB% | K% | HR | SB | wRC+ | Def | WAR | Rel |
|---|---|---|---|---|---|---|---|---|---|---|---|---|
| 1 | Konnor Griffin | PIT | 20 | SS | 7% | 22% | 23 | 38 | 128 | 4.0 | 5.0 | 57% |
| 2 | Samuel Basallo | BAL | 21 | C | 10% | 20% | 29 | 2 | 141 | 0.0 | 4.9 | 80% |
| 3 | Rainiel Rodriguez | STL | 19 | C | 10% | 20% | 31 | 3 | 136 | 3.1 | 4.8 | 46% |
| 4 | Kevin McGonigle | DET | 21 | 3B | 12% | 13% | 24 | 13 | 134 | 0.0 | 4.5 | 68% |
| 5 | Emmanuel Rodriguez | MIN | 23 | CF | 17% | 30% | 20 | 14 | 124 | 3.2 | 4.1 | 68% |
| 6 | Leo De Vries | ATH | 19 | SS | 11% | 20% | 24 | 7 | 127 | 0.8 | 3.9 | 67% |
| 7 | Colt Emerson | SEA | 20 | SS | 11% | 18% | 17 | 10 | 122 | 2.4 | 3.9 | 71% |
| 8 | Sebastian Walcott | TEX | 20 | SS | 10% | 21% | 19 | 23 | 118 | 4.0 | 3.9 | 74% |
| 9 | Max Clark | DET | 21 | CF | 13% | 19% | 19 | 11 | 124 | 0.0 | 3.9 | 72% |
| 10 | Josue Briceño | DET | 21 | 1B | 11% | 20% | 25 | 1 | 127 | -0.1 | 3.9 | 68% |
| 11 | Eduardo Quintero | LAD | 20 | CF | 12% | 24% | 19 | 30 | 116 | 3.2 | 3.8 | 66% |
| 12 | Jesús Made | MIL | 19 | SS | 10% | 21% | 17 | 29 | 112 | 5.6 | 3.8 | 55% |
| 13 | Alfredo Duno | CIN | 20 | C | 13% | 22% | 21 | 2 | 121 | 3.1 | 3.7 | 58% |
| 14 | Carter Jensen | KCR | 22 | C | 12% | 24% | 22 | 5 | 121 | 1.0 | 3.6 | 82% |
| 15 | Moisés Ballesteros | CHC | 22 | C | 9% | 15% | 21 | 1 | 125 | -1.1 | 3.6 | 82% |
| 16 | Franklin Arias | BOS | 20 | SS | 8% | 14% | 19 | 8 | 117 | 4.0 | 3.6 | 71% |
| 17 | Jett Williams | MIL | 22 | CF | 12% | 23% | 18 | 27 | 117 | 0.0 | 3.5 | 73% |
| 18 | JJ Wetherholt | STL | 23 | 2B | 11% | 17% | 18 | 14 | 118 | 0.0 | 3.5 | 61% |
| 19 | Sal Stewart | CIN | 22 | 3B | 10% | 17% | 22 | 9 | 124 | -3.2 | 3.5 | 78% |
| 20 | Cooper Pratt | MIL | 21 | SS | 10% | 17% | 16 | 21 | 109 | 4.0 | 3.4 | 71% |
| 21 | Nelson Rada | LAA | 20 | CF | 12% | 19% | 10 | 38 | 109 | 3.2 | 3.4 | 79% |
| 22 | Carson Benge | NYM | 23 | CF | 10% | 20% | 19 | 11 | 117 | 0.0 | 3.4 | 58% |
| 23 | Luis Peña | MIL | 19 | SS | 7% | 18% | 21 | 36 | 113 | -0.8 | 3.4 | 53% |
| 24 | Aron Estrada | BAL | 21 | 2B | 8% | 17% | 18 | 26 | 115 | -0.8 | 3.3 | 72% |
| 25 | Aidan Miller | PHI | 22 | SS | 12% | 23% | 16 | 40 | 113 | -0.8 | 3.3 | 70% |
| 26 | Michael Arroyo | SEA | 21 | 2B | 10% | 21% | 20 | 7 | 124 | -3.2 | 3.3 | 76% |
| 27 | Luis Lara | MIL | 21 | CF | 10% | 16% | 11 | 30 | 108 | 3.2 | 3.3 | 79% |
| 28 | A.J. Ewing | NYM | 21 | CF | 11% | 22% | 14 | 32 | 109 | 3.2 | 3.3 | 68% |
| 29 | Justin Crawford | PHI | 22 | CF | 8% | 18% | 12 | 37 | 111 | 0.0 | 3.3 | 79% |
| 30 | Ryan Clifford | NYM | 22 | RF | 13% | 26% | 27 | 2 | 126 | -7.1 | 3.1 | 77% |
| 31 | Dauri Fernandez | CLE | 19 | SS | 7% | 18% | 20 | 27 | 107 | 2.4 | 3.1 | 36% |
| 32 | Caleb Bonemer | CHW | 20 | 3B | 11% | 23% | 20 | 14 | 115 | -1.6 | 3.0 | 51% |
| 33 | Harry Ford | WSN | 23 | C | 13% | 21% | 16 | 13 | 111 | 2.0 | 3.0 | 82% |
| 34 | Walker Jenkins | MIN | 21 | CF | 11% | 18% | 18 | 15 | 120 | -5.5 | 3.0 | 68% |
| 35 | Kaelen Culpepper | MIN | 23 | SS | 8% | 21% | 21 | 14 | 104 | 5.6 | 3.0 | 62% |
| 36 | Nate George | BAL | 20 | CF | 8% | 20% | 17 | 46 | 112 | -1.6 | 3.0 | 49% |
| 37 | Sam Antonacci | CHW | 23 | 2B | 10% | 17% | 12 | 27 | 113 | -3.2 | 3.0 | 59% |
| 38 | Owen Caissie | MIA | 23 | RF | 11% | 28% | 22 | 4 | 121 | -3.9 | 3.0 | 82% |
| 39 | Carson Williams | TBR | 23 | SS | 10% | 31% | 24 | 22 | 107 | 3.3 | 2.9 | 81% |
| 40 | Yeremy Cabrera | WSN | 20 | CF | 9% | 22% | 19 | 25 | 105 | 1.6 | 2.9 | 63% |
| 41 | Kendall George | LAD | 21 | CF | 12% | 19% | 10 | 63 | 101 | 1.6 | 2.9 | 71% |
| 42 | Eduardo Tait | MIN | 19 | C | 6% | 21% | 24 | 1 | 111 | 1.0 | 2.9 | 67% |
| 43 | Edwin Arroyo | CIN | 22 | SS | 7% | 20% | 15 | 9 | 104 | 5.6 | 2.9 | 81% |
| 44 | Adrian Santana | TBR | 20 | SS | 7% | 14% | 13 | 42 | 97 | 4.0 | 2.9 | 71% |
| 45 | Roldy Brito | COL | 19 | CF | 8% | 22% | 16 | 29 | 107 | 1.3 | 2.9 | 47% |
| 46 | Lazaro Montes | SEA | 21 | RF | 12% | 27% | 28 | 1 | 124 | -7.1 | 2.9 | 75% |
| 47 | Eli Willits | WSN | 18 | SS | 9% | 21% | 18 | 5 | 103 | 5.6 | 2.9 | 12% |
| 48 | John Gil | ATL | 20 | SS | 9% | 18% | 15 | 38 | 99 | 4.0 | 2.8 | 68% |
| 49 | Dax Kilby | NYY | 19 | SS | 10% | 19% | 16 | 38 | 107 | -2.3 | 2.8 | 17% |
| 50 | Starlyn Caba | MIA | 20 | SS | 12% | 18% | 13 | 29 | 90 | 11.9 | 2.8 | 58% |
| 51 | Bryce Rainer | DET | 20 | SS | 9% | 24% | 19 | 15 | 103 | 4.0 | 2.8 | 25% |
| 52 | Demetrio Crisantes | ARI | 21 | 2B | 9% | 18% | 15 | 16 | 106 | 1.6 | 2.8 | 64% |
| 53 | Gabriel Gonzalez | MIN | 22 | RF | 7% | 17% | 18 | 3 | 112 | -0.7 | 2.8 | 82% |
| 54 | William Bergolla Jr. | CHW | 21 | SS | 7% | 8% | 11 | 24 | 106 | 2.4 | 2.7 | 77% |
| 55 | George Lombard Jr. | NYY | 21 | SS | 12% | 24% | 13 | 25 | 103 | 2.4 | 2.7 | 71% |
| 56 | Ethan Salas | SDP | 20 | C | 10% | 20% | 17 | 8 | 102 | 5.2 | 2.7 | 66% |
| 57 | Juneiker Caceres | CLE | 18 | RF | 9% | 16% | 19 | 5 | 117 | -3.9 | 2.7 | 43% |
| 58 | Samuel Zavala | CHW | 21 | CF | 13% | 22% | 18 | 7 | 109 | 1.6 | 2.7 | 77% |
| 59 | Chris Suero | NYM | 22 | C | 11% | 27% | 19 | 20 | 105 | 2.0 | 2.7 | 67% |
| 60 | Ty Southisene | CHC | 20 | SS | 11% | 18% | 13 | 27 | 100 | 2.4 | 2.6 | 48% |
| 61 | Dylan Beavers | BAL | 24 | LF | 13% | 22% | 17 | 20 | 114 | -5.8 | 2.6 | 80% |
| 62 | Jefferson Rojas | CHC | 21 | SS | 9% | 18% | 18 | 14 | 105 | 0.8 | 2.6 | 75% |
| 63 | Arjun Nimmala | TOR | 20 | SS | 9% | 24% | 20 | 12 | 102 | 2.4 | 2.6 | 68% |
| 64 | Hao-Yu Lee | DET | 23 | 2B | 9% | 20% | 17 | 16 | 110 | -3.2 | 2.6 | 80% |
| 65 | Angel Genao | CLE | 22 | SS | 8% | 18% | 14 | 6 | 104 | 2.4 | 2.6 | 79% |
| 66 | Jacob Reimer | NYM | 22 | 3B | 10% | 22% | 19 | 4 | 114 | -3.2 | 2.6 | 71% |
| 67 | Jeferson Quero | MIL | 23 | C | 8% | 17% | 20 | 2 | 106 | 1.0 | 2.6 | 75% |
| 68 | Brice Matthews | HOU | 24 | 2B | 11% | 30% | 21 | 36 | 101 | 0.4 | 2.5 | 67% |
| 69 | Ryan Waldschmidt | ARI | 23 | LF | 12% | 21% | 15 | 18 | 109 | -2.3 | 2.5 | 60% |
| 70 | Joe Mack | MIA | 23 | C | 9% | 26% | 22 | 4 | 100 | 5.2 | 2.5 | 80% |
| 71 | Alex Freeland | LAD | 24 | SS | 12% | 25% | 17 | 18 | 100 | 2.7 | 2.5 | 79% |
| 72 | Pedro Ramirez | CHC | 22 | 3B | 7% | 18% | 14 | 14 | 104 | 1.6 | 2.5 | 82% |
| 73 | Devin Fitz-Gerald | WSN | 20 | 3B | 10% | 20% | 19 | 7 | 104 | 1.6 | 2.5 | 29% |
| 74 | Kane Kepley | CHC | 22 | CF | 11% | 20% | 15 | 24 | 103 | 0.0 | 2.5 | 23% |
| 75 | Tre’ Morgan | TBR | 23 | 1B | 11% | 17% | 14 | 8 | 109 | -1.5 | 2.5 | 69% |
| 76 | Asbel Gonzalez | KCR | 20 | CF | 8% | 20% | 12 | 53 | 94 | 3.2 | 2.5 | 62% |
| 77 | Josue De Paula | LAD | 21 | RF | 14% | 22% | 17 | 22 | 112 | -7.1 | 2.5 | 74% |
| 78 | Wyatt Sanford | PIT | 20 | SS | 9% | 23% | 15 | 36 | 92 | 5.6 | 2.4 | 38% |
| 79 | Henry Bolte | ATH | 22 | RF | 10% | 31% | 17 | 32 | 105 | -3.9 | 2.4 | 75% |
| 80 | Kevin Alcántara | CHC | 23 | CF | 9% | 27% | 20 | 10 | 105 | 0.0 | 2.4 | 82% |
| 81 | Hayden Alvarez | LAA | 19 | CF | 10% | 20% | 15 | 31 | 101 | 0.0 | 2.4 | 42% |
| 82 | Wilder Dalis | COL | 19 | 3B | 9% | 22% | 17 | 11 | 101 | 2.4 | 2.4 | 46% |
Projections assume a neutral park in the 2025 MLB run environment.
Rel = reliability, the proportion of a player’s projection that is comprised of performance rather than regression.
Def = defensive runs above average, fielding runs plus positional adjustment.
Lazaro Montes and Ryan Clifford continue to project well offensively, but weak defense projections knock them out of the top 25 here. Luke Adams’ 40-grade projected defensive ability at first base drops him off the list entirely, though he still rates well offensively, with a 123 peak wRC+ projection. On the flip side, Jesús Made slots in as 12th-best hitter now, whereas he failed to crack the top 30 in the September update. As a forecaster, this is the sort of change I like to see, bringing OOPSY more in line with industry wisdom. Starlyn Caba and Tre’ Morgan also join the list after receiving 80 FV Fielding grades at shortstop and first base, respectively, last list cycle. Druw Jones is the only other prospect on The Board with an 80 FV Fielding grade, but his offensive projection (80 peak wRC+) is weak enough to keep him off the list. He looks like a surefire major leaguer, however.
The biggest surprises among the hitting prospects are Aron Estrada and Wilder Dalis, two players who did not make the 2025 in-season update of The Board. Our lead prospect analyst, Eric Longenhagen, covered Estrada last April, highlighting his defensive issues, while anticipating that a projections-based approach would probably like him, saying, “This is a prospect where my visual eval is a good bit lower than whatever a model would likely spit out given Estrada’s TrackMan data.” Dalis is a teenage Rockies prospect who has performed well in a limited sample. Eric discussed him in January 2025, citing his strong hard-hit data. I look forward to seeing how both of those guys stack up on their respective lists later this cycle.
On the pitching side, there aren’t any major surprises in the top 10, with OOPSY endorsing prospect arms also beloved by scouts, although a few have significant health concerns, including Rosario, who is recovering from Tommy John surgery, and Jarlin Susana, who is recovering from surgery on his right lat. Our prospect team believed enough in the stuff to rank Susana 29th on Monday’s Top 100, injuries be damned. Here is how the pitchers shake out:
| # | Name | Team | Age | Pos | K% | BB% | HR/9 | FIP | ERA | WAR | Rel |
|---|---|---|---|---|---|---|---|---|---|---|---|
| 1 | Trey Yesavage | TOR | 22 | RHP | 29% | 9% | 1.00 | 3.46 | 3.31 | 4.3 | 60% |
| 2 | Jonah Tong | NYM | 23 | RHP | 28% | 10% | 0.90 | 3.46 | 3.42 | 4.1 | 73% |
| 3 | Travis Sykora | WSN | 22 | RHP | 28% | 9% | 0.95 | 3.46 | 3.47 | 4.0 | 54% |
| 4 | Payton Tolle | BOS | 23 | LHP | 27% | 7% | 1.18 | 3.68 | 3.57 | 3.8 | 59% |
| 5 | Connelly Early | BOS | 24 | LHP | 25% | 8% | 0.94 | 3.59 | 3.60 | 3.7 | 71% |
| 6 | Nolan McLean | NYM | 24 | RHP | 23% | 8% | 0.85 | 3.63 | 3.62 | 3.6 | 75% |
| 7 | Alejandro Rosario | WSN | 23 | RHP | 24% | 7% | 0.99 | 3.60 | 3.67 | 3.5 | 54% |
| 8 | Jarlin Susana | WSN | 22 | RHP | 25% | 11% | 0.88 | 3.78 | 3.76 | 3.3 | 66% |
| 9 | Thomas White | MIA | 21 | LHP | 26% | 9% | 1.07 | 3.80 | 3.76 | 3.3 | 67% |
| 10 | Robby Snelling | MIA | 22 | LHP | 22% | 6% | 1.05 | 3.74 | 3.79 | 3.2 | 76% |
| 11 | Bubba Chandler | PIT | 23 | RHP | 23% | 8% | 1.09 | 3.88 | 3.82 | 3.2 | 77% |
| 12 | Ricky Tiedemann | TOR | 22 | LHP | 26% | 10% | 1.02 | 3.83 | 3.86 | 3.1 | 49% |
| 13 | Yordanny Monegro | BOS | 23 | RHP | 23% | 8% | 1.01 | 3.88 | 3.96 | 2.8 | 57% |
| 14 | Ty Johnson | TBR | 24 | RHP | 25% | 8% | 1.16 | 3.96 | 4.01 | 2.8 | 67% |
| 15 | Logan Henderson | MIL | 24 | RHP | 24% | 7% | 1.26 | 3.99 | 4.02 | 2.7 | 70% |
| 16 | Luis Perales | WSN | 23 | RHP | 23% | 10% | 1.15 | 4.19 | 4.04 | 2.7 | 43% |
| 17 | Mitch Bratt | ARI | 22 | LHP | 21% | 5% | 1.32 | 4.03 | 4.05 | 2.7 | 74% |
| 18 | Trey Gibson | BAL | 24 | RHP | 22% | 9% | 1.02 | 3.96 | 4.06 | 2.6 | 71% |
| 19 | Ben Hess | NYY | 23 | RHP | 24% | 10% | 1.06 | 4.05 | 4.07 | 2.6 | 58% |
| 20 | Coleman Crow | MIL | 25 | RHP | 22% | 7% | 1.07 | 3.89 | 4.07 | 2.6 | 43% |
| 21 | Johnny King | TOR | 19 | LHP | 25% | 10% | 1.11 | 4.07 | 4.09 | 2.6 | 47% |
| 22 | Carlos Lagrange | NYY | 23 | RHP | 24% | 11% | 1.08 | 4.20 | 4.09 | 2.6 | 68% |
| 23 | Brandon Sproat | MIL | 25 | RHP | 20% | 8% | 0.96 | 4.06 | 4.10 | 2.5 | 74% |
| 24 | Didier Fuentes | ATL | 21 | RHP | 22% | 7% | 1.35 | 4.22 | 4.12 | 2.5 | 63% |
| 25 | Robert Gasser | MIL | 27 | LHP | 21% | 7% | 1.25 | 4.11 | 4.12 | 2.5 | 62% |
| 26 | George Klassen | LAA | 24 | RHP | 22% | 10% | 1.13 | 4.22 | 4.14 | 2.5 | 70% |
| 27 | Gage Jump | ATH | 23 | LHP | 21% | 7% | 1.16 | 4.09 | 4.15 | 2.4 | 61% |
Projections assume a neutral park in the 2025 MLB run environment.
Rel = reliability, the proportion of a player’s projection that is comprised of performance rather than regression.
There are a few surprises outside the top 10, namely Ben Hess, Ty Johnson, Yordanny Monegro, and Coleman Crow. Our prospect team views Monegro as having relief risk, an outcome that became more likely after he underwent Tommy John surgery last June. Per The Board, Johnson touches 97 mph, but a weak changeup as his third pitch gives him heightened relief risk if he is unable to improve it. Hess possesses a four-pitch mix and can get the fastball up to 98. Per this year’s Brewers list, Crow’s lengthy injury history and corresponding lack of innings point to a bullpen future, though our prospect team notes that he has a chance to be a very good reliever if his velo ticks up.
You can find peak projections for all major league and minor league players here, as well as daily updates to the projections in-season. We are also working on displaying preseason peak WAR forecasts for all players for FanGraphs Members in the coming weeks, an OOPSY counterpart to the ZiPS three-year forecasts.
Interesting that for the Guardians, there’s absolutely no crossover with OOPSY and ZiPS.
DeLauter almost made it, he projects well offensively (113 peak wRC+), but a lackluster defense projection kept him from making it. I’d lean ZiPS over OOPSY on Bazzana as ZiPS might still be giving his college performance some weight, and anyway the ZiPS projection is more in line with his prospect pedigree
Same with the White Sox. The kicker is Braden Montgomery who made the FG top 100, but not ZIPS or OOPSY.
I would imagine the presence of Statcast data in only a couple of minor leagues will produce much sharper projections for only certain players. I assume projection systems weight AAA performance heavier anyway, but it seems like not accounting for things like bat speed or stuff would really limit utility in the low minors (FSL notwithstanding).
As an aside, do you include data from the Arizona Fall League?
I don’t, aside from ev90/bat speed data for guys who don’t otherwise have it. More statcast data always helps!
Thanks! I always appreciate insight into writer processes.
No Kade Anderson? Interesting…
anyone with fewer than 50 career professional plate appearances or total batters faced was excluded from the list, so anyone drafted in 2025 was excluded except for a handful!
Thanks for clarifying what I admittedly skipped over in first read 😬. That makes sense. I concede that I was a bit quick on the comment trigger, and it was too late to remove at that point. But hopefully I provided a service for the rest of us dummies… 👍
all good lol, thanks!
Jett Williams should be with MIL not NYM. Thanks for the list and explanation of your methods, super fun and interesting!
Appreciate the kind words (and you catching that mistake)…fixed now!
Good thing Wilder Dalis is not a pitcher, that name might’ve been too much to overcome.
I’m confident you won’t see a wilder rank on him this offseason!
Bob Walk did okay. Dave Beanball was another story.
I forget how OOPSY works, but when I see Sam Antonacci and William Begolla on a list like this I think that either:
1) It is missing a ceiling effect for contact ability, or
2) It is missing an interaction between contact ability and power
It is super neat to see that a model likes them and maybe they beat the odds but making it as an Arraez or Kwan type hitter is vitrtually impossible. They might have a year like 2022 Benintendi or 2021 Adam Frazier but what they have done since then seems a lot more likely.
Of course Carson Williams and Emmanuel Rodriguez are pretty high too so maybe this is an issue with the model selecting someone based on one carrying tool at the plate and an up-the-middle defensive home.
All the projections like these guys/agree on these guys more or less, e.g. ZiPS also has antonacci at 100 wrc+ this year, Steamer not far behind, and both steamer and zips have bergolla with one of the lowest k% projections in the whole MLB at 21 y.o, though not much else, and close to oopsy redraft wrc+….and zips also likes emm rod and Carson and clifford of course. The “missing” ingredient you’re describing may be something that is better accounted for/more easily accounted for in qualitative evaluation than in a projection system
One thing I have learned from this and ZiPS models are that Ryan Clifford looks great if you just use stats rather than scouting as your main source. Like in the mold of someone like Michael Busch, Ben Rice, or Triston Casas (at least before 2025 in his case). Although he might be able to fake right field.
Longenhagen def seems like the low man on him compared to other publications but I get why, feels like huge bust potential
In fairness, Clifford’s write up describes a 115-120 wRC+ platoon 1B….which describes Busch’s 2024 and Rice’s career line.
The 45 just reflects the precariousness of the positional value, IMO.
NELSON RADA SIGHTING
Jordan, I think you’ve somehow reverse engineered Paul Toboni and the Nats’ player assessment method.
MacKenzie Gore was traded for a package that was thought to be centered on Gavin Fien (not ranked here). And yet among the other 4 pieces, who were assessed to be somewhat middling prospects, 3 of them feature prominently on this list: Rosario #24, Cabrera #53, and Fitz-Gerald #96. I was somehow expecting to see Abimelec Ortiz listed in an honorable mention section or something.
But it goes further than this. Luis Perales, acquired for another middling prospect in Jake Bennett, features at #73, and Harry Ford, acquired for a young reliever, features at #45.
Toboni seems to have identified something the same thing that OOPSY has about under-valued prospects.
Lol my bad for publishing the top secret strategy, paul!
Sure, “Jordan.” Or should we call you… PAUL????!!!
Yet no Willits at 15?
I had the same thought. This is giving me some hope for the Nats rebuild, because I’ve been bearish on our drafting and development for years.
I did not expect to see Rainiel at #3 with such a great projection. OOPSY has him as by far and away the best power hitter it looks like with 31 HRs.
Wow, not one Giant! OOPSY not an Eldridge fan?
OOPSY likes his bat, but the defense hurts him from a WAR perspective. Jhonny Level only just missed, and Josuar was not eligible (I don’t capture DSL!)
Is OOPSY using FG positional adjustments? I thought there might be some rumblings that the 1B/DH penalty is thought to be overly harsh and might be revised, especially with 1B hitting worse over the last few years (tOPS+ of only 107-111 last three years, it was regularly more like 115-120 10 years ago). Do you think that would have a big impact on his projection? Or is it that his defense itself projects to suck (seems like he’s a future 45 per the T100)?
It uses the fg positional adjustment and that’s mostly what hurts him, as opposed to him projecting poorly defensively at 1B. So yeah, idk if it’s in the cards, but revising it would give him a good bump
Ben Clemens has promised a much needed new approach to the positional adjustments at DH and 1st base. As it stands now I will continue to scream until a pitcher is penalized for not hitting, all the while penalizing a DH for not fielding. In regards to 1st base, it was very enlightening to see Sean Casey, a 3-time All Star with 12 years experience as a major league 1st baseman, say, during the Top 10 show on MLB-TV, that the primary responsibility of the 1st baseman was scooping bad throws and produced statistics that showed Pete Alonso as, far and away, the best scooper in the game. I am eager to see what Ben comes up with.
Especially when it’s been empirically established that a DH is *already* penalized for not fielding in terms of his on-field results!
The THT exercise a decade ago is a good jumping-off point, IMO.
DH isn’t penalized for not fielding, DH is “penalized” due to the fact that the potential pool of DHs is every single position player, whereas the other positions (1B to the least degree, C most so) have smaller player pools. The effect of which is to raise the replacement level for DHs.
I find your answer clarifying, but doesn’t change my mind. There is no debate that anybody can pose as a DH, but the true number of potential players who can fill that role is extremely small. I would venture a guess that there are many more decent shortstops than hitters whose only role should be as a DH. Yet the shortstops are given a bonus and the DH’s are penalized heavily. I am still laughing at Augustin Ramirez attempting to play catcher and Moises Ballesteros is on the same path. These guys could, very possibly, provide good value as hitters but damage the team by being forced to play defense. The stigma that is attached to the role of DH is so great that there are many players who put on a glove who should never play defense. Kyle Schwarber doesn’t try to fake it but the Mets would be a better team with Juan Soto as the DH and a capable outfielder playing the field. The position is a powerful tool if used correctly. To penalize the DH position so much, when the pool of true potential DH’s is so small, does not reflect the actual value of a David Ortiz, Frank Thomas or J.D. and Edgar Martinez.
I’ve been saying the same. There needs to be a new approach to positional adjustments. Last year there was only 1 (Carlos Santana) first baseman with a positive defensive fWAR.
Wow OOPSY loves Briceno. And if I’m reading correctly, it has nothing to do with the fact that he played more at catcher last year than anywhere else? After some scuffles in the early weeks at AA he progressed, but that’s a serious stick that can generate 4 wins, and he’s ranked among a bunch of true SS/CFs who can also hit.
It does have a little to do with that, Briceno is one of a few edge cases, so his defensive projection basically assumes he’d be a good defensive 1B, or a well below average C…but either way the bat is enough to carry him to a strong WAR projection
I have a really hard time thinking of a reason to *not* like Briceno except that he is probably a first baseman.
He and Ralphy Velazquez are interesting because their bats are probably as safe as any player in the minors who ended the year in AA. They check all the boxes. They hit for power, they don’t strike out too much, their BABIP and walks are neither unnaturally high or low. The scouting reports are of a well rounded hitter. They weren’t old for the level and probably were a bit young. By all indications these guys are going to run wRC+’s at or above 120 in MLB.
But if for some reason the assessment that they’re going to hit is wrong and they don’t hit at a 120 wRC+ or better it will be hard for them to play every day because they aren’t going to provide a ton of defensive value at first base.
Wyatt Sanford, eh?
Interesting how within the Dodgers system the statistical projections prefer Kendall George and Alex Freeland over scouting darlings Zyhir Hope, Josue De Paula and Mike Sirota. I assume scouts prefer loud tools and high ceilings while statistical models weigh defense more heavily and prefer higher floors.
Tong over McLean is uhhhh….
Interesting
A really good example of why you don’t just scout the stat line
Steamer and the bat have them basically tied despite tong being younger. ZiPS prefers McLean by about as much as OOPSY prefers Tong. In any case, both these guys look very good, and excel at doing the things projection systems like (basically, good K% minus BB%, which tong excels at, and high GB%, which mclean excels at)
Great unveiling!
Minor note that Owen Caissie is showing as CHC still but in MIA now.
Thanks! Fixed now. Spot checking the teams was apparently less than a foolproof strategy on my part haha
Thank you. Great job. I had two suggestions:
1) Would be awesome to make a similar list of guys under 25 or less than 3yrs MLB. I think there’s a huge gap between prospect rankings and established MLB performance. Please help us close it!
2) Publishing the Board rank next to these guys would give a nice reference. ZIPs, too.
Top 25 and unders is a good idea for my next piece, though we’re working on getting peak war forecasts on fangraphs for everyone, mlb and milb included, so you’ll be able to see it there soon too. I can add the comparison ranks later this week, probs tmrw…much appreciated!
THANK YOU! When on the 25&U??? Need this for my Strat-O-Matic draft ASSAP! 🙂
It’ll likely take us another week or two to get them up at FanGraphs, but everything is already available at scoutthestatline dot com, too, if time is of the essence…Added FanGraphs T100 and ZiPS T100 ranks to the main table in this article now. Thanks 🙂
Oopsy is very kind to the Nationals!
I was not expecting to see Kane Kepley or Ty Southsiene on one of these lists. Nice to know that at least one system sees the Cubs as having a little top talent in the minors after graduations and trades the last couple of years.
Interesting OOPSY agrees with my contention that the impact Red Sox’s signing of Ranger Suarez is muted due to who would be bumping out of the rotation. I didn’t expect Tolle and Early to project this well though. Especially for Tolle who seemed raw but with big stuff during his call up. He could easily go off. Early seems like the higher floor lower ceiling for 2026 unless he adds another tick to his fb.
It would be interesting to see what year those peak WAR values are for. But even putting that aside, the team will almost certainly need 7+ starters for the season. Adding Suarez ensures that Early and Tolle are brought up when they’re ready, not because they are needed to fill in.
I mean. Obviously, oopsy is waaaay off with the Brewer prospects. Definitely not as high on them as I am. IMO should be 50% brewer prospects in the top 100. So idk. Maybe they need to tweak the algorithm. Hi
I like that you ended with ‘Hi.”
I mostly agree with you but with one tweak–it should be 50% Red Sox prospects.
Got it, next year’s will be 50 brewers and 50 bo-sox. Hi 👋
OOPSY seems lower on Eldridge than pretty much anyone else, and that assessment seems right to me. BA, Law, Pipeline, FG, all have him in the top 25, the last two rating him a 55. That’s fine, of course. Sometimes scouting picks up on things that are not in the numbers, and vice versa. But what doesn’t make sense is that they see basically the same skills and weaknesses OOPSY does.
For example, FG and Pipeline both have him as a 40 bat, 20-30 speed, and 40 defense, and 70-80 power. How does all that add up to an above average player? That sounds like a DH/1B with a .230/.300/.480 line. That’s a nice player to have but nothing to get too excited about.
Given his grades, I think OOPY’s placement of him makes more sense.
I’m surprised that the players from 40-50 are all ahead of Rainer.