Archive for 2025 Trade Deadline

2025 Trade Value: Nos. 1-10
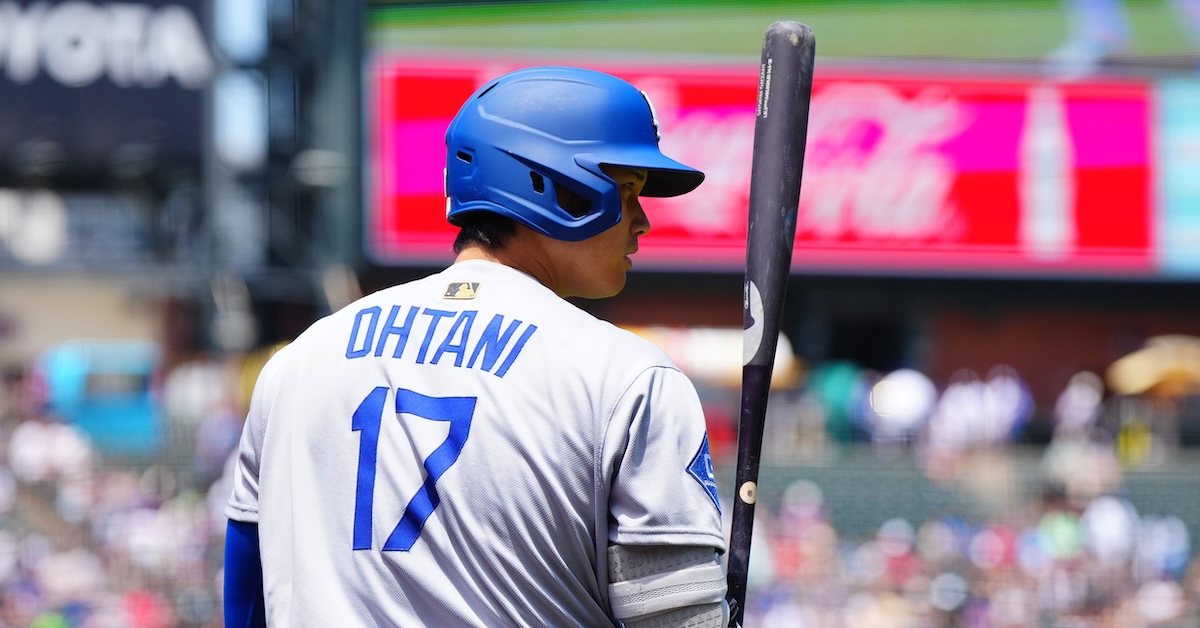
Ron Chenoy-Imagn Images

As is tradition at FanGraphs, we’re using the lead-up to the trade deadline to take stock of the top 50 players in baseball by trade value. For a more detailed introduction to this year’s exercise, as well as a look at the players who fell just short of the top 50, be sure to read the Introduction and Honorable Mentions piece, which can be found in the widget above.

For those of you who have been reading the Trade Value Series the last few seasons, the format should look familiar. For every player, you’ll see a table with the player’s projected five-year WAR from 2026-2030, courtesy of Dan Szymborski’s ZiPS projections. The table will also include the player’s guaranteed money, if any, the year through which their team has contractual control of them, last year’s rank (if applicable), and then projections, contract status, and age for each individual season through 2030 (assuming the player is under contract or team control for those seasons). Last year’s rank includes a link to the relevant 2024 post. Thanks are due to Sean Dolinar for his technical wizardry. At the bottom of the page, there is a grid showing all of the players who have been ranked up to this point.

A note on the rankings: As we reach the top of the list, the tiers matter more and more. There are clear gaps in value. Don’t get too hung up on what number a player is, because who they’re grouped with is a more important indicator. There are three distinct tiers in today’s group of 10 players, and I think they have clearly different valuations; I’d prefer everyone in a given tier over everyone below it, but I’m far less certain within each group. There’s one exception here: the second- and third-ranked guys absolutely belong at the top of their tier. I’ll note places where I disagreed meaningfully with people I spoke with in calibrating this list, and I’ll also note players whose value was the subject of disagreement among my contacts. As I mentioned in the Introduction and Honorable Mentions piece, I’ll indicate tier breaks between players where appropriate, both in their capsules and bolded in the table at the end of the piece.

With that out of the way, let’s get to the final batch of players. Read the rest of this entry »


The Cardinals DFA Erick Fedde as They Slide Further From Contention

Paul Rutherford-Imagn Images

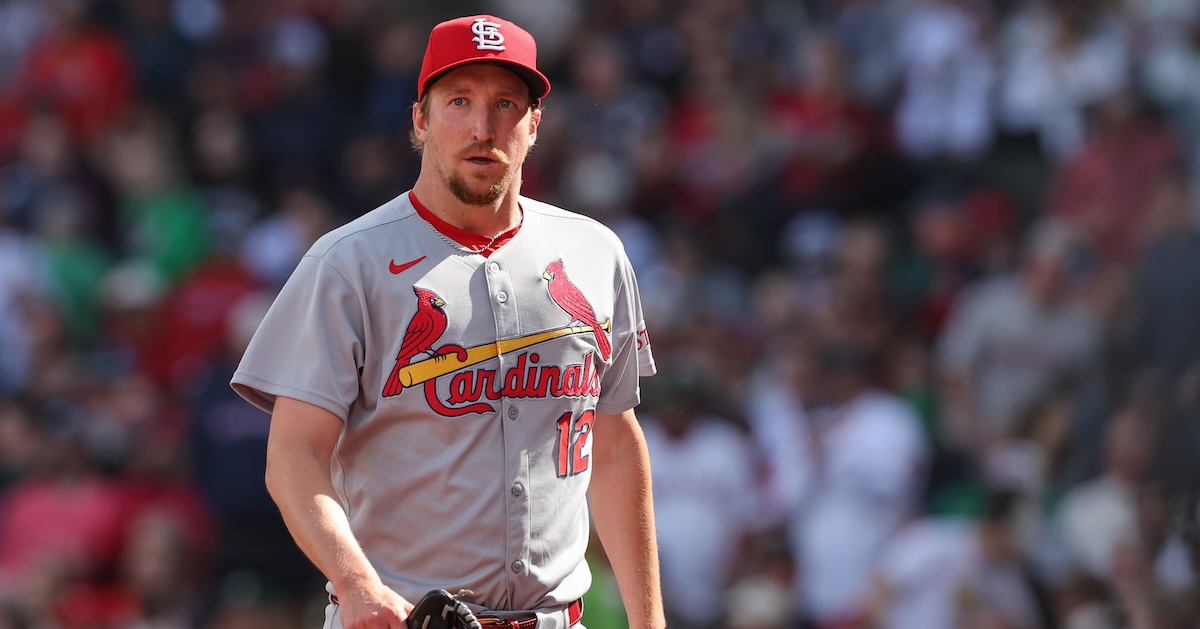
Last July 29, Erick Fedde was a key piece in a three-way blockbuster that ended up having a major impact on the postseason. Unfortunately, that impact wasn’t for the Cardinals, who acquired him from the White Sox; instead Tommy Edman, who was dealt from the Cardinals to the Dodgers in the same eight-player trade, won NLCS MVP honors and helped his new team to a championship. Fedde pitched reasonably well for St. Louis — who missed the 2024 playoffs — late last season, but his performance this year suddenly took a sharp turn for the worse. On Wednesday, the day after he was roughed up by the Rockies, the struggling 32-year-old righty was designated for assignment, a likely prelude to being released.

The move isn’t exactly a shock, and it comes as the Cardinals have slipped in the standings, in all likelihood ruling out an aggressive approach as the July 31 trade deadline approaches. The team has gone 5-12 in July to drop their record to 52-51, plummeting from three games out of first place in the NL Central to 9 1/2 out, and from having a one-game lead for the third Wild Card spot to being 3 1/2 back, with both the Reds (53-50) and Giants (54-49) between them and the Padres (55-47):

Change in Cardinals’ Playoff Odds
Date W L W% GB Win Div Clinch Bye Clinch WC Playoffs Win WS
Thru June 30 47 39 .547 3 14.7% 4.4% 30.0% 44.7% 1.6%
Thru July 22 52 51 .505 9.5 0.6% 0.2% 15.7% 16.3% 0.5%
Change -14.1% -4.2% -14.3% -28.4% -1.1%

While losing five out of their last six to the Diamondbacks and Rockies, the Cardinals’ Playoff Odds dipped below 20% for the first time since May 8:

Read the rest of this entry »


2025 Trade Value: Nos. 11-20

Denis Poroy-Imagn Images

As is tradition at FanGraphs, we’re using the lead-up to the trade deadline to take stock of the top 50 players in baseball by trade value. For a more detailed introduction to this year’s exercise, as well as a look at the players who fell just short of the top 50, be sure to read the Introduction and Honorable Mentions piece, which can be found in the widget above.

For those of you who have been reading the Trade Value Series the last few seasons, the format should look familiar. For every player, you’ll see a table with the player’s projected five-year WAR from 2026-2030, courtesy of Dan Szymborski’s ZiPS projections. The table will also include the player’s guaranteed money, if any, the year through which their team has contractual control of them, last year’s rank (if applicable), and then projections, contract status, and age for each individual season through 2030 (assuming the player is under contract or team control for those seasons). Last year’s rank includes a link to the relevant 2024 post. Thanks are due to Sean Dolinar for his technical wizardry. At the bottom of the page, there is a grid showing all of the players who have been ranked up to this point.

A note on the rankings: As we ascend towards the top of the list, the tiers matter more and more. There are clear gaps in value. Don’t get too caught up on what number a player is, because who they’re grouped with is a more important indicator. Today, the rankings pivot around Tarik Skubal. The players listed ahead of Skubal belong in a different tier than the players behind him; I’m a lot less picky about how you’d order them within those groups. Additionally, Skubal himself has some flex room, as I’ll explain in the blurbs. This high on the list, though, everyone is great. There are no injury rebounds, no stars having awful years. Everyone here is playing well right now, and everyone except Skubal will be around for a while too. As I mentioned in the Introduction and Honorable Mentions piece, I’ll indicate tier breaks between players where appropriate, both in their capsules and bolded in the table at the end of the piece.

With that out of the way, let’s get to the next batch of players. Read the rest of this entry »

2025 Trade Value: Nos. 21-30

Bill Streicher-Imagn Images

As is tradition at FanGraphs, we’re using the lead-up to the trade deadline to take stock of the top 50 players in baseball by trade value. For a more detailed introduction to this year’s exercise, as well as a look at the players who fell just short of the top 50, be sure to read the Introduction and Honorable Mentions piece, which can be found in the widget above.

For those of you who have been reading the Trade Value Series the last few seasons, the format should look familiar. For every player, you’ll see a table with the player’s projected five-year WAR from 2026-2030, courtesy of Dan Szymborski’s ZiPS projections. The table will also include the player’s guaranteed money, if any, the year through which their team has contractual control of them, last year’s rank (if applicable), and then projections, contract status, and age for each individual season through 2030 (assuming the player is under contract or team control for those seasons). Last year’s rank includes a link to the relevant 2024 post. Thanks are due to Sean Dolinar for his technical wizardry. At the bottom of the page, there is a grid showing all of the players who have been ranked up to this point.

A note on the rankings: As we ascend towards the top of the list, the tiers matter more and more. There are clear gaps in value. Don’t get too caught up on what number a player is, because who they’re grouped with is a more important indicator. The biggest split so far in the rankings is between 20-29 and 31-50, the Ketel Marte pivot. I think that all the players I’m discussing today fall in a relatively narrow band, though with meaningfully different risks and upsides. I’ll note places where I disagreed meaningfully with people I spoke with in calibrating this list, and I’ll also note players whose value was the subject of disagreement among my contacts. As I mentioned in the Introduction and Honorable Mentions piece, I’ll indicate tier breaks between players where appropriate, both in their capsules and bolded in the table at the end of the piece.

With that out of the way, let’s get to the next batch of players. Read the rest of this entry »

Catching up With the ZiPS Top 100 Prospects, 2025

Paul Rutherford-Imagn Images

The midseason is a good point to catch up on one’s mistakes, to see where reality has crushed your predictions. We’re nearly half a year from the most recent iteration of the ZiPS Top 100 Prospects, and with a flurry of trades likely to happen in the next week, it seems to be time to check in on how the algorithms which have seized my life and crushed all traces of humanity ZiPS projection system is doing in the prospnostications for 2025.

For each of the top 100 prospects, I’m including a chart of their 2025 minor league translations and how their 2026-2030 WAR has changed since February. Last year was my first midseason review of the prospect list, and some of my charts just made things confusing, so I’m making them less dense/opaque this time around, in the hopes of communicating the data better. The translations and projections are through Monday’s games. As a quick reminder, ZiPS ranks prospects by the average of their 20th-percentile and 80th-percentile career WAR projections, and explicitly leaves out players for which it has nothing to bring to the table, so no high school hitters or pitchers without professional experience.

ZiPS Top 100 Prospects – 1-25 Hitters
Player Rank Pos. PA SB BA OBP SLG 5-Yr WAR (Feb) 5-Yr WAR (Now) Diff
Carson Williams 2 SS 354 13 .182 .269 .344 22.4 18.5 -3.9
Samuel Basallo 3 C 253 0 .225 .324 .472 12.7 12.7 0.0
Roman Anthony 4 CF 265 2 .254 .362 .402 16.8 20.0 3.2
Dylan Crews 5 CF 0 0 .000 .000 .000 15.2 11.9 -3.3
Bryce Eldridge 6 1B 218 0 .224 .271 .378 8.9 4.5 -4.4
Cole Young 7 SS 245 3 .228 .322 .353 15.1 14.7 -0.4
Emmanuel Rodriguez 8 CF 189 5 .224 .360 .340 13.6 12.0 -1.7
Jordan Lawlar 9 SS 250 13 .259 .333 .438 13.2 16.2 3.0
Kristian Campbell 10 2B 97 1 .171 .299 .268 13.7 7.8 -5.9
Coby Mayo 11 3B 195 1 .201 .277 .374 16.0 10.7 -5.3
Max Clark 12 CF 355 7 .232 .335 .353 10.1 13.6 3.5
Jasson Domínguez 13 CF 0 0 .000 .000 .000 13.2 14.0 0.7
Xavier Isaac 14 1B 175 1 .162 .291 .345 8.0 6.5 -1.5
Matt Shaw 15 3B 110 4 .232 .336 .421 14.8 11.5 -3.3
Leo De Vries 16 SS 330 3 .193 .271 .308 6.2 5.8 -0.4
Aidan Miller 17 SS 318 21 .183 .280 .265 7.5 7.8 0.3
Colt Emerson 18 SS 357 3 .202 .280 .293 9.1 6.4 -2.7
Owen Caissie 19 RF 334 2 .219 .305 .404 12.3 11.5 -0.8
Jace Jung 20 3B 286 1 .190 .308 .326 11.6 8.5 -3.1
Cooper Pratt 21 SS 347 11 .200 .281 .282 9.6 9.8 0.2
Marcelo Mayer 22 SS 193 1 .246 .306 .389 8.5 9.6 1.0
Nacho Alvarez Jr. 23 SS 49 0 .308 .449 .462 13.9 11.4 -2.5
Travis Bazzana 24 2B 158 5 .227 .310 .362 11.3 9.8 -1.5
Kyle Teel 25 C 213 5 .247 .329 .379 11.4 11.8 0.4

ZiPS is naturally a bit down on Carson Williams given his struggles offensively this year, but he still has the glove, and a 102 wRC+ in Triple-A for an excellent defensive shortstop isn’t so bad that it would send him tumbling down the ranks. If February ZiPS had known about the first half of the 2025 season, it would have had Roman Anthony hurdle over Williams, Roki Sasaki, and Samuel Basallo to be the no. 1 prospect in baseball. Unlike Williams, Basallo has been very good, it’s just that Anthony has been even better. Read the rest of this entry »


Counterpoint: Don’t Listen to Jay; The Diamondbacks Should Stand Pat or Even Buy at the Deadline

Jayne Kamin-Oncea-Imagn Images

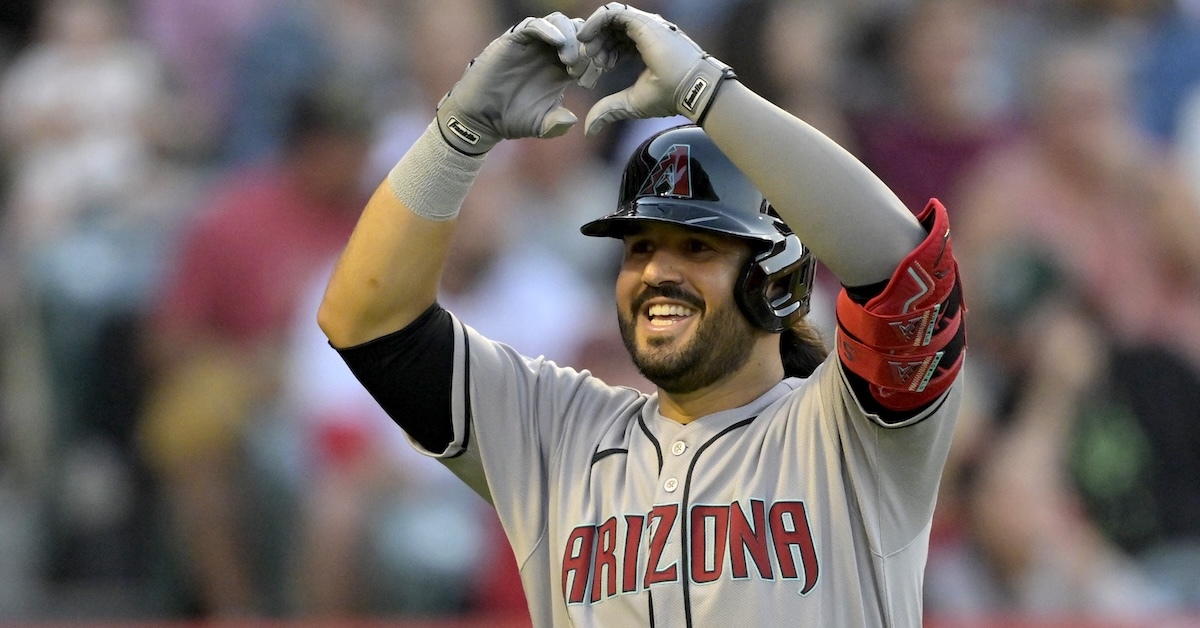
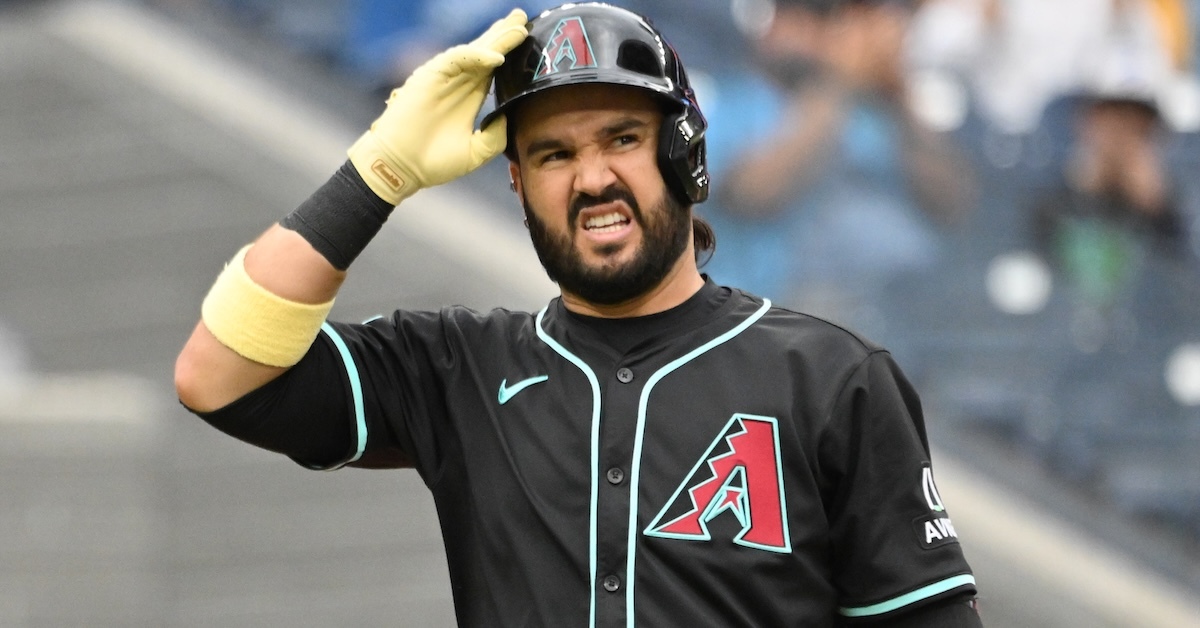
The Arizona Diamondbacks, like King Solomon confronted with a baby, split their first 100 games straight down the middle. With the trade deadline looming a week from Thursday, the Diamondbacks could use a little wisdom right now, because it’s tough to tell whether they should buy or sell.

As of this writing, Arizona sits in fourth place in the NL West, nine games behind the Dodgers. Even after sweeping the Cardinals, a direct Wild Card rival, over the weekend, the Snakes still need to leapfrog four teams — including St. Louis — in order to slither in to the National League’s final Wild Card position. Five and a half games out of the playoffs with 61 games to go is a substantial hill to climb, especially for a team that’s been devastated by injuries. And the Diamondbacks, with their plethora of impending free agents, could command the market if they chose to sell.

Selling is the pragmatic move, the temperate move, the sustainable move, the move for the guys with the longest view in the room, and all the other business school-informed malarkey that gets spouted by the quarter-zips upstairs.

Poppycock, says I. Don’t listen to them, or my colleague Jay Jaffe. The Diamondbacks should go the other direction, and buy at the deadline. Read the rest of this entry »


Point: The Diamondbacks Should Sell at the Trade Deadline

Dan Hamilton-Imagn Images

This was supposed to be the Diamondbacks’ year. After sneaking into the playoffs in 2023 with just 84 wins, then scoring upset after upset to reach the World Series, they improved to 89 wins last year, missing out on October only due to a tiebreaker. The near-miss stung, but the response — signing Corbin Burnes to head their rotation, and keeping the rest of their core intact en route to a club record payroll ($197 million) — made sense. Unfortunately, things haven’t panned out this season, and as the July 31 trade deadline approaches, I believe the Diamondbacks would be best served by selling. (My colleague Michael Baumann feels differently, and will soon make the case on why they should approach the deadline more aggressively.)

Arizona isn’t a bad team. The Diamondbacks have gone just 50-51, but they’ve outscored their opponents by 17 runs; they’re roughly two wins shy of their PythagenPat-projected record and three wins shy of their BaseRuns-projected records. But they’re also running fourth in the NL West, nine games behind the Dodgers (59-42), and they’re 5 1/2 games out of the third NL Wild Card spot, currently occupied by the Padres (55-45), with the Giants, Cardinals, and Reds (all 52-49) between them. It’s not the distance that’s working against them with 61 games to play, it’s the traffic. With so many teams vying for playoff spots, the Diamondbacks have just a 14.9% chance of reaching the postseason — better at least than the Reds (10.8%) — but their odds of winning the World Series are down to 0.7%. It’s tough to envision them making a deep October run not only without Burnes, who underwent Tommy John surgery in June, but with lesser versions of Zac Gallen, Brandon Pfaadt, and Eduardo Rodriguez than they expected. Read the rest of this entry »


2025 Trade Value: Nos. 31-40

Joe Rondone/The Republic/USA TODAY NETWORK via Imagn Images

As is tradition at FanGraphs, we’re using the lead-up to the trade deadline to take stock of the top 50 players in baseball by trade value. For a more detailed introduction to this year’s exercise, as well as a look at the players who fell just short of the top 50, be sure to read the Introduction and Honorable Mentions piece, which can be found in the widget above.

For those of you who have been reading the Trade Value Series the last few seasons, the format should look familiar. For every player, you’ll see a table with the player’s projected five-year WAR from 2026-2030, courtesy of Dan Szymborski’s ZiPS projections. The table will also include the player’s guaranteed money, if any, the year through which their team has contractual control of them, last year’s rank (if applicable), and then projections, contract status, and age for each individual season through 2030 (assuming the player is under contract or team control for those seasons). Last year’s rank includes a link to the relevant 2024 post. Thanks are due to Sean Dolinar for his technical wizardry. At the bottom of the page, there is a grid showing all of the players who have been ranked up to this point.

One note on the rankings: Particularly at the bottom of the list, there isn’t a lot of room between the players. The ordinal rankings clearly matter, and we put them there for a reason, but there isn’t much of a gap between, say, the 38th-ranked player and the guy who would have been 58th if the list went that deep. The magnitude of the differences in this part of the list is quite small, though it picks up around no. 30, as I’ll discuss today. Several of the folks I talked to might prefer a player in the Honorable Mentions section to one on the back end of the list, or vice versa. I think the broad strokes are correct, and this is my opinion of the best order, but with so many players carrying roughly equivalent value, disagreements abounded. I’ll note the places where I disagreed meaningfully with the people I spoke with in calibrating this list, and I’ll also note players whose value was the subject of disagreement among my contacts. As I mentioned in the Introduction and Honorable Mentions piece, I’ll also indicate tier breaks between players where appropriate, both in their capsules and in the table at the end of the piece.

With that out of the way, let’s get to the next batch of players. Read the rest of this entry »


The Worst Team Defenses Among Contenders

Jordan Johnson-Imagn Images

If you followed along with my Replacement Level Killers series, you’re no doubt familiar with the disheveled state of the Twins. After last year’s epic late-season collapse, Minnesota started slowly, clawed its way back into contention, and then stumbled during a 9-18 June; the team is now 48-51 with 17.5% Playoff Odds, still good enough to qualify for my series highlighting the weakest spots on contenders. Within that series, the Twins made a major league-high five appearances: at catcher, first base, second base, third base, and right field. An underrated part of their struggles is their defense. To the extent that they can still be considered contenders, their glovework stands out as the worst of any playoff hopeful based upon the methodology I used to identify the best team defenses thus far a few weeks ago.

Along with that piece, this is part of my annual midseason dip into the alphabet soup of defensive metrics, including Defensive Runs Saved (DRS), Statcast’s Fielding Run Value (FRV), and our own catcher framing metric (hereafter abbreviated as FRM, as it is on our stat pages). Longtime standby Ultimate Zone Rating has been retired, which required me to adjust my methodology.

On an individual level, even a full season of data isn’t enough to get the clearest picture of a player’s defense. Indeed, it’s not at all surprising that samples of 800 innings or fewer produce divergent values across the major metrics; different methodologies produce varying spreads in runs from top to bottom, spreads that owe something to what they don’t measure, as well as how much regression is built into their systems. Pitchers don’t have FRVs, and DRS tends to produce more extreme ratings (positive and negative) than Statcast. But within this aggregation, I think we get enough signal roughly 60% of the way through the season to justify checking in; I don’t proclaim this to be a bulletproof methodology so much as a good point of entry into a broad topic. Read the rest of this entry »

2025 Trade Value: Nos. 41-50

Bruce Kluckhohn-Imagn Images

As is tradition at FanGraphs, we’re using the lead-up to the trade deadline to take stock of the top 50 players in baseball by trade value. For a more detailed introduction to this year’s exercise, as well as a look at the players who fell just short of the top 50, be sure to read the Introduction and Honorable Mentions piece, which can be found in the widget above.

For those of you who have been reading the Trade Value Series the last few seasons, the format should look familiar. For every player, you’ll see a table with the player’s projected five-year WAR from 2026-2030, courtesy of Dan Szymborski’s ZiPS projections. The table will also include the player’s guaranteed money, if any, the year through which their team has contractual control of them, last year’s rank (if applicable), and then projections, contract status, and age for each individual season through 2030 (assuming the player is under contract or team control for those seasons). Last year’s rank includes a link to the relevant 2024 post. Thanks are due to Sean Dolinar for his technical wizardry. At the bottom of the page, there is a grid showing all of the players who have been ranked up to this point.

One note on the rankings: Particularly at the bottom of the list, there isn’t a lot of room between the players. The ordinal rankings clearly matter, and we put them there for a reason, but there isn’t much of a gap between, say, the 38th-ranked player and the guy who would have been 58th if the list went that deep. The magnitude of the differences in this part of the list is quite small. Several of the folks I talked to might prefer a player in the Honorable Mentions section to one on the back end of the list, or vice versa. I think the broad strokes are correct, and this is my opinion of the best order, but with so many players carrying roughly equivalent value, disagreements abounded. I’ll note places where I disagreed meaningfully with the people I spoke with in calibrating this list, and I’ll also note players whose value was the subject of disagreement among my contacts. As I mentioned in the Introduction and Honorable Mentions piece, I’ll also indicate tier breaks between players where appropriate, both in their capsules and in the table at the end of the piece.

With that out of the way, let’s get to the first batch of players. Read the rest of this entry »