Archive for Daily Graphings

Musings on Minor League Home Runs

One of the most significant stories of the past few years of baseball has been the changing composition of the baseball. I mean story in the grand narrative sense, but I also mean it in the sense of literal stories. The slice-open-a-baseball-and-catalog-its-contents article has gotten very popular over the last few years, as have studies of drag and bounciness. Physics is having a moment in baseball analysis.

One of the frustrating parts of breaking down the new ball’s effect on offense is that there was no clean way to isolate which hitters were helped most. Many batters adapted their swings to the new ball as the ball kept changing. The ball undoubtedly led to more home runs, as an independent panel reported in 2018. Which batters, though, were the biggest beneficiaries of the new ball? The launch angle revolution might increase batters’ home run rates, but surely a lot of its popularity comes down to the fact that home runs started flying out of the park at elevated rates as the ball changed. Separating cause from effect as swings and baseballs change over years’ worth of games is difficult. Our own Jeff Sullivan took a shot at it in 2016, but didn’t find much evidence for one group over another.

Luckily, this season provides a convenient, natural experiment. To much fanfare, Triple-A switched over to using the major league ball this year. Home runs predictably skyrocketed, driven by the new ball. This creates an opportunity for all kinds of research, such as this attempt by Baseball America to test out whether the ball changes fastball velocity. I thought I’d take the occasion of this new ball to investigate something I’ve always wanted to know about the home run surge: what types of hitters does the new ball help most? Read the rest of this entry »


Introducing RosterResource Depth Charts!

As you might have already heard, RosterResource will be transitioning its baseball content to FanGraphs over the next few months. Effective today, the 30 depth charts can be found here.

Our first version is close to an exact replica of RosterResource, with a few important improvements. The load time is much faster, and player names link to the corresponding FanGraphs player page. In addition, the minor league power rankings, plate appearances, and innings will be updated daily as opposed to weekly.

In case you’re unfamiliar with RosterResource, here’s the lowdown. I created the site just over 10 years ago. It was initially called MLBDepthCharts but was renamed RosterResource a few years later. The idea was that the site would be an easy-to-read, visual interpretation of a team’s 25-man roster and organizational depth throughout the entire year. It has evolved over time, but at a pace that was never fast enough for me. With the move to FanGraphs, you should expect to see a cross-pollination of data and features from both FanGraphs and RosterResource in the hopes of bringing you a more useful product. Read the rest of this entry »


Ball Four’s Big Bang: A Conversation with Jim Bouton and Dr. Paula Kurman

In January 2017, a publicist from SCP Auctions contacted me with an invitation to interview Jim Bouton, the pitcher-turned-author whose candid, irreverent, and poignant “tell-some” account of his 1969 season, Ball Four, became not just a best seller but a game-changer in the coverage of athletes, and a cultural touchstone that resonated far beyond the diamond. I jumped at the chance; not only had I first read a dog-eared copy of Ball Four at age nine, I had returned to the book countless times over the years, connecting to its outsider point-of-view and drawing the inspiration to write myself while crossing paths with Bouton a few times from 2000-08. Our conversations had always been a delight.

SCP was auctioning the Ball Four original manuscript and ancillary materials, “every note Bouton scribbled, every tape he recorded, the full manuscript and all the heated correspondence from Major League Baseball, which ordered him to deny it,” wrote the New York Times’ Typer Kepner. Also included was the edited manuscript “detailing the publisher’s attempt to gut the book of every tough, revealing, or sexual passage,” a letter from the publisher’s lawyer “identifying 42 instances of potential libel, and Bouton’s final edits that addressed only 4 of them,” correspondence related to Bouton’s always-contentious contract negotiations from his playing days, and “exquisitely maintained scrapbooks” kept by Bouton’s mother, detailing every stage of his career, including his 1978 comeback. The Ball Four lot, whose auction was scheduled to end on January 21, was expected to fetch “somewhere in the $300,000-to-$500,000 range” and already had attracted multiple bidders, according to the managing director of SCP Auctions.

The stars did not quite align. Initial hopes of conducting our interview face-to-face at MLB Network headquarters in Secaucus, New Jersey, in connection with separately scheduled appearances on MLB Now, were dashed when the 77-year-old Bouton decided to pass on a trip from his home in the Berkshires to the studio. Instead, we did the interview by phone on Friday, January 13, eight days before the auction closed. What I did not know until calling was that Bouton was ailing. As his second wife, Dr. Paula Kurman, explained before our interview, he had not fully recovered from a 2012 stroke and had difficulty speaking (as well as reading and writing). Hence, she would assist with the interview.

Read the rest of this entry »


Prospect Dispatch: Cape Cod League

I spent the July 4th weekend in Cape Cod this year, which is far from the worst place to be for that holiday. Beyond the pleasant weather and plentiful beaches there was, of course, lots of baseball being played in the prestigious Cape Code League. Below are some of my observations of a few of the college players I saw.

Harwich Mariners
Daniel Cabrera, OF, LSU

Cabrera opened a lot of eyes as a freshman in Baton Rouge, hitting .315/.405/.525 with 36 strikeouts against 34 walks in 63 games. He followed up with a sophomore campaign that saw him hit 12 home runs but also decrease his walks (24) and increase his strikeouts (54) in 59 games. He steps into this 2019 Cape Cod League campaign ranked 21st on THE BOARD for the 2020 draft.

Cabrera has a smooth and polished left-handed swing with a good path to the ball. He gets into his back hip well and transfers weight quickly, and has a handsy, athletic-looking swing. In my look, he showed solid average bat speed and an aggressive, pull-oriented approach geared for power. Cabrera’s aggressiveness was a negative in this look – he expanded the zone on several occasions against pitchers with below average fastballs – enough so that I think there’s a chance it holds him back from reaching his peak potential hit tool. A swing like Cabrera’s could project as one of an above average hitter, but I think he settles more in the 45-grade hit range with a propensity to swing and miss. However, the power should play at least average and I would be comfortable projecting more. It is likely more 55-grade power than anything above it, but the ball jumps off his bat and his hands’ quickness should allow him to jump on hittable pitches and drive them more often than not. Read the rest of this entry »


We Adjusted Several Prospects’ Rankings

The two of us recorded a podcast during which we combed through our Futures Game notes. This announced update to THE BOARD is that discussion made real on the site. All of the guys with new FVs are noted below, along with brief notes on why their FVs changed. If a player moved within their FV tier, there is a stock up or stock down arrow on THE BOARD. The updates noted here don’t include players who have been added to our rankings and went from 35 FV to 35+ FV, since that happens pretty often. We’re also fully updated to reflect recent trades. Lastly, if you’d like to see who is set to graduate from the list next, check the right sidebar on the FG Prospects homepage. And remember to follow @FG_prospects on Twitter for live BOARD updates.

Moved Up

Jo Adell, CF, Angels and Bo Bichette, INF, Toronto Blue Jays (60 FV to 65 FV):
Both move up due to increased confidence that they’ll be stars, with the ZiPS updates Kiley received for the Trade Value Series also helping. Adell seems fully recovered from a scary ankle and hamstring injury suffered during spring training, and he’s hitting .376/.442/.673 as a 20-year-old at Double-A. Bichette has a 116 wRC+ as a 21-year-old at Triple-A and Toronto seems inclined to leave him at shortstop.

Yordan Alvarez, DH, Astros (50 FV to 55 FV):
Alvarez is generating huge power with ease and comfort. Houston’s handling of his playing time while the team was in Colorado is an indication that he’ll offer no defensive value while his skillset is that of an older player, but his offensive tools are a cut above some of this year’s more productive DHs.

Drew Waters, CF, Braves (50 FV to 55 FV):
Waters continues to rake as a young-for-the-league, up-the-middle prospect, and while the .459 BABIP isn’t sustainable, scouts are split on him vs. Cristian Pache long-term, so they’re a little closer on our list now.

Nate Pearson, RHP, Blue Jays (50 FV to 55 FV):
Pearson belongs in the same FV tier as Sixto Sanchez as they each have monster stuff, questionable builds, and no track record of pitching for a full season. Read the rest of this entry »


Presenting the First Half Exhilaration Index and Horror Scores

At the beginning of June, I experimented with a metric designed to determine how exciting it has been to watch a team. Using leverage index, I factored in how often a team played in games with something at stake, and looked at how often the team actually delivered in those moments using WPA. I separated both categories into hitting and pitching and made 100 the major league average. I took the geometric mean of those four numbers; the result is the Exhilaration Index. At the same time, I took the difference between the team’s leverage index scores and their WPA scores to determine how often a team let fans down in big situations, a number that I called their Horror Score.

Here is the Exhilaration Index for June:

June Exhilaration Index
Team Hitting LI Score Pitching LI Score Hitting WPA Score Pitching WPA Score Exhilaration Index
Dodgers 113 122 106 118 114.5
Red Sox 124 126 106 103 114.4
Twins 128 123 90 119 113.9
Braves 98 123 141 95 112.9
Pirates 139 112 106 82 107.8
Rockies 96 120 114 92 105.0
Nationals 84 108 115 114 104.6
Astros 102 107 97 112 104.3
Giants 108 102 94 109 102.9
Cardinals 111 102 89 111 102.8
Brewers 104 105 98 102 102.2
Rangers 91 100 95 126 102.1
Athletics 85 107 110 108 102.0
Padres 109 108 116 78 101.8
Royals 124 108 82 97 101.7
White Sox 95 113 93 101 100.2
Reds 100 95 80 114 96.6
Indians 82 85 103 121 96.6
Cubs 106 82 93 104 95.7
Phillies 100 94 103 82 94.4
Yankees 71 89 127 97 93.7
Mets 104 100 112 64 93.0
Rays 91 90 81 109 92.5
Mariners 98 85 107 81 92.4
Diamondbacks 91 76 98 108 92.3
Angels 80 81 104 102 90.9
Marlins 78 89 96 101 90.5
Blue Jays 89 89 97 82 89.1
Tigers 104 85 72 83 85.4
Orioles 95 72 74 84 80.8

Here are the Horror Scores for June:

June Horror Scores
Team Leverage Index Score WPA Score Horror Score
Pirates 125 94 31
Royals 116 90 27
Twins 126 104 21
Red Sox 125 104 21
Tigers 95 78 17
Mets 102 88 14
Padres 109 97 12
White Sox 104 97 7
Cardinals 107 100 7
Dodgers 117 112 5
Rockies 108 103 5
Brewers 105 100 5
Orioles 83 79 4
Phillies 97 93 4
Giants 105 101 3
Reds 98 97 1
Astros 104 104 0
Blue Jays 89 90 -1
Mariners 92 94 -2
Cubs 94 98 -5
Rays 91 95 -5
Braves 111 118 -7
Athletics 96 109 -13
Rangers 96 110 -15
Marlins 83 98 -15
Nationals 96 115 -19
Diamondbacks 83 103 -20
Angels 80 103 -23
Indians 84 112 -28
Yankees 80 112 -32

Here’s the Exhilaration Index for the first half of the season:

First Half Exhilaration Index
Team Hitting LI Score Pitching LI Score Hitting WPA Score Pitching WPA Score Exhilaration Index
Red Sox 124 119 110 101 113
Dodgers 103 106 126 114 112
Braves 95 126 123 100 110
Rays 103 116 90 129 108
Nationals 112 116 111 96 108
Yankees 91 106 124 113 108
Twins 86 113 106 126 107
Rockies 120 106 102 96 106
Athletics 86 126 108 106 106
Pirates 120 106 115 84 105
Mets 120 119 110 76 104
Diamondbacks 112 103 95 107 104
Brewers 99 110 98 106 103
Astros 95 87 111 123 103
Padres 95 113 99 101 102
Cubs 99 100 105 101 101
Reds 112 103 80 113 101
Cardinals 108 93 98 102 100
Phillies 91 93 110 95 97
Rangers 82 90 103 106 95
Indians 82 84 97 120 95
Tigers 137 93 74 84 94
Giants 99 87 86 104 94
Marlins 112 93 71 98 92
White Sox 86 87 105 92 92
Angels 82 81 106 93 90
Royals 99 97 79 77 87
Blue Jays 91 81 79 88 85
Mariners 78 77 106 71 82
Orioles 82 68 74 77 75

And finally, the Horror Scores through the All-Star Break:

First Half Horror Score
Team Leverage Index Score WPA Score Horror Score
Tigers 115 79 36
Mets 120 93 27
Royals 98 78 20
Marlins 103 85 18
Red Sox 122 106 16
Pirates 113 99 14
Rockies 113 99 14
Reds 107 97 11
Nationals 114 103 10
Diamondbacks 107 101 7
Padres 104 100 4
Brewers 104 102 2
Blue Jays 86 84 2
Cardinals 100 100 0
Rays 110 109 0
Orioles 75 75 -1
Athletics 106 107 -1
Braves 110 112 -2
Giants 93 95 -2
Cubs 99 103 -3
Phillies 92 103 -11
Mariners 78 89 -11
White Sox 87 99 -12
Dodgers 105 120 -15
Twins 100 116 -17
Angels 81 99 -18
Rangers 86 104 -18
Yankees 98 118 -20
Indians 83 109 -26
Astros 91 117 -26

Fans of the Red Sox, Dodgers, Braves, and Rays seem to be getting their money’s worth this season, while the Tigers, Royals, Marlins, and Mets have provided their faithful an awful lot of heartache. We’ll check back as the second half progresses to see if the horrified receive any relief, or if the fortunes of the delighted shift.


Andrew Cashner and Theoretical Home Run Shenanigans

The Boston Red Sox and the Baltimore Orioles completed a trade over the weekend, with Baltimore sending pitcher Andrew Cashner to Boston in return for center fielder Elio Prado and third baseman Noelberth Romero.

At 28-65, the Orioles appear likely to be eliminated from the playoff race sometime in August. Andrew Cashner is a free agent at the end of the season, and even if Baltimore had a less implausible shot at the playoffs, it makes a lot of sense to get something in return for the right-hander while the getting is good. In this case, the getting is two very deep dives into the Red Sox organization. Prado and Romero are both 17 year-olds out of Venezuela. Neither player is anywhere near the top of the prospect radar at this point. To grab a couple of lottery picks, the Orioles agreed to pay half of Cashner’s salary to the Red Sox, a figure just a bit under $2 million. If either prospect works out, it won’t be a new experience for Cashner, who has been swapped for Anthony Rizzo and Luis Castillo in previous trades.

Cashner has had a decent season on paper, but the Orioles’ return suggests that there is a good deal of skepticism surrounding his 3.83 ERA and 4.25 FIP. The bump in Cashner’s peripherals in 2019 is at least enough for ZiPS to think of him as a one-win player. That’s par for the course for a fifth starter, and it just so happens that’s exactly what the Red Sox were in the market for. It isn’t something that will show up well in playoff projections, but remember that teams can no longer pick up major league-caliber fourth and fifth starter types in August, which means that teams ought to take more care to prepare for emergencies now. And pitchers famously have lots of emergencies. Brian Johnson is currently out due to an intestinal issue, and given that he’s been out for weeks, it seems to be something a good bit more serious than overindulging in spicy chili. He has thrown a couple of bullpens, but his trip to the IL creates some uncertainty, which isn’t a good state of being for a contending team. And Cashner is likely a safer below-average pitcher than Hector Velazquez. Read the rest of this entry »


Sunday Notes: Robert Stock Stimulates His Nervous System (And Hits Triple Digits)

Robert Stock is following a breakthrough season with a rocky season. Last year, the right-hander broke into the big leagues at age 28, and logged a 2.50 ERA in 32 appearances out of the Padres’ bullpen. This year he’s spent the bulk of his time with San Diego’s Triple-A affiliate, and scuffled in his smattering of opportunities in The Show. Currently on the IL with a bicep strain, Stock has a 10.13 ERA in 10-and-two-thirds innings of work.

There’s more to the Robert Stock story than his late-bloomer status and overall pitching prowess. When I talked to the former Los Angeles-area prep at Petco Park recently, I learned that he’s a converted catcher with an unorthodox workout routine.

“I use a training system called EVO UltraFit,” Stock told me. “It involves electrodes, and obscure ways of lifting weights. You’re doing things like jumping off of stuff, and catching things that are falling.”

Watching an ESPN feature on a former NFL safety was the catalyst. Learning that Adam Archuleta “found success through this weird training system,” he decided to try it himself. Just 13 years old at the time, Stock traveled to Arizona, “where the guru is,” and proceeded to adopt the program. He’s been a disciple ever since.

An electrodes apparatus was charging at Stock’s locker as we spoke. Read the rest of this entry »


The Blossoming of Marcus Semien

Marcus Semien is having a moment. Semien finished the 2018 season with 3.7 WAR, nearly doubling the next-best total of his career. There was a catch, however, in that Semien’s WAR was largely fueled by a sudden jump in his defensive numbers. While the numbers for Baseball Info Solutions and Ultimate Zone Rating never completely agreed on Semien, they both thought he was a below-average defender at short. Coming into 2018, per 1350 innings, BIS had Semien at -2.7 runs, while UZR had him at -7.6 runs. In 2018, those numbers were +8.5 runs and +7.9 runs respectively, numbers that, if believed, meant that Semien had added 10-to-15 runs of value from somewhere very unexpected.

While a White Sox prospect, it was thought that Semien would likely struggle playing shortstop in the majors. In the minors, he made 60 errors in 2203 innings (37 errors per 1350 innings), which led the White Sox to find as much time for him at second and third base as possible. And while error rates usually come down in the majors, Semien committed 35 errors in his first season as the A’s shortstop. You could argue that errors can be overused as a method of defensive evaluation — and you’d be correct — but there are limits. UZR actually had Semien as slightly above-average in range, with the -11.7 total run estimate coming from a brutal -12.6 runs from errors. That’s not a run-of-the-mill error-prone season, either:

Worst Error Seasons, Shortstops, 2002-2019
Season Name Error Runs
2015 Marcus Semien -12.6
2017 Tim Anderson -10.7
2010 Ian Desmond -10.4
2010 Starlin Castro -9.7
2015 Ian Desmond -8.7
2004 Angel Berroa -7.6
2014 Jonathan Villar -7.3
2011 Eduardo Nunez -7.3
2006 Hanley Ramirez -6.9
2013 Jonathan Villar -6.9
2006 Felipe Lopez -6.9
2004 Kaz Matsui -6.8
2007 David Eckstein -6.7
2011 Elvis Andrus -6.6
2016 Ketel Marte -6.5
2016 Brad Miller -6.3
2009 Everth Cabrera -6.3
2003 Erick Almonte -6.3
2005 Russ Adams -6.3
2004 Rafael Furcal -6.2
2012 Dee Gordon -6.2
2005 Clint Barmes -6.1
2013 Starlin Castro -5.7
2015 Danny Santana -5.7
2003 Rafael Furcal -5.6

Read the rest of this entry »


James Paxton Has Hit a Bump in the Road

Through the first month of the season, it looked like James Paxton was going to build on his breakout 2018 season and elevate himself into the upper echelons of the pitching ranks. Through May 3, he had posted a 3.11 ERA backed by a 2.59 FIP and a ridiculous 33.6% strikeout rate. On May 3, Paxton exited his start with a knee injury and wound up missing four weeks of play, and since his return from the injured list, he just hasn’t been the same.

In his eight starts since May 29, his FIP has shot up to 4.65 and his strikeout rate has fallen to 24.7%. A vintage 11-strikeout performance in his last start on July 7 is propping up that strikeout rate, too; he struck out just three batters in each of his two previous starts before that. The league average strikeout rate for a starter is 22% so complaining about Paxton’s dip in results feels a little like picking nits. It would be easy to chalk up his post-IL results to the lingering effects of the knee injury or just a string of bad luck. But a deeper look into his pitch repertoire reveals some concerning trends.

Back in early May, Sung Min Kim wrote an article detailing the changes Paxton had made to his pitch mix. In short, Paxton “basically swapped the usage rates of his cut fastball and curveball.” And why wouldn’t he want to throw his cutter more often? He generated a ridiculous number of whiffs with the pitch last year (37.2% whiff rate) and batters simply could not square it up when they did make contact with it (6.5% barrel rate). But the effectiveness of the pitch has waned with greater exposure.

In the past, it’s been a put-away pitch Paxton turned to when he was ahead in the count. He would use his fastball and curveball to get ahead and then earn a strikeout with a well placed cutter. Because he’s throwing his cutter more often this season, he’s had to use it earlier in at-bats. There are only so many two-strike counts to throw it in, so some of those extra cutters have come when the count is in the batter’s favor. Here’s what Paxton’s cutter usage has looked like by count over the last four seasons:

James Paxton, Cutter Usage
2016-2018 2019
Batter Ahead 11.9% 17.6%
Even 39.7% 43.3%
Pitcher Ahead 48.4% 39.1%

Not only is he throwing it more often earlier in the count, he’s also throwing it less often when he does get ahead. Trying to steal a strike with his cutter early in an at-bat isn’t necessarily a bad thing — he used his curveball to do exactly that last year — but it becomes a problem when he can’t locate his cutter in the zone:
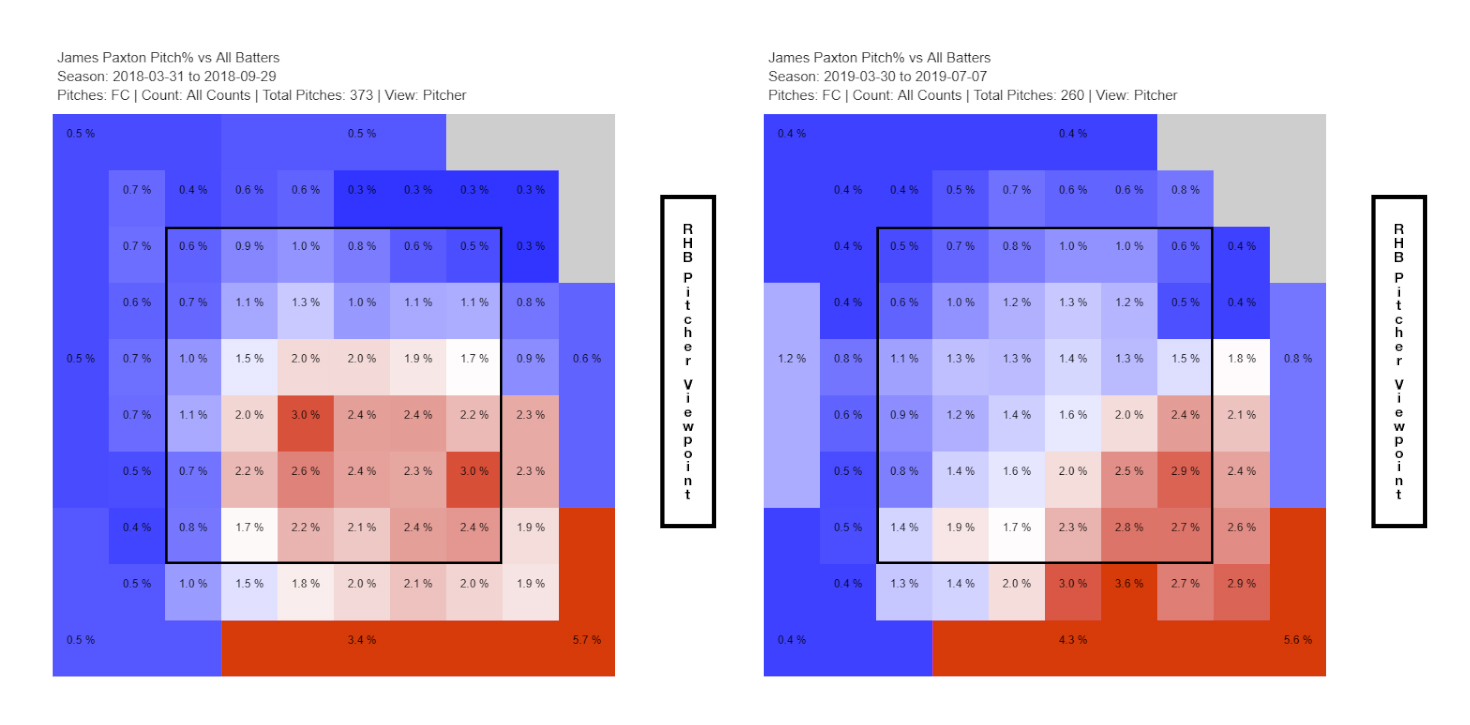
Paxton’s cutter is at it’s very best if he can locate it down and in against a right-handed batter, right over their back foot. That location takes the pitch out of the strike zone to get a swinging strike. But he’s actually spotted his cutter in the zone more often than you might expect. In years past, he’s thrown his cutter in the zone around 47% of the time, a touch below the league average zone rate for a cutter. Even though it feels high for a put-away pitch, it never really affected his ability to earn a swinging strike. This year, he’s locating his cutter in the zone around 35% of the time, the lowest zone rate of any cutter thrown more than 100 times:

James Paxton, cutter results
Zone% Swing% SwStr% Whiff/Sw%
2016-2018 46.8% 57.9% 21.8% 37.2%
2019 34.9% 48.2% 18.7% 38.7%

He’s locating the pitch as though he was ahead in the count and looking for a whiff, but those pitch locations aren’t exactly ideal earlier in the count. Batters are content to just take a cutter when they hold the advantage, knowing that they’re likely to either whiff or it’ll end up out of the zone as a ball. So even though Paxton’s whiff per swing rate on his cutter is just as good as it has been in the past, because his overall swing rate on the pitch is down almost 10 points, his raw number of swinging strikes is down.

Since 2017, Paxton has added more than two inches of horizontal movement to his cutter. It’s possible that additional movement has affected his command of the pitch:
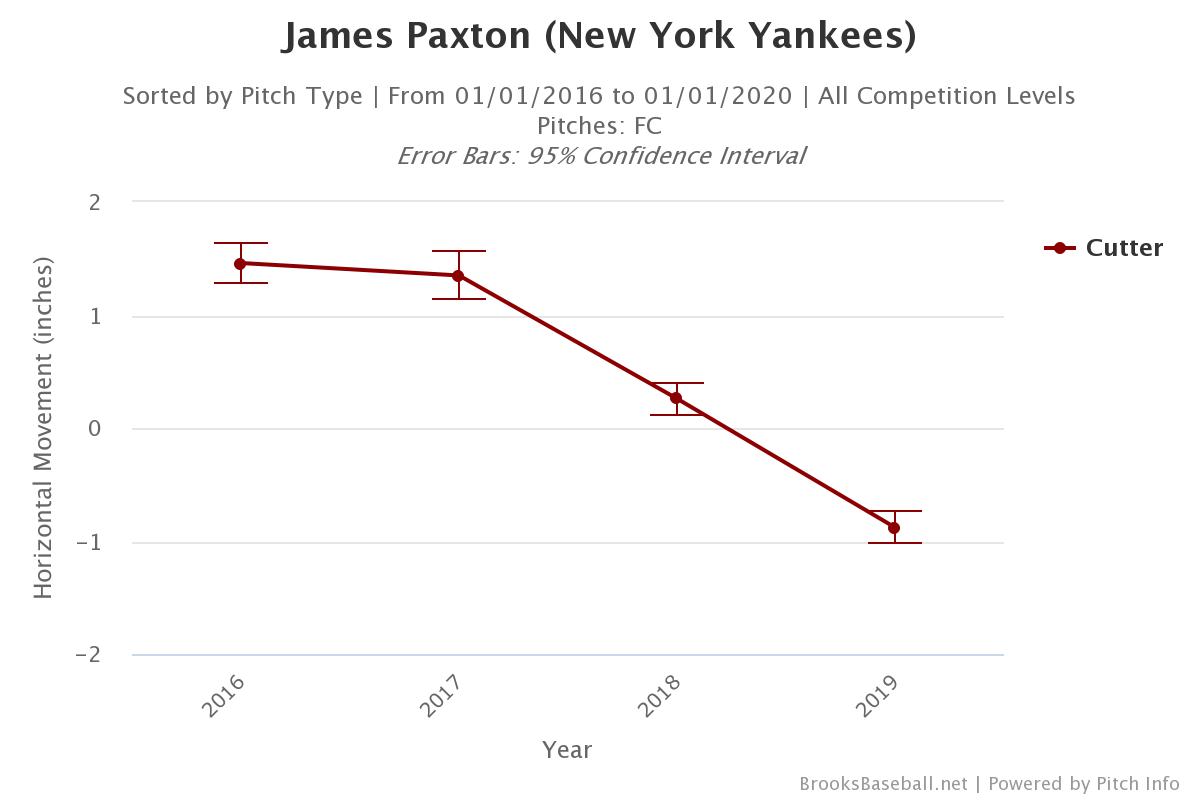
If he’s throwing his cutter the same way he did last year, aiming at a target that would locate the pitch in the zone, that extra horizontal movement could be carrying the pitch out of the zone despite his intent.

It’s also possible that batters are able to identify his cutter more easily this year. Paxton took a big step forward last year when he started to tunnel his high four-seam fastball with his curveball. But his cutter also benefited from that pitch tunnel as well:

James Paxton, fastball-cutter tunnel
Year Pitch Sequence Batter Hand PreMax PreMax Time
2018 Fastball-Cutter RHB 1.25 0.157
2019 Fastball-Cutter RHB 1.46 0.162
SOURCE: Baseball Prospectus

Last year, Paxton’s fastball-cutter pitch tunnel was excellent. The perceived distance between the two pitches in sequence (PreMax) was well above average and they separated in flight (PreMax Time) just a few milliseconds before the tunnel point. Both measures have deteriorated a bit this year and it’s likely due to the location of these pitches in sequence. Paxton’s pitch tunnel works best when his cutter is located right at the bottom of the zone but not too low. THe average location of his cutter this year has given opposing batters a few extra milliseconds to identify whether a pitch is worth swinging at.

I can’t explain why Paxton has swapped the number of curveballs and cutters he throws this year. Maybe he’s lost the feel for his curveball. But the effectiveness of his secondary pitches has waned with the altered usage pattern. The solution is likely a little more complicated than just swapping back. He’s going to have to figure how to locate his cutter a little better, especially if he needs to use it earlier in counts to keep batters off his fastball.
