Next Stop Cooperstown: Clayton Kershaw Announces His Retirement
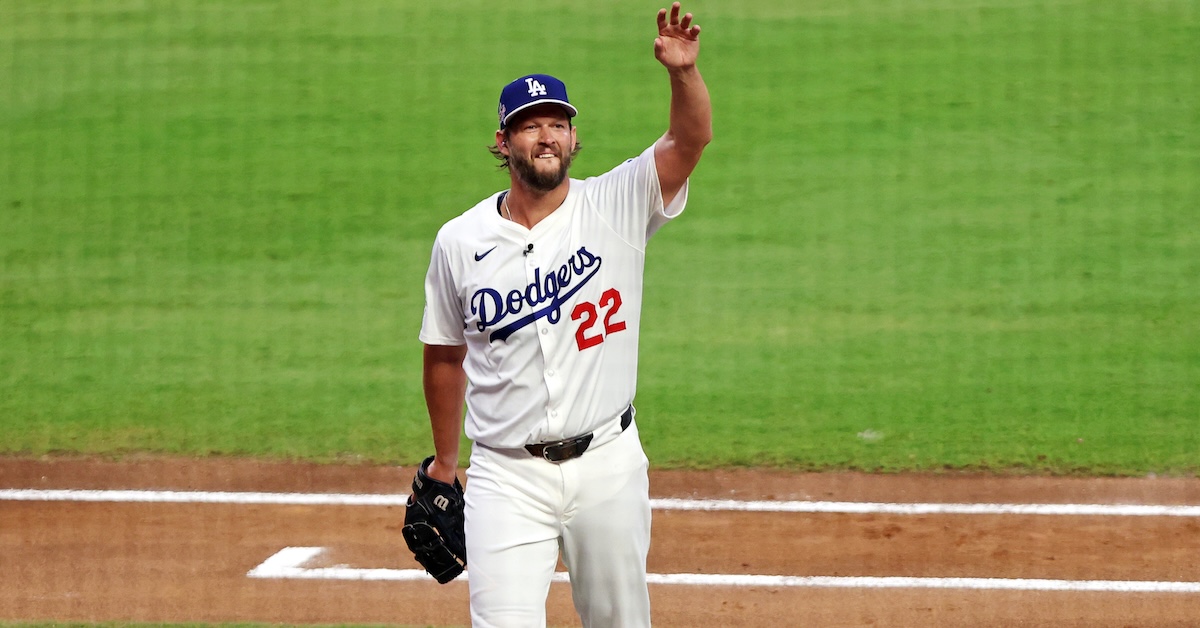
The end of an era is coming to Los Angeles. On Thursday at Dodger Stadium, Clayton Kershaw announced that he will retire at the end of this season, and thus will make the final regular season home start of his career on Friday night. The news isn’t exactly a surprise, given that the 37-year-old lefty has been working more or less year-to-year while occasionally musing about retirement since his three-year, $39 million contract expired after the 2021 season. When Kershaw notched his 3,000th strikeout on July 2, it was generally understood as the final major milestone of his illustrious 18-year career that will one day be celebrated in Cooperstown. Just days later, commissioner Rob Manfred named him to the NL All-Star team as a “Legend Pick.”
On Thursday morning, Kershaw sent a group text to his teammates, telling them of his decision to retire. Teammates Freddie Freeman and Max Muncy both revealed that the pitcher had told them of his plans about a month ago, but swore them to secrecy. On Thursday afternoon, the Dodger released a statement regarding the iconic southpaw’s impending announcement.
— Los Angeles Dodgers (@Dodgers) September 18, 2025
At his press conference, Kershaw expressed measures of gratitude and relief, his voice occasionally cracking as he thanked the organization and his family. He said that he and his wife Ellen had been discussing his retirement all year. “Usually we wait until the offseason to make a final call, but almost going into this season, we kinda knew this was going to be it,” he said. “So [I] didn’t want to say anything in case I changed my mind, but over the course of the season, how grateful I am to have been healthy and out on the mound, being able to pitch, I think it just made it obvious that this was a good sending-off point.”
With 222 career victories, 3,039 strikeouts, 11 All-Star selections, five ERA titles, three Cy Young Awards (2011, ’13, ’14), an MVP award (2014), a Pitching Triple Crown (2011), a no-hitter (June 18, 2014), and two World Series rings (2020 and ’24), Kershaw is a surefire first-ballot Hall of Famer who will be eligible for election on the 2031 BBWAA ballot. He is 20th all-time in S-JAWS, second among active pitchers behind Justin Verlander, who has one more point (66.1 to Kershaw’s 65.1) in about 700 more career innings. Kershaw’s 2.54 ERA is the lowest of any integration-era pitcher with at least 2,500 innings:
| Player | Years | Innings Pitched | ERA |
|---|---|---|---|
| Clayton Kershaw | 2008–2025 | 2,844 2/3 | 2.54 |
| Whitey Ford | 1950–1967 | 3,170 1/3 | 2.75 |
| Jim Palmer | 1965–1984 | 3,948 | 2.86 |
| Tom Seaver | 1967–1986 | 4,783 | 2.86 |
| Juan Marichal | 1960–1975 | 3,507 | 2.89 |
| Bob Gibson | 1959–1975 | 3,884 1/3 | 2.91 |
| Pedro Martínez | 1992–2009 | 2,827 1/3 | 2.93 |
| Don Drysdale | 1956–1969 | 3,432 | 2.95 |
| Mel Stottlemyre | 1964–1974 | 2,661 1/3 | 2.97 |
| Warren Spahn | 1947–1965 | 5,102 1/3 | 3.08 |
Adjusted for ballpark and league scoring levels, Kershaw’s ERA- is the lowest using those same parameters, barely nosing out Martínez:
| Player | Years | Innings Pitched | ERA | ERA- |
|---|---|---|---|---|
| Clayton Kershaw | 2008-2025 | 2,844 2/3 | 2.54 | 65 |
| Pedro Martínez | 1992-2009 | 2,827 1/3 | 2.93 | 66 |
| Roger Clemens | 1984-2007 | 4,916 2/3 | 3.12 | 70 |
| Whitey Ford | 1950-1967 | 3,170 1/3 | 2.75 | 75 |
| Randy Johnson | 1988-2009 | 4,135 1/3 | 3.29 | 75 |
| Greg Maddux | 1986-2008 | 5,008 1/3 | 3.16 | 76 |
| Roy Halladay | 1998-2013 | 2,749 1/3 | 3.38 | 76 |
| Max Scherzer | 2008-2025 | 2,957 1/3 | 3.19 | 76 |
| Kevin Brown | 1986–2005 | 3,256 | 3.28 | 78 |
| Justin Verlander | 2005-2025 | 3,557 1/3 | 3.32 | 78 |
| Bob Gibson | 1959-1975 | 3,884 1/3 | 2.91 | 78 |
If you’re wondering about the rankings of another three-time Cy Young-winning Dodgers lefty, Sandy Koufax pitched to a 2.76 ERA and 75 ERA- in 2,324 1/3 innings; at a 2,000-inning cutoff, he would rank fourth in ERA and seventh in ERA-. Kershaw is tied with outfielder Zack Wheat and shortstop Bill Russell for the most seasons played with the Dodgers (18), and he holds the franchise records for strikeouts and pitching WAR (78.7 fWAR, 77.6 bWAR) while ranking second in wins only to Don Sutton (233).
After reaching free agency following the 2021, ’22 and ’23 seasons, Kershaw mulled the possibility of leaving the Dodgers to sign with the Rangers, his hometown team. But between his various offseason rehabilitation programs, the 2021–22 owners’ lockout, and the Rangers’ financial uncertainty regarding their cable television deal, staying with the team that drafted him out of Highland Park High School with the seventh pick in 2006 — a round that accounts for eight Cy Youngs between Kershaw, 10th pick Tim Lincecum, and 11th pick Max Scherzer — always made more sense. When he reported to Camelback Ranch in February, Kershaw admitted that he may have previously undervalued the possibility of spending his entire career with the Dodgers:
“I don’t think I put enough merit on it at times, what it means to be able to be in one organization for your entire career. You look at people throughout all of sports that have been able to do that, and it is special, it is. I don’t want to lose sight of that. Getting to be here for my whole career, however long that is, is definitely a goal.”
It’s been an amazing run in Los Angeles. Kershaw first turned heads during spring training in 2008. In a March 9 Grapefruit League game against the Red Sox, 10 days short of his 20th birthday, he threw a curveball that buckled the knees of Sean Casey and awed broadcaster Vin Scully, whose nickname for that big-bending pitch stuck: “Ohhh, what a curve ball! Holy mackerel! He just broke off Public Enemy Number One. Look at this thing! It’s up there, it’s right there, and Casey is history.”
Kershaw began that season at Double-A Jacksonville, making 11 starts before being called up to debut against the Cardinals on May 25, 2008. In his prime, he pumped his fastball in the mid-90s — it averaged 95.0 mph in his rookie season, and was still at 94.3 mph as of 2015 — but that famous curveball and its similarly devastating cousin, his slider, are the pitches that have earned him a spot in the pantheon. According to Baseball Savant — which covers the entirety of his career via PITCHf/x and Statcast — batters have hit .145 and slugged .216 with a 36.5% whiff rate against his curve, and hit .183 and slugged .292 with a 38.8% whiff rate against his slider; the former was strike three 753 times, the latter a jaw-dropping 1,332 times.
Though he flirted with adding a changeup here and there, and over the past three seasons has dabbled with an effective splitter, Kershaw’s three-pitch combination, coming from an extremely over-the-top arm slot (62 degrees as of 2020, the first year of Statcast’s measurements in that area, and 56 degrees as of this season), with a familiar hesitation at the top of his delivery, was enough to befuddle batters. His .211 batting average allowed is the second lowest at the 2,500-inning cutoff since integration, nestled between Nolan Ryan (.204) and Martínez (.214), while his 65 OPS+ allowed is second to Martínez’s 61, ahead of Clemens’ third-ranked 68. That dominance drove his success, and that of the Dodgers, for the better part of the past two decades. If the team holds on to win the NL West this season, it will be its 14th division title in his 18 seasons, and its 15th playoff berth.
Kershaw’s announcement comes at a time when he has begun to scuffle a bit; over his last three starts, he’s yielded 10 runs and walked nine in 13 2/3 innings, and he hasn’t lasted six innings since his August 15 start against the Padres — a memorable outing in which he helped the Dodgers halt a four-game losing streak and reclaim a share of first place in the NL West. Even so, he has generally pitched well this season despite working with a fastball that has averaged just 89 mph, topping 90 only a handful of times per start.
After undergoing a pair of offseason surgeries — one to repair the torn meniscus in his left knee, the other to remove a bone spur and repair a ruptured plantar plate in his left foot — Kershaw didn’t make his season debut until May 17. But aside from a start skipped just before the All-Star break, he’s taken the ball on turn, though almost always with five or six days of rest. In 102 innings, he’s pitched to a 3.53 ERA and 3.59 FIP, offsetting a career-low 17% strikeout rate by holding batters to a 4.1% barrel rate and generally avoiding the long ball. The solo homer he allowed to the Padres’ Ramón Laureano in that August 15 outing is the only one he’s served up in his last 60 1/3 innings dating back to July 2. That was the night he struck out Vinny Capra of the White Sox with the 100th and final pitch of his night — a slider on the outside edge of the plate, naturally — to give him an even 3,000 for his career.
That strikeout made Kershaw the 20th pitcher to reach 3,000 but just the fourth left-hander, after Steve Carlton, Randy Johnson, and CC Sabathia. While Kershaw was the fourth-fastest pitcher to reach the milestone in terms of innings pitched, getting there turned into quite a slog due to his injuries, which have prevented him from making 30 starts in any season since 2015 and sent him to the injured list at least once in every season since.
Kershaw finished the 2021 season, his age-33 campaign, needing just 330 strikeouts to reach 3,000, which based on his 2019–21 performances looked doable across a pair of 25-start seasons. While he pitched his way onto the NL All-Star teams in both 2022 and ’23, with ERAs of 2.28 and 2.46, he totaled just 46 starts and 274 strikeouts in that span, leaving him 56 strikeouts shy of the magic mark. With last season bracketed by his recovery from November 2023 surgery to repair the glenohumeral ligaments and capsule of his left shoulder on one side, and the aforementioned left leg surgeries on the other, he made just seven starts totaling 30 innings, with just 24 strikeouts. He was not on the active roster during the Dodgers’ run to a championship, and at the team’s victory parade in Los Angeles, he exclaimed, “I didn’t have anything to do with this championship, but it feels like I have the best feeling in the world — that I get to celebrate with you guys!”
As for what comes next for Kershaw after Friday’s start, it’s not yet clear. Barring an injury, he will almost certainly be on the postseason roster, but unlike the past two Octobers, the Dodgers are headed toward the playoffs with their best starters healthy and effective. Indeed, since the All-Star break, the Dodgers have the majors’ best rotation in terms of both ERA (3.27) and FIP (2.99); the latter mark is nearly three-quarters of a run better than that of the second-ranked Phillies (3.70). Every starter but Kershaw is missing bats galore:
| Player | GS | IP | K% | BB% | HR/9 | ERA | FIP |
|---|---|---|---|---|---|---|---|
| Yoshinobu Yamamoto | 10 | 63 1/3 | 32.0% | 8.6% | 0.57 | 2.56 | 2.55 |
| Tyler Glasnow | 10 | 59 1/3 | 29.3% | 10.3% | 0.91 | 2.88 | 3.49 |
| Emmet Sheehan | 8 | 52* | 30.3% | 8.7% | 1.21 | 3.46 | 3.51 |
| Clayton Kershaw | 10 | 51.1 | 17.1% | 7.1% | 0.18 | 3.68 | 2.93 |
| Blake Snell | 8 | 46 1/3 | 34.1% | 9.2% | 0.58 | 2.53 | 2.37 |
| Shohei Ohtani | 8 | 32 | 33.1% | 5.3% | 0.84 | 3.94 | 2.27 |
There’s no question that Glasnow, Snell, and Yamamoto will start for the Dodgers this October, and all signs point to Ohtani being the fourth. The team has kept the two-way superstar on a short leash in his first season back from his second UCL reconstruction surgery; only twice has he reached the five-inning mark or gone past 70 pitches. Though the Dodgers have considered the possibility of using Ohtani in relief à la the 2023 World Baseball Classic championship game, that prospect is complicated by the fact that removing him would cost the team its designated hitter spot — thus requiring Ohtani to play the outfield in order to remain in the game, something he hasn’t done since 2021. Manager Dave Roberts all but shut that alternative scenario down earlier this week, saying in part, “[T]o think that now it’s feasible for a guy that’s just coming off what he’s done last year, or didn’t do last year, to then now put him in a role that’s very, very unique… You potentially could be taking on risk, and we’ve come this far, certainly with the kid gloves and managing.”
As for the other two starters, Sheehan has been brilliant lately but may face an innings cap given in his first year back from Tommy John surgery. Both he and Kershaw could be used as multi-inning relievers, possibly able to go three or four innings after a starter goes five or six, which would help to mitigate a bullpen that’s been torched for a 5.43 ERA this month. “I feel that there’s a place for him on our postseason roster,” Roberts said of Kershaw on Thursday. “I don’t know what role, but I think that the bottom line is, I trust him. And so, for me, the postseason is about players you trust.”
The postseason has often been a fraught subject when it comes to Kershaw. His 4.49 ERA in October is nearly two full runs higher than his regular season mark, and his 3.81 postseason FIP nearly one run higher than his regular season one (2.85), with his home run rate almost doubling, from 0.74 to 1.39. At times he’s been let down by his offenses and his bullpens, as is the case for just about every starting pitcher given enough opportunities. At times he’s been let down by his managers; think Don Mattingly leaving him in to allow eight seventh-inning runs in the 2014 Division Series opener against the Cardinals. At times he’s been let down by his opponents’ skullduggery and his own hubris; in the wake of commissioner Rob Manfred’s investigation into the Astros’ 2017 sign-stealing scheme, Kershaw expressed regret in early 2020 that he didn’t heed warnings to change signs with a runner on second base in Game 5 of the World Series, during which he allowed six runs. And of course, at times Kershaw has been let down by his own failing body; he retired just one out of eight Diamondbacks in the Division Series opener in 2023 while pitching through the shoulder issues that led him to undergo surgery less than a month later.
While his postseason heroics never reached the level of a Gibson or a Madison Bumgarner, Kershaw has had some shining moments in October. He made a dominant pair of starts against the Braves in the 2013 Division Series, allowing one earned run in 13 innings. He came out of the bullpen on one day of rest to record a two-out save in Game 5 of the 2016 Division Series against the Nationals, after closer Kenley Jansen had thrown 2 1/3 innings; Kershaw followed that with seven shutout innings against the Cubs in Game 2 of the NLCS. He struck out 11 while allowing one run and three hits in seven innings against the Astros in the 2017 World Series opener at Dodger Stadium, where Houston’s notorious trash cans were out of reach. He spun eight shutout innings with 13 strikeouts against the Brewers in the 2020 NL Wild Card Series clincher, and authored two gutty wins in that year’s World Series against the Rays, the second of which, in Game 5, came after Tampa Bay’s bizarre walk-off win in Game 4 and set up the Dodgers’ chance to clinch.
Regarding Kershaw’s career, one other blemish can’t escape mention. Twice in the past three seasons, he has upstaged the Dodgers’ annual LGBTQ Pride Night, and it’s cost him some amount of goodwill. In 2023, he publicly pressured the Dodgers to rescind an invitation to the Sisters of Perpetual Indulgence, a drag troupe that describes itself as a “leading-edge Order of queer and trans nuns.”
The Dodgers at first heeded the calls of Kershaw and others to disinvite the Sisters, only to reverse course after they received backlash for canceling on them. But Kershaw’s comments did force the team to accelerate its announcement of its Christian Faith and Family Day, for which the pitcher served as the primary organizer. “This has nothing to do with the LGBTQ community or Pride or anything like that,” he said at the time. “This is simply a group that was making fun of a religion — that I don’t agree with.”
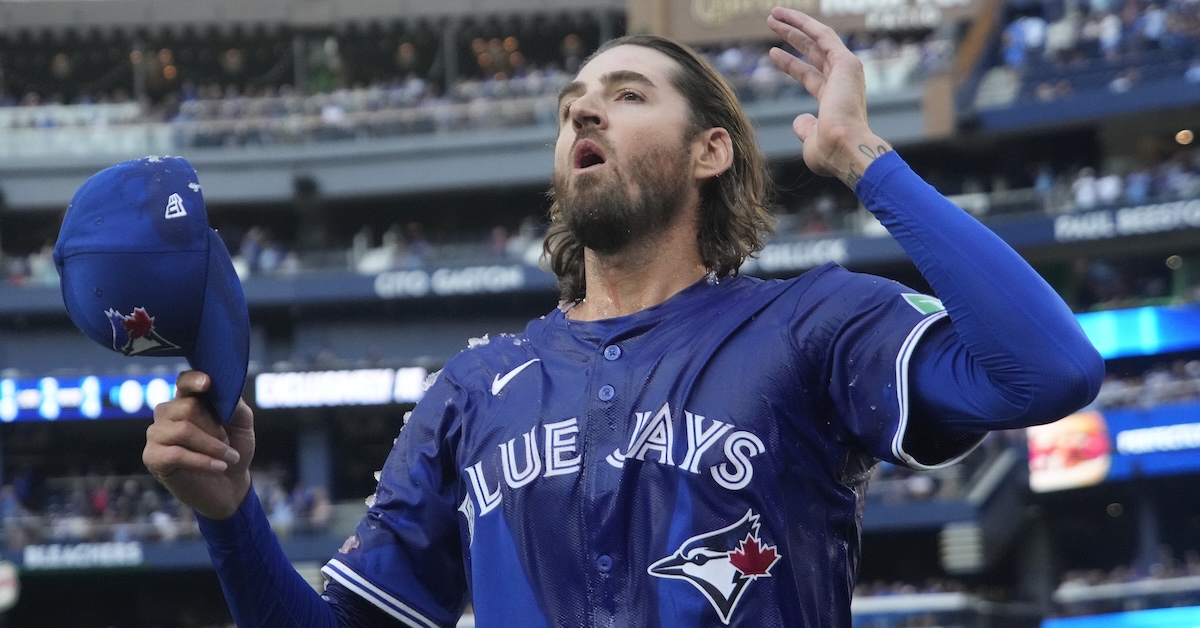
It might have been easier for some to overlook Kershaw’s reaction to the Sisters as an isolated incident had it not been for this year’s Dodgers Pride Night on June 13, when Kershaw altered his cap, which featured the team’s interlocking LA filled in with the colors of the rainbow. On it, he wrote “Gen. 9:12-16,” an Old Testament verse that, as Michael Elizondo at True Blue LA notes, has been “frequently used by homophobic Christians to denounce the LGBT community as their appropriation of the rainbow is allegedly blasphemous.” On a night meant to celebrate diversity, Kershaw instead chose a message of defiance and intolerance.
Particularly in these politically polarizing times, with LGBTQ+ rights under daily attack by the Trump administration, Kershaw’s move was divisive and disappointing, but it went unchallenged on the Dodgers beat even as the photo of him wearing the altered hat went viral. As best I can tell, he’s never publicly commented on the matter, so if a picture is worth a thousand words, he’s left that image to be his statement on the subject without offering any alternative interpretations. Three months later, the cap controversy was still being referred to on social media as news of Kershaw’s retirement announcement began to circulate.
Kershaw is not without his imperfections, his impact in the game not without complication. Inarguably, he has defined one of the most fruitful eras in Dodgers history while carving his own niche, not only as one of the best pitchers of his generation, but of all time. His public persona has been marked by his charitable foundation, Kershaw’s Challenge, which according to its web page has raised $23 million “to support at-risk children and families around the globe,” as well as his comments denouncing racial injustice in June 2020, in the wake of the murder of George Floyd. Yet it also carries with it his Pride Night remarks and protest at a moment of profound vulnerability for the LGBTQ+ community. To appreciate Kershaw’s immense legacy is to view him in his totality, the greatness, the disappointments, and everything in between, all taken together.