The latest addition to our RosterResource collection at FanGraphs is the Closer Depth Chart. While it is not quite the finished product yet — we will be adding filters and sorting capability in the near future and also welcome any feedback or suggestions you have — this version has plenty of relevant information on one page.
What information is included?
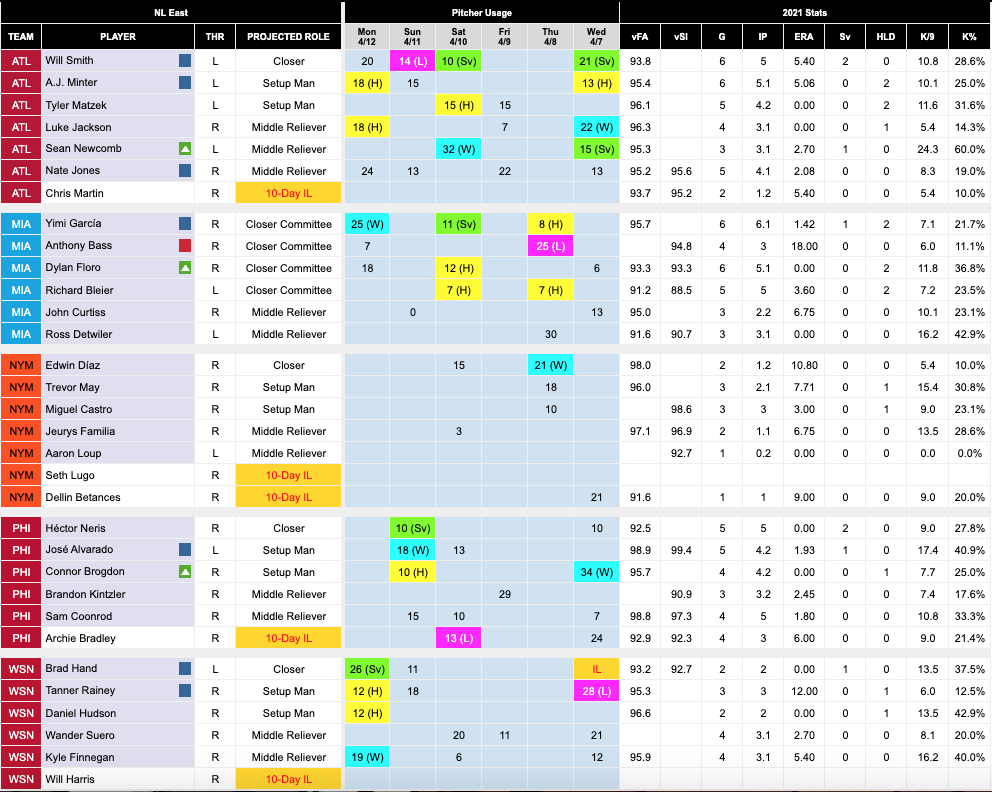
Many teams either use a closer committee or do not name a closer, leaving us to make assumptions about who their closer is. As such, there are as many as six pitchers listed for each team, as well as any notable relievers on the Injured List or Restricted List. With the information provided, we can make an educated guess about who could get a save chance on a particular day. On the report, you’ll see the following:
- THR: Left (L) or Right (R) handed.
- Projected Role: Closer, Closer Committee, Co-Closer, Setup Man, Middle Reliever, Injured List, Restricted List.
- Pitcher Usage: Last six days of usage, including pitch count, save (Sv), hold (H), blown save (BS), win (W), loss (L), Injured List (IL), Injured/Active (Inj), and Alternate Site/Minors (AAA).
- 2021 Stats: vFA (fastball velocity), vSI (sinker or cutter velocity), appearances, innings pitched, ERA, saves, holds, K/9, and K%.
- Tags (listed next to the player’s name): Unavailable (black square), High Usage Alert (blue square), On The Hot Seat (red square), Reliever On The Rise (green upward pointing arrow).
“Unavailable” means that a pitcher has officially been ruled out of pitching out of the bullpen on that day due to injury, workload, or being named as the “opener” or spot starter.
“High Usage Alert” means that a reliever is coming off a 20-plus pitch day, or pitching on at least two consecutive days or three out of four days. It doesn’t mean that a pitcher has been ruled out for that particular day.
“On The Hot Seat” means that a closer or high-profile setup man could be in danger of being demoted from their current role due to poor performance.
“Reliever On The Rise” means that a pitcher is performing at a high level and is likely moving up the bullpen hierarchy.
How often is the closer depth chart updated?
Updates on projected roles are often made in real-time while games are still in progress. Others are made after an injury or a bullpen-related comment by a manager.
Tags and bullpen usage are updated each morning before any games are played.
What Additions Will Be Made?
Filters and sorting capability are the main features we plan to add in the near future. This will allow readers to view only closers or “Relievers On The Rise,” for example, or remove all closers with a “High Usage Alert.” We will also be adding an extra column with each team’s opponent for that day.
Anything else we add or change will be a result of reader feedback and suggestions. Please use the comment section to let us know what you like or dislike about the Closer Depth Chart, and what other information you’d like to see.