Archive for Teams

Xander Bogaerts is Selectively Aggressive

When Xander Bogaerts played in the 2013 World Series as a 20-year-old rookie, it was easy to see the start of a promising career: he was a glove-first shortstop (though he played mainly third base in 2013, ceding short to Stephen Drew) with enough pop and size to eventually be an impact bat. Over the next four years of his career, though, that promise of power remained tantalizingly out of reach. At the end of 2017, Bogaerts’ career line was nearly exactly average (101 wRC+), but the extra-base hits never quite developed as projected. His .127 ISO was in the 19th percentile of batters with at least 2000 PA over that time period, and his slugging was hardly better (.409, 28th percentile).

Now, a league average bat at shortstop is still tremendously valuable. Bogaerts was worth 12.9 WAR over those four-plus years, a 3 WAR/600 PA pace that would make him a starter on virtually every team. Still, you could look at the promise of a 20-year-old Bogaerts, a 6-foot-1 live wire getting important at-bats on the biggest stage, and wonder why he hadn’t tapped into more offense. It had been four years, after all. Surely if he was going to fill out and add power, it would have already happened.

Two years later, that 2017 endpoint looks awfully conveniently timed to fit a narrative. Since the start of the 2018 season, Bogaerts has found another gear. He’s batting a scintillating .291/.366/.526, good for a 134 wRC+, and the power has miraculously appeared, with his .235 ISO ranking in the 84th percentile among qualifying batters. Still only 26, Bogaerts now looks like one of the best players in the game, full stop. The player fans and scouts saw glimpses of in 2013 is finally here.

What did Bogaerts do to tap into his enormous potential? Well, given that his power numbers have spiked across the board while his strikeout and walk numbers have barely budged (18.5% strikeouts and 7.2% walks 2013-2017 versus 18.1% and 10.2% thereafter), it would be easy to say he just started hitting the ball harder. He always looked like he had the potential to do that. A few pounds of muscle here, a little physical maturation there, a smattering of juiced baseball, and warning track power becomes home run trots. Take a look at Bogaerts’ average exit velocity from 2015 (the first year of Statcast data) to now, on all batted balls and also balls he hit in the air: Read the rest of this entry »


Max Scherzer Has Allowed More Groundballs, but Is That a Good Thing?

If you take one look at Max Scherzer’s player page, it is not hard to identify where he has improved.

Both Scherzer’s strikeout (33.4%) and walk (5.1%) rates remain excellent, as is the standard. But his FIP (2.13) — which finds itself at the top of the pitching leaderboard — has fallen by more than half a run. If the season ended today, it would represent a career-low. This FIP decrease is due to a drop in Scherzer’s home run rate. In 2018, 2.7% of plate appearances against Scherzer resulted in a home run; in 2019, that figure is 1.7%.

Contributing to Scherzer’s home run reduction appear to be two main factors: better luck and more groundballs. His 8.0% home run per fly ball rate would represent his lowest mark since joining the Nationals. Considering that we’re in an era of home runs galore, some regression there is likely expected, though the seemingly livelier ball complicates that question. But a potentially more sustainable change rests in the large increase in Scherzer’s groundball rate, which he’s seen jump from 34.3% in 2018 to 42.8% in 2019. Read the rest of this entry »


Craig Kimbrel Is No Longer a Free Agent

Eight months ago, Craig Kimbrel declared for free agency. A lot has happened since then. There were rumors in November that Kimbrel wanted a six year deal. We don’t know what happened to Kimbrel’s demands or when. We don’t know what offers were made and then rejected, or not made because of those perceived demands. We don’t know if draft pick compensation was a legitimate concern or simply an excuse for teams to hide behind. What we do know is that Craig Kimbrel is no longer a free agent. Ken Rosenthal first reported that Kimbrel had agreed to a deal with the Chicago Cubs for three years and roughly $45 million, with Jeff Passan reporting Kimbrel will make $10 million this season and $16 million in each of the following two years with a $1 million buyout on a team option for 2022.

Every team could use Craig Kimbrel. The Red Sox — whose current saves leader, Ryan Brasier, has a 5.30 FIP and ERA over four as the team has struggled to stay above .500 — wasn’t interested in bringing Kimbrel back and paying the 75% tax on his salary. The Atlanta Braves — who are in a fight for first place with a below replacement level bullpen performance that is worse than every teams outside of Miami and Baltimore and payroll flexibility coming off a division title and new taxpayer-funded stadium — opted not to get involved. The Nationals — with an MLB-worst 6.66 bullpen ERA as they try to get back into playoff contention — chose to try and stay below the competitive balance tax. The Brewers — who watched Corey Knebel go down with a season-ending injury and watched their 2018 strength turn into a liability outside of Josh Hader — sat and watched Kimbrel go to their rival. Read the rest of this entry »


Blue Jays 2018 First-Rounder Jordan Groshans Can Rake

Speed bump aside, Jordan Groshans has been hitting on all cylinders in Low-A Lansing. Currently on the shelf with a stress injury to the navicular bone of his left foot — his return is still TBD — the 12th-overall pick in last year’s draft was slashing .337/427/.482 when he went down in mid-May. Few question his ceiling. The 19-year-old shortstop is ranked fifth in a strong Blue Jays farm system.

Groshans brings more than tools to the table. According to Gil Kim, Toronto’s Director of Player Development, character and drive were major selling points for the Magnolia, Texas product when last summer’s draft rolled around.

“Area scout Brian Johnston, cross-checker C.J. Ebarb, and our amateur department as a whole did a nice job of identifying his talent,” said Kim. “They were also convicted that the strong makeup would allow him to continuously improve and to impact his teammates. That’s the part that we’re most excited about. He’s always asking questions, he’s open to feedback, and he’s always engaging in conversations with our staff about how to get better. Jordan has been fun to work with because he burns to be great.”

The youngster feels that his biggest strides have come in the plate-discipline department; the numbers back that up. His 13.5% walk rate with the Lugnuts is nearly double last year’s 7.3% in rookie-ball. Easing his foot off the gas pedal has been a key. Read the rest of this entry »


The Other Catcher Who’s Killing The Ball

Let’s play a little game. Here is a Statcast leaderboard of the Barrels per plate appearances leaders (minimum 50 batted ball events). Without looking it up, try to figure out who’s behind Gary Sanchez:

Barrels/PA% Leaders
Player Maximum Exit Velocity Average Exit Velocity Barrels/PA%
Gary Sanchez 118.3 93.3 15.6
Mystery Player 110.5 92.2 14.1
Matt Olson 110.6 89.9 12.8
Jose Abreu 113.7 92.1 12.6
Joey Gallo 113.7 96.3 12.6
Pete Alonso 118.3 90.6 12.1
Anthony Rendon 107.7 92.6 11.8
Freddie Freeman 112.0 91.0 11.6
George Springer 114.2 91.9 11.6
SOURCE: Statcast

I’ll give you a hint: he’s a catcher. Another hint: he’s on the Minnesota Twins. And no, it’s not Willians Astudillo, as much as we wish it were him. The answer is Jason Castro. Granted, Castro only has 92 plate appearances to his name this season. He also has accumulated 2,839 plate appearances over his career and, as far as Statcast has detected since 2015, he’s never hit the ball this hard. His career-high in average exit velocity was 88.6 mph back in 2015. He’s coming off a 2018 season during which he hit for an average exit velocity of 86.8 mph, his lowest in the Statcast era. In 2019? 92.6 mph. Here’s the difference between 2019 Jason Castro and his 2015-2018 self:

Jason Castro Statcast Data
Season Barrel% Exit Velocity Launch Angle xSLG xOBA Hard Hit%
2015 6.2 88.6 15.6 0.351 0.284 31.1
2016 9.7 88.5 10.8 0.399 0.301 40.1
2017 6.8 86.9 12.8 0.407 0.315 32.0
2018 5.3 86.8 8.2 0.273 0.231 31.3
2019 23.0 92.2 16.0 0.662 0.408 50.8
SOURCE: Statcast

Read the rest of this entry »


Depleted Phillies Lose McCutchen for the Season

On Tuesday, the Phillies snapped a five-game losing streak and maintained their razor-thin margin atop the NL East, but not before suffering a different kind of loss when they learned that Andrew McCutchen will miss the remainder of the season. The 32-year-old outfielder tore the anterior cruciate ligament in his left knee while trying to avoid being tagged during a rundown in the first inning of Monday’s game against the Padres. It’s a costly loss for the Phillies. Not only has McCutchen — the leadoff hitter in 59 of the team’s first 60 games — been one of the team’s most productive players, but Philadelphia’s outfield depth has been depleted by a variety of other means.

The play on which McCutchen got hurt was a strange one. After he led off the game by drawing a walk, Jean Segura popped up but lost his balance and fell to one knee in so doing. Rather than catching the ball, Padres second baseman Ian Kinsler alertly let it drop, then barehanded the ball on the first hop and threw to first baseman Eric Hosmer for the first out. That left McCutchen in no man’s land; he broke for second, then reversed towards first, threw on the brakes, then tried an ill-advised spin move to elude Hosmer. By the time he was tagged, Cutch was clutching his knee:

Rotten luck. “I didn’t feel it pop or anything,” McCutchen told reporters after the game. “Something felt uncomfortable, something that made me grab my knee and go down. I’ve had an ACL injury before and I know what that feels like. This didn’t feel like that.” Alas, the outfielder’s optimism proved to be ill-founded, as an MRI taken on Tuesday showed the tear.

Read the rest of this entry »


Powerhouse Dodgers’ Bullpen Misadventures Stand Out

Six in a row, 10 out of 11, 16 out of 19, 27 out of 35 — however you slice it, the Dodgers have been steamrolling everything in their path lately. They haven’t lost a series since dropping two of three to the Giants April 29 to May 1, and now own the NL’s best record (42-19) by a margin of 7.5 games. Their +96 run differential is nearly equal to the sum of those of the league’s second-ranked Cubs (+53) and third-ranked Diamondbacks (+46). Their offense owns the league’s highest wRC+ by a wide margin (117 to the Cubs’ 109), and their rotation owns the NL’s best ERA (2.88) and FIP (3.46) while also the most innings per start (5.89).

Which brings us to their bullpen. Sure, it hasn’t been a dumpster fire on the order of the Nationals’ (6.81 ERA, 5.08 FIP) or Orioles’ (5.84 ERA, 5.66 FIP), but there are only so many teams who can be that lucky. Through Monday, the Dodgers’ bullpen ranked 10th in the NL in ERA (4.71) and ninth in FIP (4.48). The former number doesn’t even account for the fact that the unit has allowed 43% of the runners inherited from the starters to score, the league’s second-worst mark; include all inherited runners and the rate falls to 39%, third-worst. While their relievers’ 7.6% walk rate is a league low, their 22.2% strikeout rate is the second-lowest, and their 1.37 homers per nine is mid-pack. Their clutch score — a measure of whether a player or team has done better or worse than expected in higher-leverage situations — of -2.54 is second-to-last in the NL, ahead of only the Nationals.

As you can see from those numbers above, the offense and rotation have largely papered over the bullpen’s problems. The week-long span from Sunday, May 26 through Saturday, June 1 — during which Dodger relievers combined for a 7.08 ERA and 6.64 FIP in 20.1 innings — illustrates the point in dramatic fashion:

  • Sunday, May 26 vs. Pirates: Caleb Ferguson entered with a seven-run lead and turned it into a four-run lead, though the Dodgers still won, 11-7.
  • Monday, May 27 vs. Mets: Joe Kelly entered with a five-run lead and failed to retire any of the three hitters he faced, the highlight of whom was a two-run homer by Adeny Hechavarria, the owner of a career .346 slugging percentage and a total of 29 homers compiled in eight seasons. When Kelly’s successor, Dylan Floro, got into trouble, manager Dave Roberts called upon Kenley Jansen for a five-out save, which he converted in the 9-5 win.
  • Read the rest of this entry »


Pitchers Plan, and Mike Trout Laughs

Imagine being a pitcher who has to face the Angels this year. It’s not hard to figure out which batter you most need to prepare for. When the Angels played the Cubs last night, Albert Pujols batted third, which is a lot less imposing in 2019 than it was in 2008. Shohei Ohtani had the night off, which meant that Tommy La Stella was the best non-Trout bat in the lineup. He’s having a good year, as Jay Jaffe noted, but unfortunately for him, he’s still Tommy La Stella. Cesar Puello batted fifth, and hey, good for him. Still, though — the scouting report was probably just Mike Trout written in various fonts over and over again.

It’s safe to say that every game the Angels play, the opposing team has spent a lot of time trying to work out a way to get Trout out. Los Angeles has a robust 109 wRC+ this year among non-pitchers, which sounds good until you realize that non-Trout Angels have a 100 wRC+. The team is scuffling — two games below .500 in a division where you might need 100 wins to topple the Astros, and potentially a little lucky to be there given their BaseRuns record. The pitching staff is essentially made of duct tape and fervent prayers — Ty Buttrey leads the staff in both fWAR and RA/9 WAR, and their starting rotation looks like a horror story told to kids to keep them from becoming Angels fans.

Amidst this chaos, this unending deluge of mediocrity, Mike Trout is putting together another masterpiece of a season. It’s boring to say, almost — his 180 wRC+ is both the fourth-highest in baseball and the lowest Trout has recorded in the last three years. Being one of the best players in baseball is old hat for him. Still, he’s improving his craft incrementally, slowly shoring up weaknesses and adding to strengths. His unintentional walk rate, a gaudy 19%, is the highest of his career. His strikeout rate, a minuscule 16%, has never been lower. Trout’s 2019 might be the best he’s ever hit, a crazy thing to say about undoubtedly the best player in baseball.

Baseball is largely a game of failure and limitations, which makes talking about Trout’s plate discipline feel somewhat surreal. Consider this — Trout has started making contact with basically everything he swings at in the strike zone. His zone contact rate of 94.9% is sixth in baseball and the highest of his career. That’s strange, because for the most part, guys who make contact with everything are contact hitters who sacrifice power to put the ball in play. David Fletcher and his .137 ISO top the list.

This makes a rough kind of sense — hitting everything you swing at in the strike zone means you are probably putting some tough pitches in play, and cutting down on your swing to make more contact means those swings generally have less behind them. That, at least, is the logic that constrains mortals. Mike Trout started hitting everything in the strike zone, and he’s still slugging .600. That slugging percentage might be selling Trout short — he has the highest xSLG (a Baseball Savant statistic that predicts slugging percentage from angle and speed of hits) of his career, a gaudy .643.

What does making contact with every pitch in the strike zone look like? Well, in 2018, Trout was great, but he was great while being only very good against high and outside pitches. Take a look at the upper righthand corner of this chart, the percentage of swings he made contact on by zone in 2018:
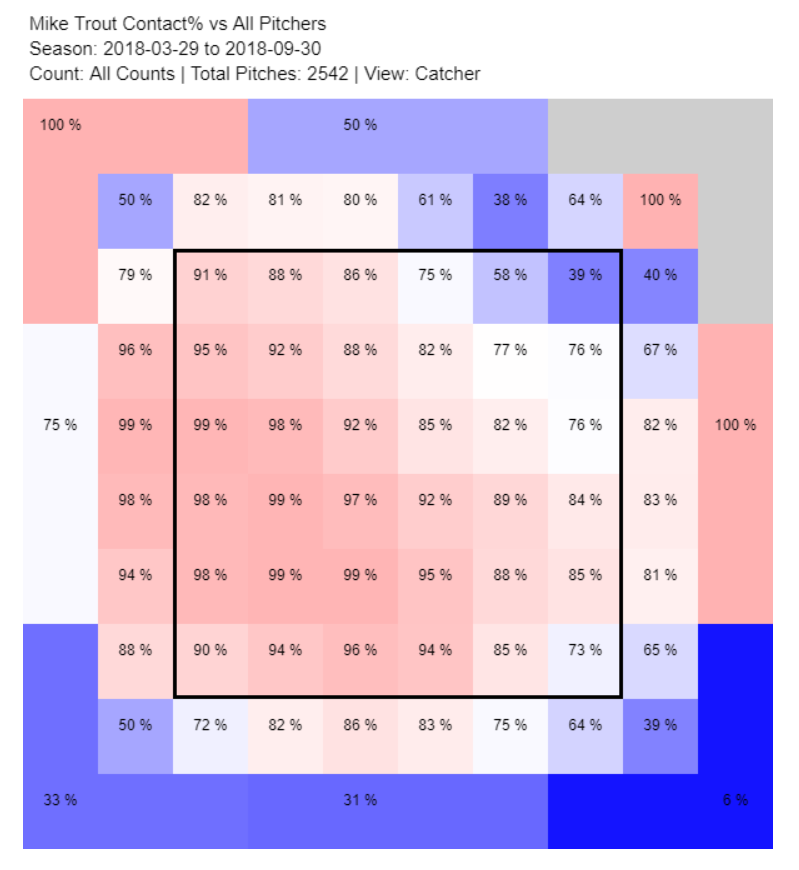
Pitchers know about this marginal weakness, and they do their best to exploit it. The book on Trout is to get him high and away. Take a look at where pitchers are attacking him in 2019:
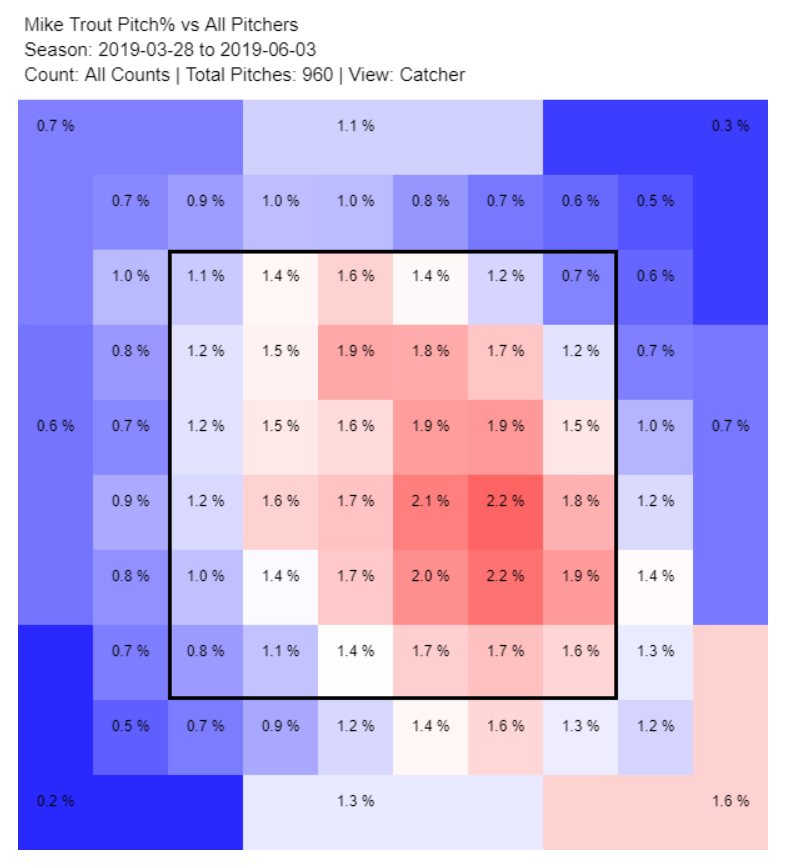
That’s good pitching right there. Find out where a hitter is most likely to get bad results, and aim for that spot. Maybe their focal point is a little too low, but the general idea of throwing away is certainly easy to see. Major league pitchers are tremendously skilled, and they spend countless hours perfecting their craft. That should work out to their advantage, right? Well, bad news, pitchers — this is Mike Trout we’re talking about here. Look at his contact rate in 2019:
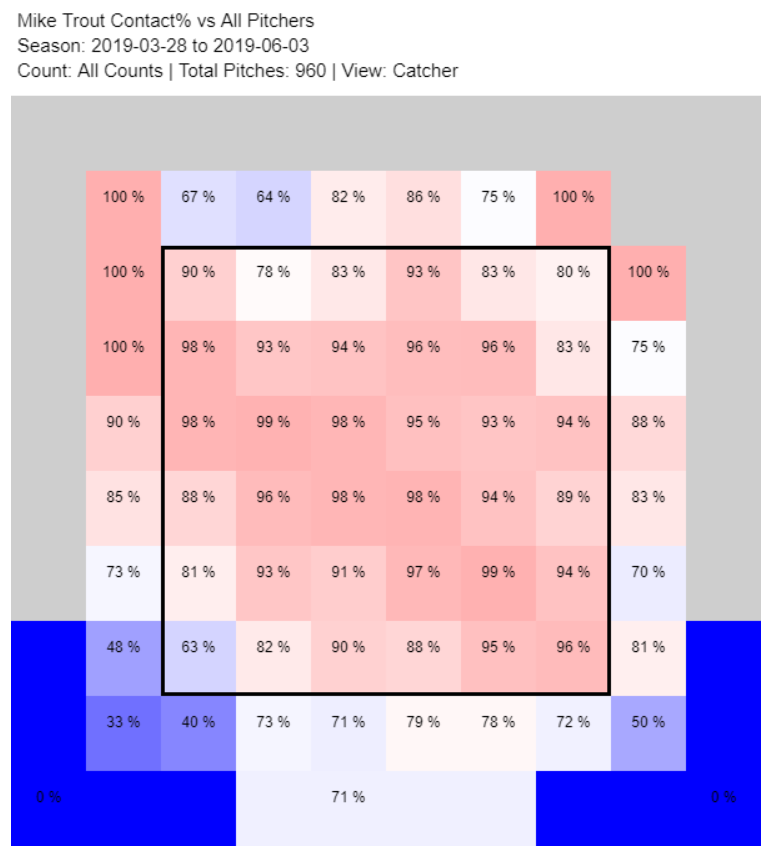
It would be one thing to protect a weak point in your swing with some defensive hacks. Plenty of good hitters punch outside pitches the other way, sacrificing power for contact on pitches that are hard to drive. Again, though, Mike Trout isn’t “plenty of good hitters.” He’s the best hitter in baseball. Trout is punishing outside and high pitches in 2019, doing a tremendous amount of damage when he puts the ball in play:
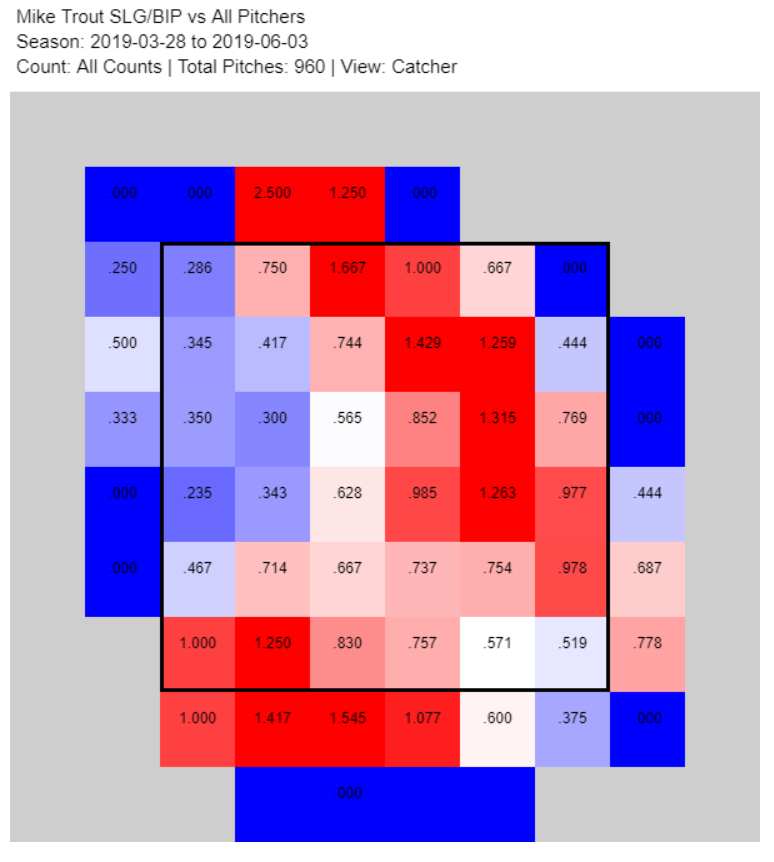
You’re reading this chart right — Trout is now getting his greatest production on balls in play in the very part of the strike zone where pitchers are attacking him most. That, in a nutshell, is what pitching to Trout is like. You might think you’re attacking a weakness, doing your research to put yourself in an advantageous position. Trout’s better at adapting than you are; he’s better than everyone. He reacts to your changes faster than he can be solved.

Pitch location isn’t the only part of Trout’s plate discipline pitchers have focused on this year. They’ve changed how they attack him on the first pitch of a plate appearance, and Trout is yet again using that to his advantage. For years, the book on Trout was that he was patient on the first pitch to the point of somnolence; he basically never swung at first-pitch breaking balls, for instance. Over the past few years, Trout has turned this trend around, becoming increasingly aggressive on the first pitch — he swung at 19.7% of first pitches in 2017 and 18.3% in 2018, the two highest rates of his career.

To combat this trend, pitchers are going out of the zone on first pitches more than they ever have. Trout is seeing strikes on 47% of first pitches, down from his career average of 55% and below the major league average of 51%. This adjustment was largely out of self-preservation. Trout slugged 1.061 with a .485 batting average when he put the first pitch into play last year. He hit five home runs on first pitches, a career high. Sticking with get-me-over first pitch fastballs was no longer an option.

In classic Trout fashion, though, he’s turned pitchers’ adjustments into another tool in his tool belt. Now that pitchers throw him fewer first-pitch strikes, he’s simply swinging less. He’s down to a 17% swing rate on first pitches this year while still swinging at 27% of pitches in the zone. He’s also missing less — he’s swung and missed at five first pitches this year, a 2% rate that would be his lowest since 2015, the last year of his extreme passivity on first pitches. Between this improved swing discipline and pitchers avoiding the zone like the plague, Trout is falling behind in the count 52.9% of the time this year, a career low and 5.2% below last year’s level.

2019 is arguably Mike Trout’s finest batting season so far. His xwOBA of .473 is the highest it’s ever been and 30 points higher than his wOBA, suggesting that he’s been unlucky this year to put up “only” a 180 wRC+, the third-highest of his career. He has the highest walk rate in baseball and a strikeout rate in the lowest 21% of qualified batters. He’s getting on base at the highest rate in his career despite the lowest BABIP in his career (excluding his brief 2011). The two changes pitchers have made to how they approach him this year sure don’t seem to have worked.

Pitchers will try to make other adjustments. They’ll start challenging him in the strike zone more on the first pitch — maybe with offspeed pitches, something that pitchers mostly haven’t tried yet. They’ll aim inside, where Trout’s power is down this year. They’ll continue to hunt holes in his game, small edges that they can use to blunt Trout’s effectiveness.

But until I see some evidence to the contrary, I don’t think it will matter. Pitchers can adjust all they want, try any gambit they’d like. For the most part, it seems like adjusting to beat Trout only plays into his hands. Someday, Mike Trout will grow old. He’ll slow down, get worse at recognizing pitches, stop instilling terror into opposing pitchers the way he does now. That day still feels infinitely far off, though. For now, he’s three steps ahead, putting up unreal numbers while shrugging off regression. Pitchers can plan all they want. Trout won’t stop laughing his way around the bases any time soon.


Regression Didn’t Come for Kyle Freeland

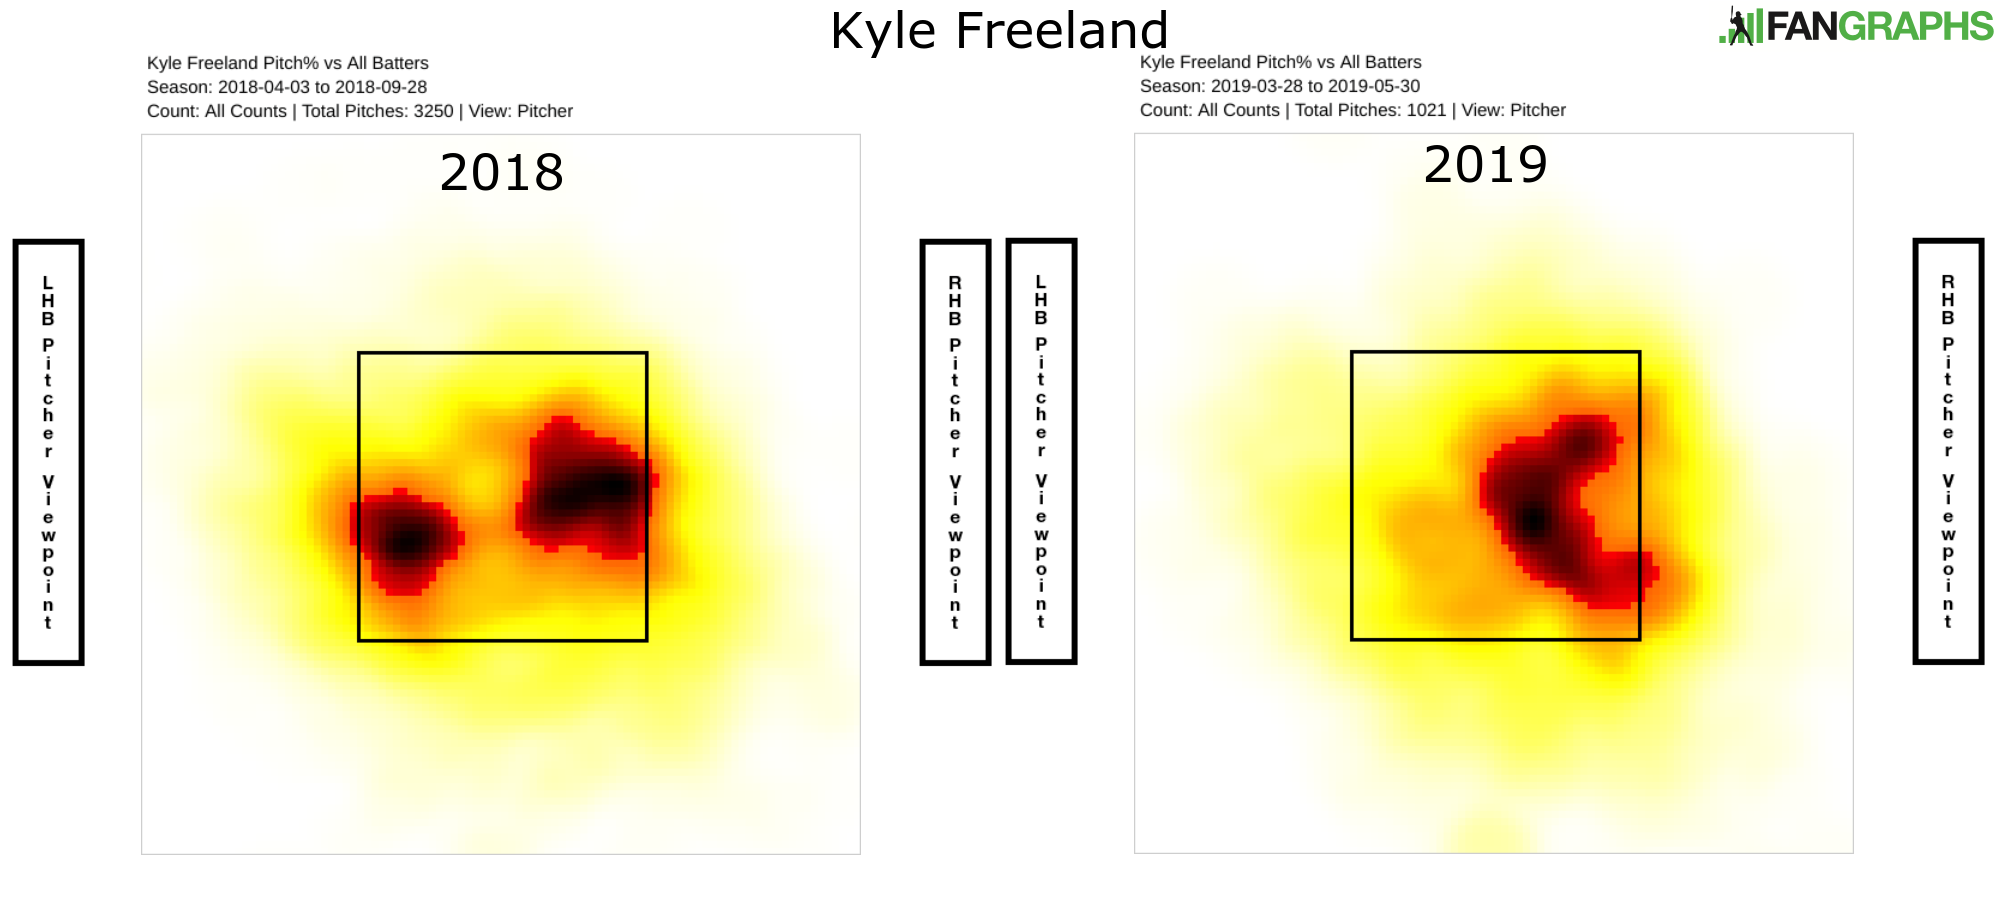
A year ago, Kyle Freeland had a very good season. For some, it was almost too good. Here at FanGraphs, Freeland put up a 3.67 FIP, and playing half his games in Colorado meant a 4.2 WAR in over 200 innings and one of the 10 best pitching seasons in the National League. Freeland’s ERA was even better than his FIP, and with a 2.85 mark, his RA/9WAR was 7.5, the fifth-best mark in all of baseball. The distance between his ERA and FIP likely created a gap between those who believed Freeland was one of the best pitchers in baseball and merely a good one. The latter group thought that Freeland was in for some regression this year. After a rough two months, including time on the injured list, Freeland has been dispatched to the minors. That’s not regression. Allow me to explain.

Before being sent down, Freeland had a 6.37 FIP, a 7.13 ERA, and had given up 16 homers in 12 starts after giving up 17 in all of 2018. After last season, it’s possible some were expecting another sub-three ERA, but doing so would have been unrealistic. Expecting some regression might have meant that Freeland’s BABIP would go up from the .285 where it was a year ago and his LOB% would go down from 83%. Those numbers wouldn’t affect his 3.67 FIP, but it might take his ERA closer to his FIP. Maybe Freeland’s 8.5% HR/FB would creep up closer to average, leading to a higher FIP and ERA. In fact, projections considered many of those factors and forecast Freeland for a roughly average season with an ERA and FIP around 4.50. If regression had come for Kyle Freeland, that might have been what it looked like. If Freeland were pitching just like last season, we might expect a similar FIP and worse ERA. The problem is that Freeland isn’t pitching like he did last season. This isn’t regression (or reversion). This is Kyle Freeland being not as good of a pitcher as he was a year ago.

Freeland is a command lefty who excelled last season by pitching to his spots. In late 2018, Jeff Sullivan wrote about how good Freeland’s command had been all season, using multiple heat maps. We’ll engage in a similar exercise below, showing Freeland last year and this year. First, here are all of his pitches in 2019 compared to all of his pitches last season:

Read the rest of this entry »


Alex Cobb, Ryan O’Rourke, and Carl Willis on How They Settled on Their Splitters

Pitchers learn and develop different pitches, and they do so at varying stages of their lives. It might be a curveball in high school, a cutter in college, or a changeup in A-ball. Sometimes the addition or refinement is a natural progression — graduating from Pitching 101 to advanced course work — and often it’s a matter of necessity. In order to get hitters out as the quality of competition improves, a pitcher needs to optimize his repertoire.

In this installment of the series, we’ll hear from three pitchers — Alex Cobb, Ryan O’Rourke, and Carl Willis — on how they learned and developed their splitters.

———

Alex Cobb, Baltimore Orioles

“I started throwing it in high school. When you’re that age, you’ll see things on TV and try to replicate them — kind of like Backyard Baseball. I thought a splitter sounded cool, so I split my fingers on the baseball, got some action on it, and got some good results with it. Read the rest of this entry »