Archive for Teams

Curtis Granderson Revisits a 2007 Interview

When I interviewed him for Baseball Prospectus in March 2007, Curtis Granderson was a young outfielder coming off a promising first full season with the Detroit Tigers. He’s since made three All-Star teams, bashed 332 home runs, and accumulated 48.7 WAR. Still active at age 37, Granderson has had a very good career.

How much has his approach — and the game itself — changed since our bygone spring training conversation? Wanting to find out, I approached Granderson with an idea this past summer: what if I were to ask him the exact same set of questions I did more than 11 seasons ago?

Granderson was amenable. Standing by his locker, I pulled a copy of the old interview out of my back pocket and proceeded to revisit the past.

———

Q: Cutting down on your strikeouts has been a main focus for you this spring. What adjustments are you making?

Granderson: “I think we’re all facing that in today’s game. Strikeouts are at an all-time high. Part of it is the talent that pitchers have now. Speaking 11 years later, they throw harder. Guys have more movement. Guys are bigger, more physical, and there are more of them doing different things — they have different pitches.

“It’s a constant battle to keep your strikeouts down. How to do that? Hopefully not getting yourself in too many two-strike counts. There really isn’t too much more you can do, except that when you do get to two strikes, just continue to battle. Fight.” Read the rest of this entry »


Twins, Angels Swap Very Different Fringe Prospects

There was a minor trade on Tuesday night as the Angels acquired recently DFA’d righty John Curtiss from Minnesota for 18-year-old Dominican infielder Daniel Ozoria.

The Curtiss addition is the latest of many examples of relief pitcher diffusion happening on the fringe of the Angels 40-man roster. Since November, the Angels have been part of eleven transactions involving relief pitchers, either via trade, waiver claim, or DFA. The likes of Austin Brice, Parker Bridwell, Luke Farrell, and Dillon Peters have been on and off the roster, sometimes more than once (Bridwell, who was DFA’d for Curtiss, has now been DFA’d three times since this offseason), as the Angels try to patch holes in their bullpen for free.

Curtiss, who is 25, has thrown an unsatisfying handful of innings during each of the last two seasons, totaling 15 big league frames. He throws hard, 92-96 with the occasional 7 or 8, and can really spin a power, mid-80s slider (he averaged 2600 rpm in 2018). His command backpedaled last season and is the biggest thing standing between Curtiss and a steady middle relief gig. Perhaps the change of scenery will be good for him.

Ozoria spent his second professional season as a 17-year-old in the AZL, and at times he looked like he could have used a second pass at the DSL. Listed at 5-foot-9, 135 pounds, Ozoria struggled with the pace and comparably mature athletes of Arizona. He does have interesting tools, though, and played hard throughout a tough summer on a team that was really struggling. He’s an above-average runner and athlete. Though not a polished, instinctive defender, he has good range and hands, and enough arm for the left side of the infield.

Because Ozoria so lacks present strength, he needs to take max-effort, full-body hacks just to swing the bat hard, and sometimes things can get out of control. His swing also has some length, but I’m not sure it matters as much for hitters this size, because their levers aren’t. Much of Ozoria’s offensive potential just depends on how much growing he has left to do. He’s small enough that I believe that were he a high school prospect, scouts would rather he go to college to get a better idea of how his body might mature than sign him now. The realistic upside is probably a utility infielder, and even that depends on significant growth that may not materialize, but Ozoria is so uncommonly young for a pro prospect that it’s fair to like the things he can already do and project heavily on the stuff he can’t. He will likely spend all of 2019 in Fort Myers and is probably four or five years away from the big leagues.


2019 ZiPS Projections – Kansas City Royals

After having typically appeared in the hallowed pages of Baseball Think Factory, Dan Szymborski’s ZiPS projections have now been released at FanGraphs for more than half a decade. The exercise continues this offseason. Below are the projections for the Kansas City Royals.

Batters

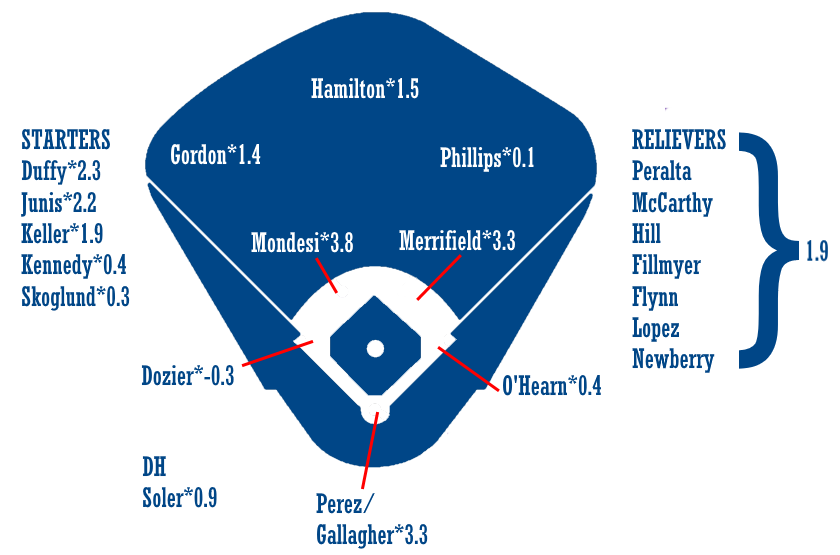
The Royals have an extremely bifurcated offense, with three players projected to be solidly above league-average in Adalberto Mondesi, Salvador Perez, and Whit Merrifield, and a fairly large gulf before the next tier of KC hitters. If the Royals were really going the full rebuild route, you’d see Perez and Merrifield — entering their age-29 and -30 seasons respectively — on other teams’ lists, but the Royals seem content to go the “sorta” rebuild route.

Given how thin their talent is, it’s hard to see them having much success going this route and as such, Perez and Merrifield are likely to be either in their declines or in other organizations by the time the performance matters. Winning 72 games instead of 64 in 2019 isn’t going to jumpstart anything.

I’m sure there will be some gnashed teeth about O’Hearn’s projection, given that he hit .262/.353/.597 in the majors in 170 plate appearances in 2018. He also had a .713 OPS in 406 PA in the Pacific Coast League, which is abysmal for an offensive prospect.

Pitchers

This group won’t be as bad as some people think in 2019, and it wouldn’t take a lot of breaks for the team to achieve their pointless Quest for 75 Wins, which is a little like bragging to your drinking buddies that you can deadlift 125 pounds. Danny Duffy isn’t a lost cause and Brad Keller was good enough in 2018 that it couldn’t all have been a fluke. ZiPS absolutely loves Richard Lovelady, but the rest of the bullpen is a big digital yawn. The Trevor Oaks projection isn’t exactly impressive, but I can’t remember the last time ZiPS didn’t actually hate a pitcher with as low a strikeout rate as he is projected to have.

Bench and Prospects

Troubling and not seen in full here is that ZiPS simply projects very few of the hitting prospects in the upper levels of the organization as good bets to be relevant by the time the Royals are good again. It’s essentially Adalberto Mondesi and Nicky Lopez. Khalil Lee and Emmanuel Rivera are the only two other offensive prospects on this list for whom ZiPS gives even an over/under of three WAR over their major league careers. Now, it’s not quite as bad as that considering a couple of the names I’m not yet projecting are Seuly Matias and Nick Pratto, but it’s certainly less than ideal for a team that really ought to be 2 1/2 years into a rebuild by now.

One pedantic note for 2019: for the WAR graphic, I’m using FanGraphs’ depth chart playing time, not the playing time ZiPS spits out, so there will be occasional differences in WAR totals.

Ballpark graphic courtesy Eephus League. Depth charts constructed by way of those listed here at site.

Batters – Counting Stats
Player B Age PO G AB R H 2B 3B HR RBI BB SO SB CS
Whit Merrifield R 30 2B 153 614 81 172 36 4 13 61 44 108 35 9
Adalberto Mondesi B 23 SS 118 437 62 114 22 6 18 58 20 118 39 7
Salvador Perez R 29 C 136 513 55 130 26 1 24 77 18 104 1 1
Nicky Lopez L 24 SS 127 511 60 133 15 5 6 40 43 61 12 6
Billy Hamilton R 28 CF 139 500 74 121 18 7 4 27 42 117 45 10
Alex Gordon L 35 LF 128 443 50 102 19 1 11 44 47 120 9 2
Xavier Fernandez R 23 C 88 318 34 79 17 1 6 30 18 56 3 3
Jorge Soler R 27 RF 90 307 38 76 15 0 13 37 40 107 3 1
Meibrys Viloria L 22 C 113 409 41 91 19 1 7 38 27 104 2 2
Emmanuel Rivera R 23 3B 120 466 50 120 23 5 7 49 23 92 3 6
Ryan O’Hearn L 25 1B 144 509 64 115 29 3 20 67 57 152 2 0
Jecksson Flores R 25 2B 126 460 47 110 22 3 5 37 22 92 16 6
Cheslor Cuthbert R 26 3B 109 377 41 91 18 1 11 40 30 84 1 1
Brian Goodwin L 28 CF 107 340 41 76 17 1 11 40 30 112 9 3
Cam Gallagher R 26 C 97 329 33 74 14 0 5 31 24 54 1 0
Donnie Dewees L 25 CF 132 518 54 119 22 7 7 45 30 111 15 6
Frank Schwindel R 27 1B 136 524 58 134 32 1 17 65 19 92 1 2
Jorge Bonifacio R 26 RF 110 401 51 93 19 2 12 43 38 124 1 1
Brett Phillips L 25 RF 124 439 52 88 15 6 12 46 43 186 10 3
Kelvin Gutierrez R 24 3B 118 460 48 107 16 5 7 39 28 125 12 4
Chris Owings R 27 SS 125 419 49 101 23 4 7 40 24 104 15 5
Kort Peterson L 25 RF 101 365 41 82 19 3 9 39 20 129 7 4
Nick Dini R 25 C 90 317 33 73 14 0 6 28 13 68 6 1
Bubba Starling R 26 CF 86 306 32 61 16 1 7 27 20 106 5 3
Hunter Dozier R 27 3B 135 499 58 113 29 2 15 51 41 160 4 3
Khalil Lee L 21 CF 113 426 51 90 19 4 10 43 46 164 14 13
Erick Mejia B 24 2B 134 530 57 123 22 6 5 42 35 128 22 12
Alex Liddi R 30 1B 107 406 48 89 19 3 17 53 25 146 5 2
Blake Perkins R 22 CF 131 514 63 104 21 2 5 33 64 162 20 11
Chris Owings R 27 RF 123 412 48 99 22 4 7 39 24 103 14 4
Brewer Hicklen R 23 LF 100 384 43 79 16 2 11 39 20 150 21 7
Corey Toups R 26 3B 103 374 42 76 17 2 7 31 33 140 12 3
Humberto Arteaga R 25 3B 125 465 41 108 15 2 4 32 16 88 5 6
Jack Lopez R 26 2B 110 399 38 86 11 2 7 30 15 113 11 6
Taylor Featherston R 29 2B 108 337 36 64 12 3 7 31 23 129 8 2
Ramon Torres B 26 2B 113 431 44 103 17 2 4 31 20 69 10 6
Sebastian Rivero R 20 C 76 287 27 62 12 0 5 24 11 77 0 1
Samir Duenez L 23 1B 112 429 49 98 20 2 12 50 32 113 6 1
Anderson Miller L 25 LF 115 437 43 97 18 3 8 39 27 120 9 5
MJ Melendez L 20 C 106 410 41 76 17 4 13 46 32 184 4 7
Parker Morin L 27 C 58 179 16 35 7 1 2 13 9 49 1 0
D.J. Burt R 23 2B 113 434 47 92 15 5 3 32 43 121 21 11
Terrance Gore R 28 CF 94 216 24 43 3 1 0 9 16 61 26 5
Nick Heath L 25 CF 84 303 30 59 8 2 2 18 27 112 22 9
Manny Olloque R 23 3B 92 332 32 69 14 2 6 30 15 121 4 4
Elier Hernandez R 24 RF 126 481 43 103 23 3 4 38 21 132 6 7

Batters – Rate Stats
Player BA OBP SLG OPS+ ISO BABIP RC/27 Def WAR No. 1 Comp
Whit Merrifield .280 .331 .415 105 .135 .323 5.5 6 3.4 Gene Alley
Adalberto Mondesi .261 .295 .462 105 .201 .319 5.6 2 2.7 Cristian Guzman
Salvador Perez .253 .289 .448 100 .195 .275 4.7 6 2.6 Ramon Hernandez
Nicky Lopez .260 .321 .344 85 .084 .286 4.0 4 1.5 Jeff Huson
Billy Hamilton .242 .300 .330 75 .088 .309 4.1 9 1.4 Freddy Guzman
Alex Gordon .230 .317 .352 85 .122 .292 4.0 10 1.1 Derek Bell
Xavier Fernandez .248 .291 .365 80 .116 .285 3.7 2 0.6 Richard Suomi
Jorge Soler .248 .340 .423 110 .176 .337 5.2 -5 0.6 Jeremy Giambi
Meibrys Viloria .222 .277 .325 66 .103 .282 3.1 6 0.5 John Mizerock
Emmanuel Rivera .258 .296 .373 84 .116 .308 3.8 2 0.5 Greg LaRocca
Ryan O’Hearn .226 .307 .413 97 .187 .282 4.5 -2 0.4 Eric Valent
Jecksson Flores .239 .279 .333 68 .093 .289 3.4 7 0.4 Kenny Perez
Cheslor Cuthbert .241 .299 .382 87 .141 .284 4.0 -3 0.3 Bobby Holley
Brian Goodwin .224 .288 .376 82 .153 .300 3.9 -1 0.3 Orsino Hill
Cam Gallagher .225 .279 .313 64 .088 .256 3.1 4 0.3 Drew Butera
Donnie Dewees .230 .276 .340 69 .110 .280 3.3 5 0.2 Joe Mathis
Frank Schwindel .256 .286 .418 91 .162 .282 4.3 1 0.1 Leo Hernandez
Jorge Bonifacio .232 .302 .379 87 .147 .306 4.0 0 0.1 Bill McCarthy
Brett Phillips .200 .275 .344 70 .144 .315 3.3 10 0.1 Brad Snyder
Kelvin Gutierrez .233 .279 .335 69 .102 .305 3.4 4 0.0 Edwin Rodriguez
Chris Owings .241 .283 .365 78 .124 .305 3.8 -5 -0.1 Thomas Manzella
Kort Peterson .225 .285 .367 79 .142 .322 3.6 3 -0.1 Brian Brady
Nick Dini .230 .274 .331 67 .101 .276 3.3 -2 -0.1 Omir Santos
Bubba Starling .199 .255 .327 59 .127 .280 2.8 4 -0.2 John Giudice
Hunter Dozier .226 .285 .383 83 .156 .302 3.8 -7 -0.2 Rey Palacios
Khalil Lee .211 .298 .345 78 .134 .317 3.2 -4 -0.3 Mel Hall
Erick Mejia .232 .281 .325 67 .092 .297 3.2 2 -0.4 Ramon Caraballo
Alex Liddi .219 .267 .406 82 .187 .296 3.8 0 -0.4 John Cotton
Blake Perkins .202 .294 .280 60 .078 .285 2.7 3 -0.6 Tony Miller
Chris Owings .240 .283 .364 78 .124 .305 3.8 -1 -0.6 Drew Anderson
Brewer Hicklen .206 .261 .344 66 .138 .305 3.2 3 -0.6 Wilkin Ramirez
Corey Toups .203 .275 .316 63 .112 .304 3.1 -2 -0.6 Sean Berry
Humberto Arteaga .232 .259 .299 54 .067 .279 2.6 9 -0.6 Jim Scranton
Jack Lopez .216 .250 .306 53 .090 .283 2.6 5 -0.7 Wade Robinson
Taylor Featherston .190 .251 .306 53 .116 .284 2.7 2 -0.7 Chris Petersen
Ramon Torres .239 .273 .316 63 .077 .277 3.0 1 -0.7 Dave Myers
Sebastian Rivero .216 .245 .310 52 .094 .278 2.5 -1 -0.7 Kurt Brown
Samir Duenez .228 .281 .368 78 .140 .283 3.7 -1 -0.8 Alex Hernandez
Anderson Miller .222 .269 .332 65 .110 .288 3.1 4 -0.9 Jonathan Johnson
MJ Melendez .185 .249 .341 61 .156 .296 2.6 -3 -0.9 Brandon Yarbrough
Parker Morin .196 .240 .279 43 .084 .258 2.3 -3 -1.0 Dave Ullery
D.J. Burt .212 .284 .290 60 .078 .287 2.8 -2 -1.1 Adam Davis
Terrance Gore .199 .264 .222 37 .023 .277 2.7 -4 -1.1 Craig Griffey
Nick Heath .195 .261 .254 44 .059 .302 2.4 0 -1.2 Jeff Conger
Manny Olloque .208 .245 .316 54 .108 .307 2.5 -2 -1.3 Mario Ramirez
Elier Hernandez .214 .254 .299 53 .085 .287 2.4 2 -2.1 Rick Bernardo

Pitchers – Counting Stats
Player T Age W L ERA G GS IP H ER HR BB SO
Jake Junis R 26 10 10 4.37 29 28 164.7 172 80 26 38 143
Brad Keller R 23 9 9 4.20 43 24 156.3 168 73 15 46 97
Danny Duffy L 30 10 9 4.37 26 26 148.3 151 72 19 51 129
Trevor Oaks R 26 9 9 4.41 25 24 136.7 158 67 13 38 72
Ben Lively R 27 7 8 4.35 25 21 120.0 128 58 14 38 88
Richard Lovelady L 23 4 3 3.52 54 0 71.7 68 28 4 26 59
Jesse Hahn R 29 5 5 4.52 18 17 87.7 92 44 8 38 60
Glenn Sparkman R 27 6 7 4.79 29 19 118.3 139 63 17 27 70
Sam McWilliams R 23 6 8 4.74 23 20 108.3 123 57 12 42 71
Arnaldo Hernandez R 23 7 8 4.95 26 22 120.0 137 66 16 41 69
Nate Karns R 31 3 3 4.57 14 12 69.0 69 35 10 29 65
Jonathan Dziedzic L 28 7 8 4.98 22 22 115.7 132 64 14 44 66
Jason Hammel R 36 7 9 4.83 30 20 123.0 140 66 18 35 91
Heath Fillmyer R 25 6 8 5.09 28 26 138.0 152 78 18 58 85
Brian Flynn L 29 4 4 4.19 42 1 68.7 72 32 6 27 44
Pedro Fernandez R 25 4 4 4.52 33 4 65.7 70 33 6 29 41
Ian Kennedy R 34 7 9 4.99 24 24 128.0 132 71 24 44 106
Jake Kalish L 27 4 5 4.93 30 11 95.0 108 52 12 31 57
Gabe Speier L 24 1 1 4.39 45 1 65.7 71 32 4 28 37
Jake Newberry R 24 4 4 4.33 56 0 62.3 63 30 6 29 46
Tim Hill L 29 2 2 4.33 57 0 54.0 55 26 6 21 45
Wily Peralta R 30 4 5 4.82 40 11 89.7 96 48 11 44 75
Jason Adam R 27 3 3 4.35 46 0 51.7 47 25 7 27 56
Kevin McCarthy R 27 4 5 4.56 64 0 73.0 81 37 9 24 44
Foster Griffin L 23 9 12 5.31 27 26 142.3 168 84 22 52 84
Eric Skoglund L 26 4 6 5.24 21 20 99.7 114 58 17 30 68
Josh Staumont R 25 5 7 5.18 35 14 92.0 84 53 9 80 97
Kyle Zimmer R 27 1 1 4.94 11 4 31.0 32 17 4 16 27
Kevin Lenik R 27 1 1 4.66 31 0 46.3 47 24 4 26 36
Sam Selman L 28 3 3 4.73 37 0 45.7 40 24 4 38 49
Jorge Lopez R 26 6 8 5.11 37 13 98.7 107 56 14 42 77
Scott Barlow R 25 5 8 5.31 25 25 120.3 124 71 20 68 118
Seth Maness R 30 2 2 4.64 33 0 42.7 51 22 6 8 23
Enny Romero L 28 2 3 4.91 44 0 44.0 45 24 6 22 41
Conner Greene R 24 5 6 5.40 36 15 95.0 100 57 6 80 61
Zach Lovvorn R 25 6 9 5.50 27 22 126.0 153 77 17 50 62
Walker Sheller R 24 3 4 5.01 40 0 55.7 63 31 6 25 30
Scott Blewett R 23 6 8 5.55 25 25 136.3 161 84 19 58 73
Michael Ynoa R 27 1 1 5.13 27 0 33.3 34 19 3 22 25
Grant Gavin R 23 1 2 5.05 36 0 51.7 52 29 6 32 46
Yunior Marte R 24 4 4 5.01 42 0 73.7 75 41 8 44 58
Brandon Maurer R 28 4 4 4.91 60 0 58.7 62 32 7 28 49
Blaine Boyer R 37 2 2 5.18 35 0 41.7 47 24 5 18 27
Chris Ellis R 26 4 7 5.62 20 15 81.7 92 51 14 41 64
Burch Smith R 29 3 4 5.58 32 7 69.3 74 43 11 38 60
Kyle Lohse R 40 5 9 5.62 23 18 112.0 132 70 21 35 67
Andres Machado R 26 4 6 5.82 33 13 85.0 100 55 14 40 56
Ofreidy Gomez R 23 6 10 5.82 27 21 123.7 148 80 18 65 67
Gerson Garabito R 23 5 8 6.12 24 24 114.7 131 78 19 72 70

Pitchers – Rate Stats
Player TBF K/9 BB/9 HR/9 BABIP ERA+ ERA- FIP WAR No. 1 Comp
Jake Junis 704 7.82 2.08 1.42 .301 98 102 4.38 2.0 Ed Lynch
Brad Keller 675 5.58 2.65 0.86 .299 99 101 4.14 1.9 Lindy McDaniel
Danny Duffy 642 7.83 3.09 1.15 .302 98 102 4.23 1.8 Kent Mercker
Trevor Oaks 602 4.74 2.50 0.86 .307 94 106 4.32 1.4 Jack Russell
Ben Lively 524 6.60 2.85 1.05 .302 96 104 4.33 1.3 Howie Fox
Richard Lovelady 308 7.41 3.27 0.50 .298 122 82 3.48 1.1 Pat Clements
Jesse Hahn 390 6.16 3.90 0.82 .300 95 105 4.40 0.9 Don Schwall
Glenn Sparkman 517 5.32 2.05 1.29 .307 90 111 4.67 0.9 John Doherty
Sam McWilliams 488 5.90 3.49 1.00 .312 88 114 4.64 0.8 Mark Cahill
Arnaldo Hernandez 535 5.18 3.08 1.20 .301 87 115 4.93 0.7 Michael Macdonald
Nate Karns 302 8.48 3.78 1.30 .301 94 106 4.50 0.7 Ryan Glynn
Jonathan Dziedzic 519 5.14 3.42 1.09 .303 86 116 4.88 0.7 Jimmy Anderson
Jason Hammel 540 6.66 2.56 1.32 .312 86 116 4.55 0.6 Mickey Weston
Heath Fillmyer 620 5.54 3.78 1.17 .296 85 118 5.03 0.6 Steve Falteisek
Brian Flynn 302 5.77 3.54 0.79 .297 103 97 4.32 0.6 Tom Burgmeier
Pedro Fernandez 295 5.62 3.97 0.82 .298 95 105 4.60 0.5 Jim McDonald
Ian Kennedy 556 7.45 3.09 1.69 .286 83 120 5.08 0.5 Dennis Springer
Jake Kalish 422 5.40 2.94 1.14 .304 87 115 4.76 0.5 Pat Clements
Gabe Speier 295 5.07 3.84 0.55 .302 98 102 4.28 0.4 Mike Cosgrove
Jake Newberry 277 6.64 4.19 0.87 .295 99 101 4.47 0.4 Hal Reniff
Tim Hill 237 7.50 3.50 1.00 .302 99 101 4.26 0.4 Todd Rizzo
Wily Peralta 405 7.53 4.42 1.10 .313 86 116 4.64 0.3 Blue Moon Odom
Jason Adam 230 9.75 4.70 1.22 .294 99 101 4.54 0.3 Bryce Florie
Kevin McCarthy 321 5.42 2.96 1.11 .299 94 106 4.66 0.3 Lew Burdette
Foster Griffin 643 5.31 3.29 1.39 .306 81 123 5.24 0.3 Jason Dickson
Eric Skoglund 441 6.14 2.71 1.54 .303 82 122 5.09 0.3 Eric Knott
Josh Staumont 440 9.49 7.83 0.88 .302 83 121 5.12 0.2 Chad Reineke
Kyle Zimmer 141 7.84 4.65 1.16 .304 87 115 4.83 0.1 Lou Kretlow
Kevin Lenik 211 6.99 5.05 0.78 .303 92 108 4.60 0.1 Ken Wright
Sam Selman 215 9.66 7.49 0.79 .298 91 110 4.84 0.1 Mike Kinnunen
Jorge Lopez 443 7.02 3.83 1.28 .305 82 123 4.86 0.1 Tim Crabtree
Scott Barlow 552 8.83 5.09 1.50 .307 79 127 5.22 0.1 Elvin Nina
Seth Maness 184 4.85 1.69 1.27 .308 90 111 4.53 0.1 Tony Arnold
Enny Romero 197 8.39 4.50 1.23 .307 88 114 4.63 0.0 Joey Long
Conner Greene 463 5.78 7.58 0.57 .303 80 126 5.40 0.0 Walt Masterson
Zach Lovvorn 577 4.43 3.57 1.21 .308 78 128 5.28 0.0 Mark Cahill
Walker Sheller 253 4.85 4.04 0.97 .302 86 117 4.98 -0.1 Bob Miller
Scott Blewett 625 4.82 3.83 1.25 .304 78 129 5.34 -0.1 Frank Castillo
Michael Ynoa 157 6.75 5.94 0.81 .301 84 119 5.16 -0.1 Ken Wright
Grant Gavin 238 8.01 5.57 1.05 .305 85 117 4.91 -0.1 Pete Sikaras
Yunior Marte 338 7.09 5.38 0.98 .299 86 116 4.94 -0.1 Joe Hudson
Brandon Maurer 264 7.52 4.30 1.07 .309 85 118 4.56 -0.1 Jose Segura
Blaine Boyer 188 5.83 3.89 1.08 .307 83 121 4.78 -0.1 Bob Scanlan
Chris Ellis 379 7.05 4.52 1.54 .308 76 132 5.57 -0.1 Mark Woodyard
Burch Smith 318 7.79 4.93 1.43 .306 75 134 5.26 -0.3 Marty McLeary
Kyle Lohse 498 5.38 2.81 1.69 .299 74 135 5.44 -0.4 Ed Riley
Andres Machado 393 5.93 4.24 1.48 .309 74 135 5.56 -0.4 Mark Woodyard
Ofreidy Gomez 582 4.88 4.73 1.31 .307 74 135 5.73 -0.5 Clint Sodowsky
Gerson Garabito 545 5.49 5.65 1.49 .297 70 142 6.15 -0.8 Jake Robbins

Disclaimer: ZiPS projections are computer-based projections of performance. Performances have not been allocated to predicted playing time in the majors — many of the players listed above are unlikely to play in the majors at all in 2019. ZiPS is projecting equivalent production — a .240 ZiPS projection may end up being .280 in AAA or .300 in AA, for example. Whether or not a player will play is one of many non-statistical factors one has to take into account when predicting the future.

Players are listed with their most recent teams, unless I have made a mistake. This is very possible, as a lot of minor-league signings go generally unreported in the offseason.

ZiPS’ projections are based on the American League having a 4.29 ERA and the National League having a 4.15 ERA.

Players who are expected to be out due to injury are still projected. More information is always better than less information, and a computer isn’t the tool that should project the injury status of, for example, a pitcher who has had Tommy John surgery.

Both hitters and pitchers are ranked by projected zWAR — which is to say, WAR values as calculated by me, Dan Szymborski, whose surname is spelled with a z. WAR values might differ slightly from those which appear in full release of ZiPS. Finally, I will advise anyone against — and might karate chop anyone guilty of — merely adding up WAR totals on a depth chart to produce projected team WAR.


Exactly Three Things About Avisail Garcia

A number of years ago, when I had reason to watch the Tigers, I got to see a bit of a young Avisail Garcia. From a young age, Garcia was referred to as “Mini Miggy,” that being a reference to regular Miggy, Miguel Cabrera. Garcia is from the same country as Cabrera, and he played for the same team as Cabrera, and he had a build and swing somewhat reminiscent of Cabrera. You probably know how it’s worked out to this point. Garcia was Mini Miggy in the same way so many small Dominican righties have been Mini Pedros. Cabrera will eventually end up in the Hall of Fame. Garcia was non-tendered by a bad baseball team at the age of 27.

But today is January 15, and these are trying days to be a baseball writer. The start of the season still feels ages away, and there’s only so much one can write about Bryce Harper and Manny Machado. And so, here we are. Garcia is finalizing a contract with the Rays, a one-year contract worth at least $3.5 million and at most $6 million. Garcia doesn’t seem ticketed for a starting role — he’ll probably bounce around, getting opportunities to hit against lefties. The better he does, the more he’ll play, but he’s joining a team with too many talented players for there to be a long leash. Just because Garcia will start the season in Tampa Bay doesn’t mean that’s where he’ll end it.

The Rays have wanted a right-handed hitter. I assume they wanted a better right-handed hitter. But this is the right-handed hitter I’ve been given a reason to write about right now. So if you’ll join me, I have three things I’d like to share with you. Three fun facts, if you will, three ways in which Garcia is unusual.

Read the rest of this entry »


Steve Stone Has a Lot of Opinions on Pitching

Steve Stone knows a lot about pitching. A savvy right-hander for four teams from 1971-1981, he hurled 43 complete games, and augmented a 101-93 record with a rock solid 3.97 ERA. Stone was especially stellar in the 1980 season, garnering 25 wins for the Baltimore Orioles and taking home the American League Cy Young Award.

He doesn’t lack for opinions. Given his current job, he’s not supposed to. The 71-year-old has been in the broadcast booth for 30-plus years, the last 10 of them with the White Sox. As fans of Chicago’s South Side team can attest, Stone knows his stuff, and he’s not shy about sharing it. Agree with him or not, he’s rarely boring.

Stone sat down for a wide-ranging interview — one that offered some blunt commentary on players and trends alike — during a visit to Fenway Park midway through the 2018 season.

———

Steve Stone on learning as a young pitcher: “I pitched with Juan Marichal and Gaylord Perry. I pitched with Jim Palmer and Mike Flanagan. I pitched with Wilbur Wood. One thing I learned … I was very young when I was with Marichal and Perry. I didn’t have Hall of Fame talent, so it was hard to assimilate what they had to show me. Plus, Gaylord wasn’t forthcoming about anything that made him the pitcher he was. Marichal probably would have been, had I been able to understand how he did certain things.

“Perry threw a spitter. He wasn’t going to share that. Not unless I brought $3,000 to the park. That’s how much he said he’d charge to teach me the spitter. I was taking home $8,500. I didn’t want to give him 40% of my yearly take-home pay to try to learn a pitch that very few people can master. Read the rest of this entry »


Job Posting: Chicago Cubs Baseball Systems Software Engineer

Position: Baseball Systems Software Engineer

Location: Chicago, IL

Description:
This role will primarily focus on the development and maintenance of the Cubs internal baseball information system, including creating web interfaces and web tools for the user interface; building ETL processes; maintaining back-end databases; and troubleshooting data sources issues as needed.

Responsibilities:

  • Assist in the design and implementation of web interfaces for the Baseball Ops information system
  • Develop and maintain ETL processes for loading, processing and quality-checking new data sources
  • Identify, diagnose and resolve data quality issues
  • Build and/or support mobile-friendly user interfaces and experiences
  • Build and/or support web services and business-layer applications that speak to both back-end databases and front-end interfaces
  • Provide development support and guidance to Baseball Operations power users and general support to all Baseball Operations front-office and field personnel, as needed
  • Examine, and where appropriate, prototype new technologies in the pursuit of creating competitive advantages through software, applications and tools
  • Partner with Data Architects and Infrastructure/Operations resources on the Information Technology team to ensure secure, scalable and high-performing applications

Required Qualifications:

  • Bachelor’s degree in Computer Science, Engineering or Related Quantitative Subjects
  • Expertise with modern database technologies and SQL
  • Expertise in Python, Java or C#
  • Experience with Javascript
  • Experience with front-end Javascript frameworks like ReactJS, Angular or Vue
  • Experience with HTML/CSS
  • Excellent written and verbal communication skills
  • Working knowledge of advanced baseball statistics and sabermetric concepts

Preferred Qualifications:

  • Experience with the R programming language
  • Experience with Pandas, NumPy and SciPy Python Libraries
  • Experience working in a Linux environment
  • Experience building web or native applications for mobile devices
  • Experience building and supporting ETL processes

To Apply:
To apply, please use this link to complete the online application.

Response Expectations:
Due to the overwhelming number of applications the Cubs receive, they unfortunately may not be able to respond in person to each applicant. However, they can assure you that you will receive an email confirmation when you apply as well as additional email notifications whether you are selected to move forward for the position or not. Please note, the Cubs keep all resumes on file and will contact you should they wish to schedule an interview with you.

The Chicago Cubs and its affiliates are an Equal Opportunity Employer committed to inclusion and employing a diverse workforce. All applicants will receive consideration without regard to race, color, religion, sex, national origin, age, sexual orientation, gender identity, gender expression, veteran status, disability, or other legally protected characteristics.

The content in this posting was created and provided solely by the Chicago Cubs.


Derek Holland Is Derek Holland Again

One season ago, Derek Holland was one of the worst pitchers in baseball. There were 134 pitchers in the majors who threw at least 100 innings. Holland wound up with the fifth-worst ERA-. He wound up with the single worst FIP-, and the single-worst xFIP-. He allowed the second-highest wOBA, and he allowed the very highest expected wOBA, based on Statcast. It was a new low for Holland in what had earlier been a promising career. After peaking with the Rangers when the Rangers were good, Holland fought knee trouble and shoulder trouble. After that miserable 2017 with the White Sox, Holland joined the Giants on a minor-league contract.

Last year’s Giants were bad. One of the things that happens when a team is bad is that the team also doesn’t draw very much attention. Criticism is heaped upon the good players who disappoint, and optimists might hunt for bright spots among youth. But bad teams are by and large forgotten or ignored as a summer wears on. As a consequence of that, you might not have noticed Derek Holland’s 2018. I know I didn’t, for a while. It was a terrible year for the Giants. It was a successful year for Holland.

Read the rest of this entry »


DJ LeMahieu Is Going to Look Familiar

Late last week, free-agent infielder DJ LeMahieu signed for two years and $24 million. LeMahieu is going into his age-30 season, and not that long ago, I wrote about his offensive upside. Given where we are in the information era — and the player-development era — I find LeMahieu intriguing, and so I’m a fan of the terms. I think he can be a lot more valuable than this, although to his agent’s credit, he’s also a member of baseball’s veteran middle class, so it’s good to lock down a multi-year contract at all.

The one thing that’s somewhat surprising is that LeMahieu didn’t sign with, say, the Brewers. He signed with the Yankees. The Yankees already had a player at LeMahieu’s primary position, just as the Mets already had a player (two of them, in fact) at Jed Lowrie‘s primary position. So, just like with Lowrie, LeMahieu is expected to move around the diamond. It makes it all the more difficult to fit Manny Machado with the Yankees. It also makes you wonder at least a little bit about Miguel Andujar’s future as the Yankees’ third baseman. In LeMahieu, the Yankees signed a talented player, but it raises new questions. It also re-raises old ones.

For the next few minutes, though, let’s forget all of that. Let’s forget about how the Yankees’ infield all works together. Let’s forget about Machado, and Andujar, and Troy Tulowitzki. Let’s just talk about DJ LeMahieu’s hitting. Does he remind you of anyone?

Read the rest of this entry »


The Angels and Anaheim Made a Short-Term Deal

In October, we talked about the Angels opting out of their stadium lease with the city of Anaheim. At the time, the move required that the team vacate the venue at the close of the 2019 season. Given the rapidly approaching deadline and acrimony between the parties, I speculated then that the most likely outcome would be a short-term deal.

So where does that leave the Angels and Anaheim? Most observers think these two parties need each other, and I tend to agree. . . . The Angels need a baseball stadium, and Anaheim doesn’t want to lose its tenant, even if the team has been a pain in its butt. At the same time, however, we’re already seeing trial balloons floated about moves to Portland or Las Vegas, and neither side is moving with any urgency at this point (though that could and probably will change down the road). I think the safe bet is a short-term, five- or ten-year lease with another opt-out, enough for the two sides to have a brief cooling-off period.

As it turns out, the two sides did end up reaching a short-term agreement, but it was for a far shorter length of time than most observers, including myself, anticipated.

The Angels and the city of Anaheim are expected to agree to a one-year extension of the team’s lease at Angel Stadium, which would keep the team in Anaheim through the 2020 season.

The Anaheim City Council is expected to consider the extension at its meeting Tuesday. Harry Sidhu, the city’s new mayor, plans to introduce the proposal after meeting last week with Angels owner Arte Moreno.

So why the short-term pact? For one thing, both sides are reportedly planning to use the extension to give some breathing room to further negotiations. Alden Gonzalez wrote for ESPN that the team and city have already begun a dialogue.

New Anaheim Mayor Harry Sidhu, sworn in last month, met with Angels owner Arte Moreno last week, and both sides decided that more time would be beneficial.

“We realized a one-year extension will give us adequate time to work collaboratively on a long-term relationship,” Moreno said in a statement.

“From that meeting, it is clear the team’s priority is to stay in Anaheim, if we can work out a deal that benefits our residents, the city and the team,” Sindhu said in his statement. “We need a plan to make that happen, and we need time to make that happen.”

On the surface, this seems entirely reasonable. A deadline at the end of 2019 would make it difficult for extension talks to be productive given the proverbial sword of Damocles hanging over the parties. Still optimism for a deal seems to revolve around the city’s newfound willingness to discuss either a new stadium, or significant renovations to the existing structure, a proposition the city earlier considered a non-starter.

While neither side has commented in recent months on specifics of what they hope a new lease might include, city spokesman Mike Lyster said, “We’re going to look at everything from rehabbing the stadium all the way to building a new stadium.”

But for the team, there’s a catch. While the city is now willing to discuss the concept of a new ballpark, the city is not at all willing to finance such a venture. Instead, the city is proposing an arrangement like the one the Anaheim Ducks tentatively made for their venue, the Honda Center, late last year.

The broad terms of the deal were approved unanimously by the Anaheim City Council at the Oct. 23 meeting and call for the city to sell three Honda Center parking lots, plus a lot across the street, at fair market value to Anaheim Arena Management (AAM), which could be developed into homes, office and commercial space. The vote gives city staff a framework to negotiate the final terms of the deal for later approval by the city council.

The Ducks, who have been based in Anaheim the past 25 years, would sign onto another 25-year commitment with Anaheim after their current agreement ends in June 2023. Anaheim Arena Management, which currently operates and maintains the Honda Center, would continue operating the facility until 2048.

Such a deal would be an elegant solution to the current impasse, changing what the Angels consider to be a “toxic” atmosphere for local businesses into a private-public partnership. At the same time, it’s far from a sure bet; for one thing, a deal like this, while addressing the team’s location concerns, wouldn’t provide the upgraded facility the team desires. And worse, the Ducks’ deal did cut into what the Angels wanted as part of their own mixed-use complex.

[Anaheim] Councilman Stephen Faessel, who otherwise called the proposal a “great deal,” questioned why the deal includes the sale of a parking lot across from the Honda Center by ARTIC without a formal bidding process where other developers could also bid for the property.

“ARTIC is not that far from Angel Stadium, and now we’re likely going to have to negotiate a deal with the Angels, how do we know the Angels won’t give us a better deal?” Faessel said.

City spokesman Mike Lyster later clarified the city is not considering selling the ARTIC lot, but may lease it to the Honda Center.

So despite how the deal has been framed – as a way for the two sides to buy time to reach a more long-lasting arrangement – this extension is no guarantee that an agreement will, in fact, be reached. And most interestingly, the one-year extension keeps open the possibility that the team could consider a jump outside of California – particularly given the recent development that Portland may be ready for a major league team as soon as 2022.


2019 ZiPS Projections – Texas Rangers

After having typically appeared in the hallowed pages of Baseball Think Factory, Dan Szymborski’s ZiPS projections have now been released at FanGraphs for more than half a decade. The exercise continues this offseason. Below are the projections for the Texas Rangers.

Batters

Perhaps the biggest disappointment in last year’s projections (and in 2018, really) was the several steps taken backward by Willie Calhoun. Originally, it was believed he would only be in the minors temporarily to beat up minor league pitchers while some service time shenanigans resolved themselves. Problem was, Calhoun never really earned a callup, struggling to hit Triple-A pitchers and only besting an .800 OPS in a single month of the season, a July that was driven by a .364 batting average. The Rangers brought him up when there was obvious playing time for him, but hitting .222/.269/.333 in 108 plate appearances was hardly a strong push for a full-time job. Even ignoring the cameo role in the majors, Calhoun’s power was mostly gone in the minors, which is not good. To be a decent starting left fielder in the majors, you have to be a batting average/on-base percentage deity or be a legitimate all-world talent on defense. Calhoun is neither. I wouldn’t write him off yet, but I’m very worried.

I’m a little surprised that Texas either couldn’t or wouldn’t close a deal with another team for Shin-Soo Choo, a player whose presence required a losing Rangers team to carry a significant salary after Choo turned in a solid little year and had some trade value. Choo is quickly approaching age 40, and until Nomar Mazara actually turns his impressive raw power into actual counting numbers, Joey Gallo is the only really dependable Rangers hitter. Gallo is what he is, and will likely always have an abysmal batting average. He’s fortunate to not have been born 30 years earlier.

One projection that intrigues me is Christian Lopes’, who was a third-tier prospect for the Blue Jays a very long time ago with a fairly mature approach at the plate coming out of high school. It never really manifested itself in the stats, however, and the knock was that he didn’t have a standout tool otherwise. But he’s made great strides the last couple years and has gotten to the point where he may be a pretty interesting role player, with Texas using him at a lot of positions in the minors.

Pitchers

You can see the skinny rebuild in progress in the Rangers’ rotation. You have a number of OK-ish starters (excluding Yohander Mendez, who ZiPS hates with the fire of a thousand suns), probably none of whom will be part of the next good Rangers team. Drew Smyly, Edinson Volquez, and Shelby Miller are essentially reclamation projects, and at three years and $30 million, Lance Lynn may be the last of the quintet “out” of Texas (Mike Minor is there, too), but if the recovery in his peripherals in 2018 isn’t a fluke, Texas may get a real prospect for him.

ZiPS is a believer in Jose Leclerc at the front of the bullpen, and sees the rest of the group as a fairly boring but quite adequate relief corps, which is fine with the Rangers not seriously contending yet.

Bench and Prospects

One of the most interesting Rangers projections is that of Brock Burke, a former Rays third-rounder who the Rays brought around very slowly out of high school. 2018 was the year in which everything clicked, with Burke seeing a 30% bump in his strikeout rate while also being promoted, striking out almost 12 batters a game for Montgomery. ZiPS doesn’t give him a huge ceiling, but is surprisingly confident in Burke being a mid-rotation starter despite only him only having limited playing time in Double-A.

One pedantic note for 2019: for the WAR graphic, I’m using FanGraphs’ depth chart playing time, not the playing time ZiPS spits out, so there will be occasional differences in WAR totals.

Ballpark graphic courtesy Eephus League. Depth charts constructed by way of those listed here at site.

Batters – Counting Stats
Player B Age PO G AB R H 2B 3B HR RBI BB SO SB CS
Joey Gallo L 25 LF 142 436 85 93 19 3 40 84 78 202 7 2
Adrian Beltre R 40 3B 101 369 40 98 18 1 12 55 30 76 1 0
Elvis Andrus R 30 SS 132 511 69 139 29 4 10 54 37 81 13 7
Rougned Odor L 25 2B 148 551 82 137 28 4 24 77 38 141 13 10
Shin-Soo Choo L 36 DH 123 464 71 116 21 1 17 55 68 129 6 2
Nomar Mazara L 24 RF 144 536 65 140 25 3 23 88 46 129 1 1
Christian Lopes R 26 2B 120 434 55 111 23 2 9 45 46 85 12 5
Patrick Wisdom R 27 3B 125 418 56 96 21 2 16 60 37 145 8 3
Nolan Fontana L 28 SS 92 299 40 62 15 2 6 29 50 99 6 3
Tommy Joseph R 27 1B 117 411 52 107 23 0 21 69 26 99 0 0
Willie Calhoun L 24 LF 145 545 71 146 31 2 22 74 37 81 3 1
Ronald Guzman L 24 1B 131 454 56 112 20 3 15 58 39 127 2 1
Danny Santana B 28 CF 103 324 43 79 18 4 10 40 15 89 12 6
Chase d’Arnaud R 32 2B 106 340 44 82 15 3 9 39 29 90 13 4
Delino DeShields R 26 CF 118 380 66 90 16 3 4 26 48 104 25 7
Andy Ibanez R 26 3B 122 466 53 116 22 2 11 46 32 82 4 5
Carlos Perez R 28 C 76 250 27 58 14 1 7 32 17 52 2 1
Jett Bandy R 29 C 82 263 30 58 14 0 9 32 14 61 2 0
Isiah Kiner-Falefa R 24 C 122 441 50 111 20 2 4 35 34 81 9 6
Anderson Tejeda L 21 SS 125 476 59 109 19 4 15 54 36 171 8 6
Jack Reinheimer R 26 SS 114 417 49 98 16 2 5 34 35 104 14 6
Hunter Cole R 26 RF 107 404 47 96 19 3 13 48 31 128 2 3
Ryan Rua R 29 LF 89 247 32 54 9 1 9 26 17 88 6 1
Leody Taveras B 20 CF 138 551 61 132 18 6 8 43 41 121 15 12
Jeff Mathis R 36 C 56 166 13 32 7 1 2 15 14 58 0 0
Tony Sanchez R 31 C 67 233 27 54 11 1 5 25 20 64 1 1
Josh Morgan R 23 C 95 363 39 87 16 2 4 29 23 64 2 1
Jose Trevino R 26 C 89 347 35 76 13 1 6 31 14 58 1 2
Charles Leblanc R 23 2B 126 464 52 110 21 3 9 45 38 121 5 3
Carlos Tocci R 23 CF 130 382 40 98 14 6 1 28 23 93 4 7
Nick Noonan L 30 SS 89 304 30 69 14 1 4 28 16 80 2 2
Jose Cardona R 25 CF 111 425 47 101 15 1 8 35 26 82 11 9
Cliff Pennington B 35 SS 91 234 24 48 8 1 2 16 25 67 2 1
Scott Heineman R 26 RF 118 479 59 118 22 3 11 46 34 128 12 8
Michael De Leon R 22 SS 140 515 46 124 21 1 4 37 18 80 2 2
Destin Hood R 29 RF 108 384 44 86 18 2 14 48 24 130 5 3
Yonny Hernandez B 21 SS 116 390 46 86 13 2 2 26 48 95 31 16
Eliezer Alvarez B 24 LF 108 408 50 92 20 4 9 41 34 141 20 5
Eli White R 25 2B 122 484 55 113 24 4 6 40 40 146 10 6
Yanio Perez R 23 1B 96 365 39 84 12 1 8 32 25 105 2 1
Michael O’Neill R 27 CF 122 439 46 92 19 2 10 39 29 157 18 6
Preston Beck L 28 1B 109 404 43 92 17 3 7 37 29 104 2 3
Correlle Prime R 25 1B 86 292 27 56 11 1 6 23 17 129 3 4

Batters – Rate Stats
Player BA OBP SLG OPS+ ISO BABIP RC/27 Def WAR No. 1 Comp
Joey Gallo .213 .343 .546 127 .333 .273 6.5 -7 2.2 Adam Dunn
Adrian Beltre .266 .324 .417 92 .152 .306 5.0 6 1.5 Mike Lowell
Elvis Andrus .272 .322 .403 88 .131 .307 4.8 -2 1.2 Marco Scutaro
Rougned Odor .249 .307 .445 93 .196 .293 4.8 -2 1.2 Steve Buechele
Shin-Soo Choo .250 .355 .409 100 .159 .311 5.3 0 1.1 Bill White
Nomar Mazara .261 .323 .448 99 .187 .305 5.3 -1 1.0 Adam Lind
Christian Lopes .256 .330 .380 86 .124 .300 4.6 -1 0.8 Tim Dulin
Patrick Wisdom .230 .297 .404 81 .175 .311 4.3 3 0.8 Jim Chamblee
Nolan Fontana .207 .322 .331 72 .124 .289 3.6 1 0.5 Lauro Felix
Tommy Joseph .260 .309 .470 100 .209 .296 5.3 -3 0.4 Nate Gold
Willie Calhoun .268 .317 .453 99 .185 .281 5.3 -7 0.4 Mike Greenwell
Ronald Guzman .247 .314 .403 86 .156 .311 4.5 4 0.4 Juan Tejeda
Danny Santana .244 .279 .417 79 .173 .307 4.1 1 0.3 Randy Kutcher
Chase d’Arnaud .241 .306 .382 79 .141 .303 4.3 -2 0.2 Royce Clayton
Delino DeShields .237 .325 .326 72 .089 .316 4.1 -1 0.2 Deron McCue
Andy Ibanez .249 .300 .376 75 .127 .282 3.9 1 0.2 Pete Rose Jr.
Carlos Perez .232 .281 .380 71 .148 .267 3.8 0 0.2 Jim Horner
Jett Bandy .221 .283 .376 71 .156 .254 3.8 -1 0.1 Scott Servais
Isiah Kiner-Falefa .252 .315 .333 71 .082 .301 3.7 -4 0.0 Rafael Pujols
Anderson Tejeda .229 .284 .380 72 .151 .324 3.7 -2 0.0 Bert Pena
Jack Reinheimer .235 .296 .319 62 .084 .302 3.4 2 -0.1 Drew Meyer
Hunter Cole .238 .293 .396 78 .158 .316 4.0 3 -0.1 Mike Diaz
Ryan Rua .219 .276 .372 68 .154 .300 3.7 3 -0.1 Cory Aldridge
Leody Taveras .240 .292 .338 64 .098 .294 3.3 6 -0.2 Julio Peguero
Jeff Mathis .193 .258 .283 42 .090 .283 2.4 4 -0.2 Frank Charles
Tony Sanchez .232 .298 .352 70 .120 .299 3.6 -4 -0.3 Mike DiFelice
Josh Morgan .240 .291 .328 62 .088 .281 3.4 -2 -0.3 Chad Strickland
Jose Trevino .219 .250 .314 47 .095 .247 2.6 6 -0.4 Rogelio Arias
Charles Leblanc .237 .295 .353 69 .116 .302 3.7 -2 -0.4 Brad Harman
Carlos Tocci .257 .306 .332 68 .076 .337 3.4 0 -0.4 Darren Lewis
Nick Noonan .227 .266 .319 53 .092 .295 2.9 1 -0.6 Kevin Baez
Jose Cardona .238 .285 .334 62 .096 .278 3.2 1 -0.6 Joey Aragon
Cliff Pennington .205 .281 .274 47 .068 .279 2.6 0 -0.6 Rabbit Warstler
Scott Heineman .246 .305 .374 77 .127 .315 4.0 -2 -0.6 Mike Berger
Michael De Leon .241 .268 .309 51 .068 .278 2.9 6 -0.7 Mario Diaz
Destin Hood .224 .271 .391 70 .167 .300 3.6 0 -0.7 Scott Wade
Yonny Hernandez .221 .312 .279 57 .059 .287 3.0 -4 -0.8 Nick Punto
Eliezer Alvarez .225 .290 .360 69 .135 .322 3.9 -3 -0.8 Thomas Howard
Eli White .233 .298 .337 66 .103 .322 3.5 -5 -0.9 Caonabo Cosme
Yanio Perez .230 .286 .334 62 .104 .302 3.4 0 -1.2 Jason Restko
Michael O’Neill .210 .266 .330 55 .121 .301 3.1 -7 -1.6 Jamie Sykes
Preston Beck .228 .283 .337 62 .109 .290 3.2 -3 -1.7 Greg Creek
Correlle Prime .192 .240 .298 40 .106 .318 2.2 2 -1.7 Eli Tintor

Pitchers – Counting Stats
Player T Age W L ERA G GS IP H ER HR BB SO
Lance Lynn R 32 10 9 4.50 28 27 146.0 154 73 19 65 126
Mike Minor L 31 9 8 4.49 24 24 132.3 133 66 20 37 108
Jose Leclerc R 25 4 2 3.13 61 0 63.3 45 22 3 39 85
Brock Burke L 22 8 7 4.77 25 23 128.3 143 68 16 54 99
Martin Perez L 28 8 7 4.76 26 22 128.7 146 68 14 46 77
Drew Smyly L 30 6 5 4.73 20 20 99.0 105 52 19 32 97
Jesse Chavez R 35 4 2 3.99 57 0 76.7 76 34 11 20 71
Brett Martin L 24 6 6 4.92 26 15 89.7 99 49 10 39 66
Yovani Gallardo R 33 8 8 5.22 26 24 122.3 139 71 16 54 77
Adrian Sampson R 27 7 7 5.12 32 21 128.3 155 73 21 26 74
Shelby Miller R 28 6 6 5.08 17 16 83.3 92 47 13 31 70
Chris Martin R 33 3 2 3.74 44 0 43.3 46 18 4 11 35
Tony Barnette R 35 2 1 3.59 38 0 42.7 41 17 3 13 39
Phillips Valdez R 27 6 6 5.08 29 18 111.7 129 63 14 47 73
Matt Bush R 33 3 2 3.83 44 0 44.7 42 19 5 18 43
Doug Fister R 35 6 6 5.00 17 15 86.3 98 48 13 29 56
Clayton Blackburn R 26 5 5 5.03 18 16 87.7 103 49 13 26 58
Kyle Bird L 26 3 3 4.72 45 4 68.7 72 36 8 35 57
Jeffrey Springs L 26 5 5 4.98 44 6 86.7 87 48 15 42 92
Deolis Guerra R 30 3 2 4.31 42 2 54.3 55 26 8 16 50
Jeanmar Gomez R 31 4 3 4.32 54 0 58.3 64 28 6 20 42
Ariel Jurado R 23 8 10 5.57 28 25 145.3 183 90 23 38 65
Edinson Volquez R 35 4 4 5.14 12 12 63.0 70 36 8 32 44
Luke Farrell R 28 6 6 5.34 29 16 91.0 99 54 16 46 81
Nick Gardewine R 25 2 2 4.08 30 0 35.3 34 16 3 15 33
Taylor Hearn L 24 5 6 5.37 23 23 107.3 113 64 18 57 98
Drew Hutchison R 28 6 7 5.52 26 19 109.3 124 67 19 47 85
Joe Palumbo L 24 3 3 5.14 12 11 49.0 54 28 8 20 36
Jonathan Hernandez R 22 7 8 5.57 22 22 103.3 113 64 15 62 83
Michael Tonkin R 29 2 2 4.62 43 0 50.7 52 26 8 20 52
Ricardo Rodriguez R 26 3 3 4.87 45 2 57.3 62 31 8 20 46
Ronald Herrera R 24 5 6 5.42 17 17 91.3 110 55 13 36 46
Connor Sadzeck R 27 3 3 4.74 57 0 49.3 48 26 5 31 47
Tim Dillard R 35 3 3 4.78 25 2 43.3 47 23 5 21 29
Jordan Romano R 26 4 6 5.38 14 14 68.0 71 41 11 32 52
Wei-Chieh Huang R 25 4 5 5.14 38 2 70.0 71 40 11 38 68
Eddie Butler R 28 5 6 5.49 30 14 95.0 114 58 14 38 52
Miguel Del Pozo L 26 3 3 4.97 34 0 41.7 45 23 4 22 32
C.D. Pelham L 24 2 2 5.17 54 0 55.7 57 32 5 39 45
Chris Rowley R 28 7 9 5.85 26 20 120.0 143 78 22 50 72
Wes Benjamin L 25 5 7 6.00 20 19 87.0 106 58 18 34 58
Richelson Pena R 25 6 8 5.96 23 18 108.7 135 72 24 30 65
Jack Leathersich L 28 1 2 5.34 38 0 32.0 28 19 3 31 37
Adam Parks R 26 3 3 5.48 34 0 46.0 51 28 9 19 39
Zac Curtis L 26 3 3 5.28 56 0 59.7 59 35 9 40 60
Tim Lincecum R 35 1 2 5.55 24 0 24.3 27 15 4 15 19
Adam Loewen L 35 3 3 5.40 42 0 45.0 41 27 5 40 47
Kevin Jepsen R 34 2 2 5.81 36 0 31.0 33 20 6 16 23
Chris Tillman R 31 6 8 6.12 22 21 100.0 118 68 17 50 59
Brandon Mann L 35 3 4 5.80 36 3 54.3 59 35 9 32 41
Austin Bibens-Dirkx R 34 5 6 6.16 25 16 99.3 120 68 23 34 69
Ariel Hernandez R 27 3 4 5.74 47 0 53.3 51 34 5 56 50
Rafael Montero R 28 5 7 6.04 26 17 98.3 117 66 18 55 79
Locke St. John L 26 4 5 5.93 37 0 54.7 60 36 12 28 49
Collin Wiles R 25 6 8 6.31 21 20 107.0 135 75 26 28 65
Yohander Mendez L 24 6 9 6.63 30 26 130.3 158 96 33 55 92
Yoel Espinal R 26 3 5 7.29 42 2 54.3 59 44 12 55 52

Pitchers – Rate Stats
Player TBF K/9 BB/9 HR/9 BABIP ERA+ ERA- FIP WAR No. 1 Comp
Lance Lynn 652 7.77 4.01 1.17 .310 100 100 4.57 1.8 Bill Singer
Mike Minor 561 7.35 2.52 1.36 .288 100 100 4.41 1.7 Jarrod Washburn
Jose Leclerc 273 12.08 5.54 0.43 .294 148 67 3.07 1.6 Jose Valverde
Brock Burke 580 6.94 3.79 1.12 .315 97 103 4.68 1.5 Jake Chapman
Martin Perez 570 5.39 3.22 0.98 .307 98 103 4.51 1.5 Jim O’Toole
Drew Smyly 429 8.82 2.91 1.73 .308 98 102 4.72 1.2 Cliff Lee
Jesse Chavez 322 8.33 2.35 1.29 .297 116 86 3.98 1.0 Terry Leach
Brett Martin 405 6.62 3.91 1.00 .312 94 106 4.60 0.9 Josh Shortslef
Yovani Gallardo 552 5.66 3.97 1.18 .305 89 113 4.96 0.9 Spec Shea
Adrian Sampson 562 5.19 1.82 1.47 .309 88 114 4.90 0.8 John Doherty
Shelby Miller 369 7.56 3.35 1.40 .312 91 109 4.69 0.7 Jay Tibbs
Chris Martin 186 7.27 2.28 0.83 .313 124 81 3.63 0.7 Bobby Tiefenauer
Tony Barnette 181 8.23 2.74 0.63 .306 129 77 3.29 0.7 Barney Schultz
Phillips Valdez 509 5.88 3.79 1.13 .313 89 113 4.92 0.7 Bill Swift
Matt Bush 193 8.66 3.63 1.01 .296 121 83 4.02 0.7 Jim Hughes
Doug Fister 384 5.84 3.02 1.36 .302 90 111 4.99 0.6 Freddie Fitzsimmons
Clayton Blackburn 389 5.95 2.67 1.33 .313 89 112 4.78 0.6 Lary Sorensen
Kyle Bird 312 7.47 4.59 1.05 .308 98 102 4.71 0.6 Pete Cappadona
Jeffrey Springs 388 9.55 4.36 1.56 .308 93 107 4.90 0.5 J.C. Romero
Deolis Guerra 232 8.28 2.65 1.33 .301 104 96 4.22 0.5 Jay Tessmer
Jeanmar Gomez 256 6.48 3.09 0.93 .312 104 96 4.18 0.5 Frank Linzy
Ariel Jurado 650 4.03 2.35 1.42 .309 83 120 5.22 0.5 Bill King
Edinson Volquez 288 6.29 4.57 1.14 .307 90 111 5.02 0.5 Tommy Byrne
Luke Farrell 416 8.01 4.55 1.58 .310 87 115 5.34 0.5 Mike Buddie
Nick Gardewine 155 8.41 3.82 0.76 .304 114 88 3.83 0.4 Mike Hansen
Taylor Hearn 490 8.22 4.78 1.51 .305 84 119 5.26 0.4 Phil Dumatrait
Drew Hutchison 498 7.00 3.87 1.56 .309 84 119 5.34 0.4 Kevin Hodges
Joe Palumbo 220 6.61 3.67 1.47 .301 90 111 5.21 0.4 Kason Gabbard
Jonathan Hernandez 483 7.23 5.40 1.31 .309 83 120 5.40 0.4 Ben Hendrickson
Michael Tonkin 223 9.24 3.55 1.42 .312 100 100 4.45 0.3 Mark Small
Ricardo Rodriguez 253 7.22 3.14 1.26 .307 95 105 4.56 0.3 Robert Tenenini
Ronald Herrera 417 4.53 3.55 1.28 .306 83 121 5.34 0.3 Joe Coleman
Connor Sadzeck 227 8.57 5.66 0.91 .305 98 102 4.63 0.3 Joe Hudson
Tim Dillard 197 6.02 4.36 1.04 .300 94 106 4.90 0.3 Hal White
Jordan Romano 309 6.88 4.24 1.46 .290 82 122 5.44 0.2 Ken Pumphrey
Wei-Chieh Huang 318 8.74 4.89 1.41 .305 90 111 5.05 0.2 Marc Pisciotta
Eddie Butler 433 4.93 3.60 1.33 .308 82 122 5.30 0.1 Marino Pieretti
Miguel Del Pozo 192 6.91 4.75 0.86 .313 90 111 4.66 0.1 Brian Adams
C.D. Pelham 263 7.28 6.31 0.81 .306 90 112 5.02 0.1 Mike Venafro
Chris Rowley 550 5.40 3.75 1.65 .303 79 126 5.76 0.1 Dana Kiecker
Wes Benjamin 399 6.00 3.52 1.86 .310 77 129 5.85 -0.1 Jason Cromer
Richelson Pena 488 5.38 2.48 1.99 .306 78 129 5.82 -0.1 Ryan Cox
Jack Leathersich 155 10.41 8.72 0.84 .305 84 119 5.15 -0.1 Mike Kinnunen
Adam Parks 208 7.63 3.72 1.76 .304 85 118 5.43 -0.1 Brian Wolfe
Zac Curtis 279 9.05 6.03 1.36 .303 85 117 5.36 -0.1 Scott Wiggins
Tim Lincecum 114 7.03 5.55 1.48 .307 81 123 5.70 -0.1 Jerry Johnson
Adam Loewen 216 9.40 8.00 1.00 .298 83 120 5.37 -0.1 Marshall Bridges
Kevin Jepsen 140 6.68 4.65 1.74 .284 80 125 5.73 -0.2 Ray Moore
Chris Tillman 464 5.31 4.50 1.53 .302 76 132 5.80 -0.2 Dick Fowler
Brandon Mann 254 6.79 5.30 1.49 .298 78 129 5.78 -0.3 Johnny Klippstein
Austin Bibens-Dirkx 450 6.25 3.08 2.08 .305 75 133 5.98 -0.3 Jared Fernandez
Ariel Hernandez 266 8.44 9.45 0.84 .303 78 128 5.81 -0.3 Hal Reniff
Rafael Montero 464 7.23 5.03 1.65 .321 74 134 5.72 -0.3 Ben Ford
Locke St. John 251 8.07 4.61 1.98 .302 78 128 5.91 -0.4 Chad Miles
Collin Wiles 481 5.47 2.36 2.19 .306 74 136 6.05 -0.4 John Gardner
Yohander Mendez 601 6.35 3.80 2.28 .302 70 143 6.46 -1.0 Doug Lindsey
Yoel Espinal 277 8.61 9.11 1.99 .305 64 157 7.36 -1.1 Earl Sanders

Disclaimer: ZiPS projections are computer-based projections of performance. Performances have not been allocated to predicted playing time in the majors — many of the players listed above are unlikely to play in the majors at all in 2019. ZiPS is projecting equivalent production — a .240 ZiPS projection may end up being .280 in AAA or .300 in AA, for example. Whether or not a player will play is one of many non-statistical factors one has to take into account when predicting the future.

Players are listed with their most recent teams, unless I have made a mistake. This is very possible, as a lot of minor-league signings go generally unreported in the offseason.

ZiPS’ projections are based on the American League having a 4.29 ERA and the National League having a 4.15 ERA.

Players who are expected to be out due to injury are still projected. More information is always better than less information, and a computer isn’t the tool that should project the injury status of, for example, a pitcher who has had Tommy John surgery.

Both hitters and pitchers are ranked by projected zWAR — which is to say, WAR values as calculated by me, Dan Szymborski, whose surname is spelled with a z. WAR values might differ slightly from those which appear in full release of ZiPS. Finally, I will advise anyone against — and might karate chop anyone guilty of — merely adding up WAR totals on a depth chart to produce projected team WAR.