2019 ZiPS Projections – Arizona Diamondbacks

After having typically appeared in the hallowed pages of Baseball Think Factory, Dan Szymborski’s ZiPS projections have now been released at FanGraphs for more than half a decade. The exercise continues this offseason. Below are the projections for the Arizona Diamondbacks.

Batters

Well, the good news is that Paul Goldschmidt’s departure doesn’t turn the offense into a burnt husk of a lineup. Not that it’ll be a good group, of course. But there’s a wide gulf between a mediocre offense and what our planet will look like in a few hundred years, strewn with artifacts from an earlier time as kids dodge packs of feral dogs in the hopes of snagging food from the dumpster near an abandoned bowling alley. On paper, Arizona has a lot of average hitters, and while that’s not so bad a thing if that’s where your offense ends up, it’s not what you want as your Plan A. Simply put, life comes at you fast — I get most of my wisdom from internet memes — and not everyone in the lineup will get 600 plate appearances.

If they manage to stay healthy, this crew has a surprisingly high floor, but a very low ceiling; there’s literally no one in this group I would take as a great candidate to have a breakout season.

Pitchers

This is the more interesting set of predictions for Arizona, as there is upside here. I won’t lie to you and say that Patrick Corbin isn’t a gigantic loss at the front of the rotation. He was one of the hardest pitchers to hit in 2018, and will likely remain so in 2019. But the 2018 Diamondbacks had almost no Taijuan Walker and lost some starts from Robbie Ray as well, both of whom will help soften the loss of Corbin, and of Clay Buchholz. Not that I expect Buchholz to be great in 2019, but he earned real wins for the team in 2018, wins they’ll have to replace.

Like Miles Mikolas last year, ZiPS gives Merrill Kelly, recently of the KBO, a league-average projection after keeping the ball in the park, which is no easy task in Korea; KBO pitchers had a league average of 2.44 homers per game and an ERA of 5.20 in 2018. Kelly is also reportedly throwing harder now than he did when he was a mostly forgotten Rays prospect. I actually had to look at a couple of those rosters to jog my memory; it feels like a lifetime ago.

Bench and Prospects

The bullpen will probably be reasonable, and the computer sees Jon Duplantier and whichever Taylor is the good one as being legitimate, if ordinary, options for 2019 if something goes wrong. Given Arizona’s insistence that they’re not rebuilding, I wouldn’t be surprised if, without some of the pitching depth including Kelly, they would have been more interested in re-signing Patrick Corbin or in letting Zack Greinke play out his deal. In theory, if Arizona could trade Greinke for at least one legitimate offensive prospect who is close to the majors, such a move would be survivable. I would wager the team is disappointed that Pavin Smith didn’t essentially force the Goldschmidt trade; ZiPS is now at the point where it doesn’t see him as being more likely than not to emerge as even a one-win player in the majors.

One pedantic note for 2019: for the WAR graphic, I’m using FanGraphs’ depth chart playing time, not the playing time ZiPS spits out, so there will be occasional differences in WAR totals.

Ballpark graphic courtesy Eephus League. Depth charts constructed by way of those listed here at site.

Batters – Counting Stats
Player B Age PO G AB R H 2B 3B HR RBI BB SO SB CS
A.J. Pollock R 31 CF 114 424 68 116 26 4 17 57 33 88 16 4
Ketel Marte B 25 SS 148 534 72 148 30 9 11 58 48 84 10 3
Eduardo Escobar B 30 3B 142 504 65 135 34 5 20 80 40 106 2 3
David Peralta L 31 LF 140 506 68 143 27 5 20 70 42 108 5 2
Nick Ahmed R 29 SS 136 443 54 109 25 5 13 55 32 95 5 5
Ildemaro Vargas R 27 SS 137 555 67 151 29 6 8 54 29 55 9 4
Steven Souza R 30 RF 110 380 54 94 20 3 18 60 48 125 9 3
Jake Lamb L 28 1B 115 402 62 97 21 4 18 70 56 127 4 3
Carson Kelly R 24 C 108 349 44 86 18 1 8 39 39 66 0 1
Jarrod Dyson L 34 CF 90 257 39 62 9 4 2 20 25 41 22 5
Daulton Varsho L 22 C 85 334 39 78 14 2 11 39 24 87 11 4
Andy Young R 25 2B 117 433 55 102 14 4 16 50 28 117 4 2
Alex Avila L 32 C 82 220 22 45 8 0 8 26 44 98 0 0
Christian Walker R 28 1B 128 456 64 113 27 4 20 71 36 139 2 1
Socrates Brito L 26 RF 130 459 58 117 22 6 14 57 30 121 9 3
Kevin Cron R 26 1B 120 463 59 111 24 1 23 72 32 147 1 0
Juniel Querecuto B 26 SS 115 401 42 102 19 4 2 34 27 74 9 4
Domingo Leyba B 23 SS 87 340 40 82 16 3 7 31 29 56 4 2
Daniel Descalso L 32 2B 130 319 45 72 15 3 10 47 50 95 1 1
Reymond Fuentes L 28 CF 72 231 27 58 7 2 3 18 14 58 9 2
Matt Szczur R 29 CF 91 179 24 42 10 1 4 20 19 44 4 2
Jon Jay L 34 RF 131 434 60 115 19 4 3 32 29 84 3 2
Ben DeLuzio R 24 CF 80 307 32 71 12 3 2 20 21 92 26 9
Rob Refsnyder R 28 LF 98 309 39 76 18 2 6 29 32 74 3 2
Jazz Chisholm L 21 SS 115 477 61 102 19 5 20 68 33 199 13 5
Dominic Miroglio R 24 C 95 361 36 87 20 2 4 32 18 63 3 3
Patrick Kivlehan R 29 RF 125 389 49 95 21 3 15 55 26 111 5 3
Anthony Recker R 35 C 71 238 29 51 13 1 9 32 23 82 1 1
Marcus Littlewood B 27 C 71 244 27 50 11 0 7 26 23 76 1 1
John Ryan Murphy R 28 C 92 256 26 55 12 0 8 28 17 71 0 0
Abraham Almonte B 30 CF 79 230 32 54 13 3 5 24 24 58 5 2
Marty Herum R 27 3B 105 406 42 102 19 2 6 38 18 80 3 2
Kelby Tomlinson R 29 SS 117 351 37 87 12 2 1 26 29 78 10 6
Cody Decker R 32 1B 78 233 28 47 11 1 11 33 20 96 0 0
Tyler Ladendorf R 31 SS 54 162 18 36 7 0 1 12 13 34 1 1
Jamie Westbrook R 24 LF 121 452 52 114 21 3 13 53 21 85 4 3
Evan Marzilli L 28 CF 97 323 36 64 12 4 4 24 39 114 8 5
Alberto Rosario R 32 C 52 168 14 38 6 0 1 11 7 33 1 1
Drew Ellis R 23 3B 117 446 51 92 25 1 14 52 40 118 2 7
Yasmany Tomas R 28 LF 114 400 45 101 22 3 16 60 17 122 2 1
Marcus Wilson R 22 CF 115 464 51 100 22 3 10 44 39 159 13 8
Chris Stewart R 37 C 49 134 12 27 4 2 0 8 11 20 0 1
Pavin Smith L 23 1B 116 443 51 104 22 2 7 41 42 77 2 2
Rudy Flores L 28 1B 119 424 49 92 20 1 15 51 33 160 1 2

Batters – Rate Stats
Player BA OBP SLG OPS+ ISO BABIP RC/27 Def WAR No. 1 Comp
A.J. Pollock .274 .330 .474 105 .200 .310 6.0 3 2.5 Jackie Brandt
Ketel Marte .277 .337 .429 97 .152 .312 5.5 -1 2.4 Bill Russell
Eduardo Escobar .268 .324 .474 103 .206 .304 5.6 2 2.3 Tim Wallach
David Peralta .283 .341 .474 108 .192 .325 6.1 1 2.1 Del Unser
Nick Ahmed .246 .297 .413 81 .167 .287 4.3 11 1.9 Ronnie Merrill
Ildemaro Vargas .272 .310 .389 80 .117 .291 4.5 4 1.6 Yuniesky Betancourt
Steven Souza .247 .339 .458 104 .211 .321 5.6 0 1.5 Terrell Lowery
Jake Lamb .241 .335 .448 101 .206 .307 5.3 3 1.3 Ben Broussard
Carson Kelly .246 .328 .372 81 .126 .284 4.3 3 1.3 Hector Villanueva
Jarrod Dyson .241 .317 .331 69 .089 .280 4.2 8 1.0 Dave Roberts
Daulton Varsho .234 .292 .386 74 .153 .284 4.1 4 1.0 Matt Sinatro
Andy Young .236 .306 .397 80 .162 .287 4.3 0 0.8 Vince Harrison
Alex Avila .205 .338 .350 79 .145 .325 4.0 -1 0.7 Jamie Quirk
Christian Walker .248 .307 .456 94 .208 .313 5.0 -1 0.6 Keith Williams
Socrates Brito .255 .300 .420 84 .166 .318 4.6 2 0.5 Chad Mottola
Kevin Cron .240 .292 .445 87 .205 .300 4.6 2 0.4 Adell Davenport
Juniel Querecuto .254 .304 .337 66 .082 .308 3.7 3 0.4 Bobby DeJardin
Domingo Leyba .241 .304 .368 73 .126 .271 4.0 -2 0.3 Jeff McKnight
Daniel Descalso .226 .331 .386 85 .160 .290 4.4 -5 0.3 Shanie Dugas
Reymond Fuentes .251 .297 .338 64 .087 .324 3.9 2 0.1 Peter Bergeron
Matt Szczur .235 .313 .369 76 .134 .290 4.1 -1 0.1 Derek Nicholson
Jon Jay .265 .330 .348 76 .083 .323 4.2 2 0.1 Dick Porter
Ben DeLuzio .231 .287 .309 55 .078 .324 3.4 5 0.1 Virgilio Silverio
Rob Refsnyder .246 .322 .375 80 .129 .306 4.3 0 0.1 Mike Colangelo
Jazz Chisholm .214 .266 .400 69 .187 .318 3.7 -3 0.0 Jose Lopez
Dominic Miroglio .241 .293 .341 64 .100 .282 3.5 -1 0.0 Guillermo Garcia
Patrick Kivlehan .244 .299 .429 86 .185 .304 4.6 -4 -0.1 Keith Williams
Anthony Recker .214 .292 .391 75 .176 .286 3.9 -6 -0.1 Ron Karkovice
Marcus Littlewood .205 .271 .336 56 .131 .267 3.1 0 -0.1 Matt Garrick
John Ryan Murphy .215 .264 .355 58 .141 .266 3.2 0 -0.2 Tom Nieto
Abraham Almonte .235 .307 .383 78 .148 .293 4.2 -5 -0.2 Paul Householder
Marty Herum .251 .285 .352 64 .101 .300 3.6 1 -0.3 Tom Veryzer
Kelby Tomlinson .248 .307 .302 59 .054 .316 3.3 -1 -0.3 Joey Hammond
Cody Decker .202 .267 .399 70 .197 .286 3.6 1 -0.3 Dustan Mohr
Tyler Ladendorf .222 .287 .284 49 .062 .276 2.8 0 -0.4 Chris Petersen
Jamie Westbrook .252 .293 .398 77 .146 .285 4.2 -2 -0.4 Mike Peeples
Evan Marzilli .198 .289 .297 53 .099 .293 2.8 3 -0.4 Jeff Duncan
Alberto Rosario .226 .260 .280 40 .054 .276 2.5 1 -0.4 Charlie Greene
Drew Ellis .206 .277 .361 64 .155 .248 3.1 1 -0.5 Adam Fox
Yasmany Tomas .253 .283 .443 84 .190 .324 4.5 -7 -0.5 Jerald Clark
Marcus Wilson .216 .278 .341 59 .125 .305 3.2 1 -0.6 Edgardo Baez
Chris Stewart .201 .265 .261 38 .060 .237 2.2 -2 -0.7 Rick Ferrell
Pavin Smith .235 .303 .341 67 .106 .270 3.6 -1 -1.0 Ryan McGuire
Rudy Flores .217 .282 .375 68 .158 .309 3.6 -5 -1.4 Steve Neal

Pitchers – Counting Stats
Player T Age W L ERA G GS IP H ER HR BB SO
Zack Greinke R 35 14 9 3.69 29 29 180.3 167 74 26 40 167
Robbie Ray L 27 9 6 3.86 29 29 149.3 126 64 20 72 194
Zack Godley R 29 12 10 4.13 29 28 159.0 153 73 18 68 160
Merrill Kelly R 30 11 10 4.57 28 28 169.3 180 86 24 56 141
Clay Buchholz R 34 6 5 4.22 21 19 108.7 110 51 13 34 84
Luke Weaver R 25 9 8 4.66 29 25 133.3 142 69 20 45 118
Taijuan Walker R 26 7 6 4.60 21 21 115.3 119 59 18 39 96
Jon Duplantier R 24 5 4 4.17 21 20 90.7 87 42 9 45 86
Taylor Widener R 24 8 8 4.59 29 29 113.7 107 58 10 76 104
Archie Bradley R 26 5 3 3.72 75 0 72.7 65 30 8 26 78
Jake Buchanan R 29 8 8 4.94 25 22 129.3 155 71 13 47 71
Joel Payamps R 25 9 9 4.88 31 19 125.3 137 68 20 38 99
Matt Andriese R 29 6 6 4.63 34 14 101.0 107 52 17 28 91
Andrew Chafin L 29 4 2 3.44 72 0 55.0 47 21 4 25 56
Silvino Bracho R 26 4 2 3.60 59 0 65.0 55 26 9 23 83
Taylor Clarke R 26 10 10 4.99 26 26 133.3 145 74 22 47 108
Jimmie Sherfy R 27 4 2 3.65 54 0 56.7 48 23 6 28 67
Yoan Lopez R 26 5 3 3.82 53 0 63.7 54 27 7 31 80
Jake Diekman L 32 2 1 3.62 63 0 49.7 40 20 4 28 60
Brad Ziegler R 39 4 3 3.86 63 0 56.0 58 24 4 20 37
Yoshihisa Hirano R 35 4 3 4.08 62 0 53.0 51 24 6 21 47
Kevin Ginkel R 25 4 3 4.01 51 0 60.7 55 27 6 30 67
Shelby Miller R 28 6 6 4.93 17 16 84.0 90 46 13 31 75
Riley Smith R 24 6 7 5.17 25 23 127.0 143 73 19 55 90
T.J. McFarland L 30 3 2 4.28 46 0 61.0 66 29 5 21 34
Justin Donatella R 24 7 8 5.20 26 23 114.3 127 66 16 53 77
Emilio Vargas R 22 7 9 5.24 25 24 122.0 129 71 19 65 110
Nick Green R 24 5 6 5.46 17 17 83.0 93 50 9 53 52
Matt Koch R 28 6 7 5.25 27 21 116.7 140 68 22 30 67
Jake Barrett R 27 3 2 4.37 53 0 57.7 53 28 7 32 62
Barry Enright R 33 5 5 5.15 15 15 80.3 96 46 11 19 48
Stefan Crichton R 27 4 3 4.64 34 1 54.3 57 28 7 23 44
Randall Delgado R 29 3 3 4.50 43 2 52.0 52 26 7 23 45
Joey Krehbiel R 26 3 3 4.55 51 0 57.3 52 29 8 34 67
Brad Boxberger R 31 5 5 4.82 54 0 46.7 41 25 8 30 60
Bradin Hagens R 30 4 5 5.37 25 9 67.0 74 40 10 33 46
Bud Jeter R 27 3 3 4.73 40 0 45.7 46 24 5 25 40
Michael Blazek R 30 2 3 5.10 41 4 60.0 65 34 8 33 50
Alex Young L 25 6 8 5.61 27 21 118.7 136 74 21 50 85
Cody Decker R 32 0 0 8.10 4 0 3.3 5 3 1 1 0
Bo Takahashi R 22 6 8 5.72 23 23 111.7 126 71 24 43 91
Kris Medlen R 33 3 5 6.06 14 13 65.3 77 44 15 26 49
Neftali Feliz R 31 4 5 5.82 39 8 72.7 75 47 13 46 62
Braden Shipley R 27 6 8 5.74 30 16 111.3 129 71 21 47 75
Jared Miller L 25 2 3 5.73 48 0 55.0 50 35 7 55 64
Troy Scribner R 27 4 6 6.28 21 17 86.0 93 60 20 53 82
Ryan Atkinson R 26 6 10 6.05 27 21 99.7 105 67 20 68 99

Pitchers – Rate Stats
Player TBF K/9 BB/9 HR/9 BABIP ERA+ ERA- FIP WAR No. 1 Comp
Zack Greinke 738 8.33 2.00 1.30 .281 119 84 3.89 3.6 Dennis Martinez
Robbie Ray 643 11.69 4.34 1.21 .302 114 88 3.86 2.7 Shawn Estes
Zack Godley 696 9.06 3.85 1.02 .306 106 94 4.06 2.5 Mike Krukow
Merrill Kelly 741 7.49 2.98 1.28 .305 99 101 4.48 2.2 Kyle Lohse
Clay Buchholz 466 6.96 2.82 1.08 .293 108 93 4.21 1.8 Bob Lemon
Luke Weaver 583 7.97 3.04 1.35 .310 98 103 4.48 1.5 Josh Fogg
Taijuan Walker 503 7.49 3.04 1.40 .294 99 101 4.71 1.4 Mike Trujillo
Jon Duplantier 403 8.54 4.47 0.89 .302 106 95 4.20 1.4 Mike Torrez
Taylor Widener 524 8.23 6.02 0.79 .298 96 104 4.68 1.2 Dick Ruthven
Archie Bradley 307 9.66 3.22 0.99 .297 118 84 3.63 1.2 Mike Cather
Jake Buchanan 587 4.94 3.27 0.90 .317 92 109 4.63 1.1 Joe Genewich
Joel Payamps 549 7.11 2.73 1.44 .304 93 108 4.72 1.1 Tim Dillard
Matt Andriese 434 8.11 2.50 1.51 .305 98 102 4.46 1.1 A.J. Sager
Andrew Chafin 234 9.16 4.09 0.65 .291 128 78 3.48 1.0 Sid Monge
Silvino Bracho 273 11.49 3.18 1.25 .299 122 82 3.64 1.0 Robb Nen
Taylor Clarke 589 7.29 3.17 1.49 .304 88 114 4.89 0.9 Cha-Seung Baek
Jimmie Sherfy 245 10.64 4.45 0.95 .298 120 83 3.80 0.8 Brian Wilson
Yoan Lopez 275 11.31 4.38 0.99 .305 115 87 3.67 0.8 Bobby Jenks
Jake Diekman 217 10.87 5.07 0.72 .295 121 82 3.65 0.8 Marshall Bridges
Brad Ziegler 245 5.95 3.21 0.64 .298 114 88 3.99 0.8 Dutch Leonard
Yoshihisa Hirano 230 7.98 3.57 1.02 .294 111 90 4.21 0.7 Shigetoshi Hasegawa
Kevin Ginkel 266 9.94 4.45 0.89 .306 110 91 3.86 0.7 Clay Bryant
Shelby Miller 369 8.04 3.32 1.39 .310 89 112 4.55 0.6 Jay Tibbs
Riley Smith 577 6.38 3.90 1.35 .306 85 118 5.17 0.6 Ed Wojna
T.J. McFarland 266 5.02 3.10 0.74 .298 106 94 4.18 0.5 Dave Tomlin
Justin Donatella 521 6.06 4.17 1.26 .302 85 118 5.20 0.5 Jim Clancy
Emilio Vargas 559 8.11 4.80 1.40 .308 84 119 5.17 0.5 Ben Hendrickson
Nick Green 396 5.64 5.75 0.98 .307 83 120 5.51 0.4 Jake Joseph
Matt Koch 517 5.17 2.31 1.70 .302 84 119 5.40 0.4 Greg Wooten
Jake Barrett 257 9.68 4.99 1.09 .301 101 99 4.40 0.4 George Smith
Barry Enright 353 5.38 2.13 1.23 .314 85 117 4.59 0.4 Jason Johnson
Stefan Crichton 242 7.29 3.81 1.16 .303 98 102 4.64 0.4 Scott Munter
Randall Delgado 228 7.79 3.98 1.21 .296 98 102 4.55 0.3 Ed Farmer
Joey Krehbiel 257 10.52 5.34 1.26 .303 97 103 4.56 0.3 Kevin Barry
Brad Boxberger 209 11.57 5.79 1.54 .300 94 106 4.80 0.2 David Lee
Bradin Hagens 306 6.18 4.43 1.34 .299 85 118 5.33 0.2 Claude Willoughby
Bud Jeter 208 7.88 4.93 0.99 .304 93 108 4.66 0.1 Casey Daigle
Michael Blazek 276 7.50 4.95 1.20 .311 86 116 4.97 0.1 Jerry Johnson
Alex Young 540 6.45 3.79 1.59 .305 78 128 5.46 0.0 Wes Whisler
Cody Decker 16 0.00 2.70 2.70 .286 54 184 7.95 -0.1 Mike Sullivan
Bo Takahashi 503 7.33 3.47 1.93 .302 77 130 5.66 -0.1 Rich Yett
Kris Medlen 297 6.75 3.58 2.07 .304 75 133 5.97 -0.2 R.A. Dickey
Neftali Feliz 337 7.68 5.70 1.61 .291 78 128 5.79 -0.2 Jim Dougherty
Braden Shipley 506 6.06 3.80 1.70 .302 77 130 5.66 -0.2 Jim Walkup
Jared Miller 270 10.47 9.00 1.15 .305 79 126 5.64 -0.3 Gary Wayne
Troy Scribner 403 8.58 5.55 2.09 .300 72 138 6.29 -0.5 Fernando Rijo
Ryan Atkinson 471 8.94 6.14 1.81 .306 73 138 6.00 -0.5 Steve Sparks

Disclaimer: ZiPS projections are computer-based projections of performance. Performances have not been allocated to predicted playing time in the majors — many of the players listed above are unlikely to play in the majors at all in 2019. ZiPS is projecting equivalent production — a .240 ZiPS projection may end up being .280 in AAA or .300 in AA, for example. Whether or not a player will play is one of many non-statistical factors one has to take into account when predicting the future.

Players are listed with their most recent teams, unless I have made a mistake. This is very possible, as a lot of minor-league signings go generally unreported in the offseason.

ZiPS’ projections are based on the American League having a 4.29 ERA and the National League having a 4.15 ERA.

Players who are expected to be out due to injury are still projected. More information is always better than less information, and a computer isn’t the tool that should project the injury status of, for example, a pitcher who has had Tommy John surgery.

Both hitters and pitchers are ranked by projected zWAR — which is to say, WAR values as calculated by me, Dan Szymborski, whose surname is spelled with a z. WAR values might differ slightly from those which appear in full release of ZiPS. Finally, I will advise anyone against — and might karate chop anyone guilty of — merely adding up WAR totals on a depth chart to produce projected team WAR.


So What Happens if Kyler Murray Plays Football?

Water is wet. Grass is green. Kyler Murray is a talented athlete. These are statements we know to be true. The first two aren’t especially relevant to FanGraphs, but the third one is.

In case you aren’t aware, the Oakland Athletics drafted Murray with the ninth overall pick of the most recent Major League Baseball Rule 4 draft. Back in April, before he was drafted, our own Eric Longenhagen was taken with the outfielder’s athleticism.

Evaluators see him as a crude but gifted speedster with good pop for his size who possesses more projection than most because of his athleticism. Murray is performing this year (.290/.390/.520 at publication) on the baseball field despite little prior in-game experience.

Murray was ranked 20th on FanGraphs’ 2018 Draft Board; his pre-draft report noted:

Despite [his limited playing time], he has been electric, showing even more physical ability than he had in high school and performing, slashing .290/.390/.550. He shows everything scouts could want to see after this kind of layoff and his only clear weakness is swing-and-miss against good off-speed stuff, both somewhat allowed with his power-based approach.

Take a look at that power-based approach for yourself:

One MLB executive, speaking with ESPN, even dropped the ultimate praise on Murray, comparing the young player to Mike Trout. \ Kyler Murray is a young, gifted hitter with star potential despite his rawness, which is why the A’s drafted him in the first round and gave him a $4.66 million signing bonus.

Read the rest of this entry »


Job Posting: MLB Advanced Media Internships

Please note, this posting contains two internship positions.

Intern with the technology, internet, interactive and mobile division of Major League Baseball. In 2015, MLB introduced Statcast, a revolutionary technology that tracks all movements on the field. Statcast automatically tracks every hit ball’s exit speed and distance, every fielder’s range, speed, and arm strength, and every base runner’s movement.

MLBAM is looking for summer interns to join in the continued development and evolution of Statcast. With a wealth of ground-breaking new data and metrics, they are looking for people who can analyze, validate and provide meaningful context around it. This is an excellent opportunity for anyone who has an interest in baseball statistics, metrics, and data.

Position: 2019 Summer Internship – Statcast Data Analytics

This position is located in New York, NY and is a paid internship.

Required Skills and Experience:

  • At a minimum current college sophomore entering junior year in the fall of 2019 or Current Grad or MBA student.
  • Baseball fan Strongly Preferred.
  • Proficiency in SQL, R, or Python.
  • Some familiarity with baseball tracking systems, especially Pitch F/X and Statcast.
  • Ability/desire to learn new skills and technologies quickly.
  • A self-starter that’s highly accountable and will take ownership of delivering your work.
  • Critical thinking skills and the ability to apply analytical insights to improve data.
  • Self-learner, independent, and have outstanding problem-solving skills.
  • Excellent written and verbal communication skills.

To Apply:
To apply, please visit this site and complete the LinkedIn application.

Position: 2019 Summer Internship – Data Science Internship, Baseball Data

This position is located in New York, NY and is a paid internship.

Basic Qualification:

  • Undergraduates and Masters students studying Computer Science, Statistics, Mathematics, or other relevant STEM degree.
  • A self-starter that’s highly accountable and will take ownership of delivering your work.
  • Ability/Desire to learn new skills and technologies quickly.
  • Experience with R, Python or SQL.

Preferred Skills:

  • Experience programmatically structuring and cleaning data, and not just analyzing highly cleaned data sets.
  • A strong foundation in probability, statistics, and algorithm development.
  • Understanding of statistical and predictive modeling techniques such as generalized linear modeling, decision trees, association rules, clustering, regression, machine learning, probability networks, and neural networks.
  • Experience with numpy, pandas, and scikit Python libraries.
  • Excellent verbal and written communication skills.
  • Ability and willingness to spend nights and weekends watching baseball while monitoring Statcast data.

To Apply:
To apply, please visit this site and complete the LinkedIn application.

The content in this posting was created and provided solely by MLBAM.


Job Posting: TrackMan Data Operations Intern

Position: TrackMan Data Operations Intern

Location: Stamford, CT

Join TrackMan Baseball’s Data Operations team as a paid intern for the 2019 baseball season. You will have a vital role in a growing, fast-moving, entrepreneurial company that is breaking new ground in sports. In this position, you will primarily be responsible for reviewing and verifying TrackMan data from a significant number of major and minor league baseball, NCAA, and international stadiums during the 2019 baseball season. This internship will give you the opportunity to progress with the company.

The internship starts in early February and finishes at the conclusion of the major league baseball season. Interns are expected to work 8 hours a day and 5 days a week, and weekend availability is required. An hourly rate of $12.50 will be offered.

About TrackMan Inc.
TrackMan Inc. is a US-based subsidiary of TrackMan A/S and is based in Stamford, CT, about 30 miles north of New York City. TrackMan A/S has developed a range of products for the golf market and is considered the gold standard in measurement of ball flight and swing path. TrackMan’s golf products are used by top touring professionals, teaching pros, broadcasters and governing bodies.

TrackMan, Inc. introduced 3D Doppler radar technology to the baseball industry and the technology is now used by all major league baseball organizations and is a component of MLB’s StatCast system. TrackMan, Inc. is revolutionizing baseball data and has been featured in publications such as the New York Times, Sports Illustrated, FanGraphs, and ESPN.

Requirements:

  • Thorough knowledge of baseball.
  • Proficiency in Microsoft Excel.
  • Strong attention to detail and ability to work well with others.

Desired Skills and Experience:

  • Bachelor or Master’s degree in Statistics, Mathematics or a related field.
  • Strong knowledge of databases, SQL, and R statistical software.
  • Python or other scripting language experience.

This is a great opportunity for anyone eager to break into the baseball community and acquire valuable experience with data available exclusively to professional baseball franchises. Based on your performance and openings within the company, you will also have the opportunity to continue working with TrackMan after the internship concludes. During the internship you will work with the entire TrackMan staff and gain further knowledge of how the company operates. Full training will be provided.

To Apply:
To apply, send a resume and cover letter to tol@trackman.com and copy cmc@trackman.com. No phone calls please.

The content in this posting was created and provided solely by TrackMan.


Sunday Notes: Jays Prospect Ryan Noda Channels Kevin Youkilis (and Joey Votto)

There’s a pretty good chance you haven’t heard of Ryan Noda. That may even be the case if you follow the team that took him in the 15th round of the 2017 draft. Playing in a Toronto Blue Jays system that boasts numerous top-shelf prospects, Noda is anything but a notable name.

Expect that to change if he continues to do what he’s been doing. In 803 professional plate appearances, the 22-year-old University of Cincinnati product is slashing — drum roll, please — a nifty .293/.451/.515.

Oh, that OBP.

Here’s a fun comp: In his first professional season, Kevin Youkilis had a .504 OBP in 276 plate appearances. In his first professional season, Noda had a .507 OBP in 276 plate appearances. Both former UC Bearcats were on-base machines in their second year as well, reaching base at .436 and .421 clips respectively. Read the rest of this entry »


Effectively Wild Episode 1309: Manager Overboard

EWFI
Ben Lindbergh and Jeff Sullivan banter about why there have been so many Noah Syndergaard trade rumors, then answer listener emails about whether Giancarlo Stanton would be better if he raised his launch angle, how and when a manager who kept intentionally walking hitters would be stopped, how and whether to debate saber skeptics (about Harold Baines, or anything else), Bryce Harper pulling a LeBron, how to identify pitches, and the definitions of “gas” and “inning,” plus a Stat Blast about J.T. Realmuto and the biggest career home/road splits.

Audio intro: T. Rex, "Life’s a Gas"
Audio outro: Saturday Looks Good to Me, "Keep Walking"

Link to Ben’s article about Baines
Link to guide to identifying pitches

 iTunes Feed (Please rate and review us!)
 Sponsor Us on Patreon
 Facebook Group
 Effectively Wild Wiki
 Twitter Account
 Get Our Merch!
 Email Us: podcast@fangraphs.com


Padres Land a Bargain in Kinsler

The Padres have been connected to big names like J.T. Realmuto, Noah Syndergaard, Nathan Eovaldi and even Bryce Harper, all of which suggests that after three straight seasons of 90-some losses and eight straight with records below .500, they’re ready to get out of the business of losing. So far, no dice on the marquee additions, and last winter’s big Eric Hosmer contract isn’t sitting so well, but on Friday, they did score something of a bargain, signing second baseman Ian Kinsler to two-year deal worth $8 million, with a club option of unspecified value also included, according to The Athletic’s Ken Rosenthal. The implication is that Kinsler’s days as an everyday player are numbered, and that he’s ready instead for that sage veteran mentor/utility role, à la Chase Utley with the Dodgers.

(Or maybe he just wants to knock back some quality craft beers and fish tacos. San Diego is great for that, but perhaps I’m just projecting.)

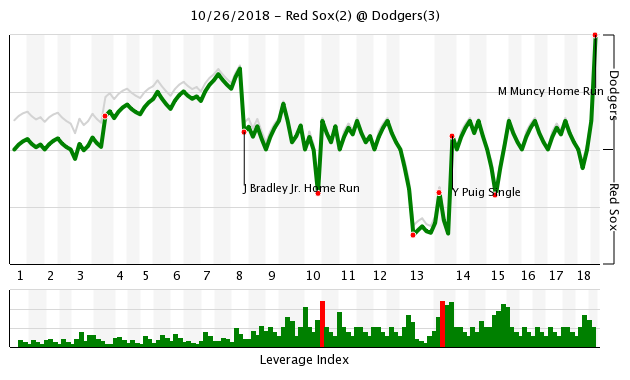
The 36-year-old Kinsler was last seen making a mess of things in the World Series, going 1-for-10 for the Red Sox and most notably committing base running and fielding gaffes in the epic, 18-inning Game 3. As pinch-runner for J.D. Martinez, he was thrown out at home plate on the back end of an inning-ending double play in the 10th, and then, after the Red Sox had taken the lead in the top of the 13th, he threw away a Yasiel Puig grounder that allowed the tying run to score. Not great. The Red Sox lost that game, and while they won the Series, Kinsler didn’t make another appearance.

Aside from winning that elusive championship ring, it really wasn’t a season to write home about for Kinsler. After being traded from the Tigers to the Angels last December 13 (for minor leaguers Wilkel Hernandez and Troy Montgomery), he scuffled, and once the Angels fell out of contention, he was dealt again on July 30, this time to Boston, in exchange for relievers Ty Buttrey and Williams Jerez. He had started the year so slowly that in June I explored whether he was cooked, though his bat perked up long enough for him to be of interest to a Dustin Pedroia-less Boston team that featured Eduardo Nunez and Brock Holt scraping by with replacement-level production. It must have been contagious, because Kinsler went from hitting .239/.304/.406 (97 wRC+) with 2.2 WAR in 391 PA with the Halos to .242/.294/.311 (62 wRC+) with 0.0 WAR in 143 PA with the Sox. The saving grace of his season was his defense; he was 9.4 runs above average according to UZR, 10 above average via DRS, and over the past two years, he’s been +17.5 and +16 by those two metrics while batting just .238/.308/.397 for a 90 wRC+ but 4.9 WAR. That’s still an above-average player, if not a terribly sexy one.

The bat is worrisome, though. According to Baseball Savant, Kinsler’s 85.3 mph average exit velocity ranked in the bottom 8% of the league, and his xwOBACON (expected wOBA on contact) plummeted from .350 in 2017 to .303 in 2018. As I noted in June, his downturn owes largely to two major problems: first, he’s struggled against four-seam fastballs, particularly ones 95 mph or higher; and second, he’s stopped hitting lefties. Despite a career 135 wRC+ against heaters as a group, he’s been at 88 and 94 over the past two seasons, and as for the high-velo stuff, here’s an updated version of a table I made for the previous article:

Ian Kinsler vs. 95+ MPH Four-Seam Fastballs
Year wOBA lg wOBA wOBA dif xWOBA lg xwOBA xwOBA dif
2015 .305 .309 -.004 .315 .311 .004
2016 .337 .315 .022 .353 .316 .037
2017 .223 .312 -.089 .298 .318 -.020
2018 .271 .306 -.035 .312 .308 .004
SOURCE: Baseball Savant

The trend isn’t uniform, but it isn’t good. Neither is hitting .191/.236/.250 for a 33 wRC+ in 144 PA against lefties, especially when you’re a righty. That aspect of his performance may well have been a fluke, the flip side of his .278/.357/.539 (135 wRC+) line against southpaws in 129 PA in 2017. For his career, he has a fairly typical split (127 wRC+ against RHP, 101 against LHP), but over the two-year period, his 81 wRC+ against lefties is in the 24th percentile among righty swingers, which is worrisome.

Here’s the thing, though: the Padres got less than nothing out of their second basemen in 2018. Jose Pirela, Carlos Asuaje, Cory Spangenberg and three other guys combined for a 78 wRC+ and -0.1 WAR at the spot. Spangenberg was released in November, and Asuaje was just claimed off waivers by the Rangers, so they’re out of the picture. Luis Urias, who hit .208/.264/.354 in 53 PA for the Pad squad, is the future, a 55 FV prospect who is currently number three on the Padres list (behind shortstop Fernando Tatis Jr and lefty MacKenzie Gore) and number 21 overall. He’s just 21 years old, though, and while MLB.com’s A.J. Cassavell recently reported that he’s expected to open the season at the keystone, it would surprise nobody if he were to start the year back in Triple-A. Since Tatis is just 19 and hasn’t played above Double-A (and has just 102 games there overall), there’s talk that Urias could even start the year at shortstop, a position he’s continued to spot-start at as he’s moved up the ladder.

All of which is to say that Kinsler, a 13-year veteran with 47.7 WAR, four All-Star appearances, and a pair of Gold Gloves to his name, could be Urias’ double play partner, or his placeholder, or his backup/mentor, depending upon how things unfold. He might even get a chance to play third base in a utility role, if and when both Tatis and Urias are in the bigs. Maybe he’ll become such a natural in this capacity that the Padres will view him as a surrogate dad, as some of the Dodgers did with Utley. The Padres’ padre? Why not?

Considering that Kinsler was projected to produce 1.8 WAR in 490 PA — though now, it would be a surprise if he got that much playing time — and that in our free agent preview the estimates for his salary ran for $6-8 million for a single season, two years and $8 million seems quite reasonable for San Diego. His presence probably won’t change the course of the Padres’ 2019 season, but if he helps Urias adapt to the majors and fulfill his potential, it’s a small price to pay.


The Alex Claudio Trade Tells Us a Lot

On the surface, Thursday’s trade that sent left-handed pitcher Alex Claudio from Texas to Milwaukee in exchange for a competitive balance pick seemed relatively innocuous. A rebuilding team sent a middle reliever to a competitive team that needed one in exchange for an asset — in this case, a draft pick — with a maturation timeline that better fits that of the rebuilding club. But this trade also might tell us a little more about how the Brewers think about pitching, and help us to calibrate the way we think about draft prospects, particularly advanced college relievers.

But first, let’s talk about Claudio, who is entering his first year of arbitration and will be under team control for three more. Kiley and I posited in the Brewers prospect list’s System Overview (it’s at the bottom) that Milwaukee seems drawn to pitching curiosities. This is, of course, our subjective opinion, but the list of Brewers draftees and minor leaguers who have weird deliveries or unique release points has grown to the point where it seems to be an organizational focus or, at least, an organizational experiment. And Claudio, for those who have not been lucky enough to see him pitch for Texas over the last few years, looks like this:

It’s not easy to make big league hitters look goofy under normal circumstances, let alone when you only throw 86 mph. It’s clear the bizarre nature of Claudio’s delivery plays a role in his success. For context, here’s how Claudio’s release point looks on paper when given some context. Here I’ve compared Claudio’s release point to a lefty with a pretty generic delivery.

The proliferation of Trackman at the minor league and college levels enables teams to measure things like release point, and identify players who are bizarre or unique in this regard. Extension probably factors into this, as well, and I think adding that could enable us or teams to plot release points in three dimensions, and learn even more about what helps stuff play beyond just velocity and movement.

Claudio is also effective because he’s a rare reliever with plus-plus command. He’s walked just 4.5% of hitters during each of his three years in the big leagues and, when he misses, he misses down. His ability to dump sinkers and changeups into the bottom part of the strike zone or just beneath it and almost never, ever miss up in the zone is remarkable, and it’s a huge part of why Claudio has been able to induce ground balls at a 60% clip in the big leagues.

Teams have begun to think about pitching like wine and cheese. They’re more concerned about how pitches pair together rather than just evaluating each pitch’s quality in a vacuum. A general rule of thumb is that sinking fastballs pair well with changeups because they have similarly shaped movement, sinking and running toward the pitcher’s arm side. And again, Claudio is a great example of this, with his fastball and changeup movement overlapping exactly.

We know what Claudio is at this point. He’s going to be a good middle relief option whose WAR production will likely hover around 1.0, perhaps maxing out close to the 1.7 WAR he netted in 2017. Based on how we map WAR to the 20-80 scouting scale, Milwaukee got a 40-45 FV player for the next three years. Mapping Claudio’s WAR production to the scouting scale helps us make an apples to apples comparison in situations where we otherwise would not be able to, as in this instance, where Claudio was traded, straight up, for a draft pick.

The competitive balance pick Texas received from Milwaukee is going to be close to the 40th overall selection in the draft, give or take a few spots depending on how free agent compensation picks shake out ahead of that selection. As you can see from our last several years of MLB Draft evaluations (here’s 2018), that 40th overall range is typically right about where the 45 FV and 40 FV tiers blend together, which is akin to Claudio’s value when he’s placed on the 20-80 scale. In short, based on how we think about relievers and how we expected draft prospects in the late first and early second round to pan out, this seems like a fair, logical trade for both teams.

In every draft there are a few college pitchers who seem like they could pitch in a big league relief role right away. It’s almost never a plan teams actually enact for various reasons, but this trade also gives us an idea of where that type of prospect would go in a draft. It would take a confluence of variables for such a selection to be made (a team with a relief need, a very seller-friendly or completely barren reliever trade market that forces that team to turn to the draft, and a specific type of prospect) but this part of the draft is where the drop-off in potential ceiling could lead teams to focus on other traits, like proximity and risk. In other words, the Brewers seem to have told us who they’d take in June if given the choice between this theoretical college arm and, say, a high school hitter whose career is much harder to predict.


The Standard Reliever Contract Is Back

Last season, the relief market was the only aspect of free agency that moved quickly. Of the first 14 free agents to sign last winter among the Top 50 players available, eight were relief pitchers (nine if we count Mike Minor). All eight received similar contracts for two, sometimes three, seasons, and around $7 million to $10 million per year. In “deals that were announced at 2 AM the night before everyone at FanGraphs left the Winter Meetings and spent most of Thursday on airplanes,” we have two free agent reliever signings that meet the qualifications for that standard reliever contract.

Let’s address both Jeurys Familia and Joe Kelly’s new deals in turn. Read the rest of this entry »


Jake Bauers on Hitting (It’s Pure Reaction)

What type of hitter did the Cleveland Indians get when they acquired Jake Bauers as part of yesterday’s three-team trade with Seattle and Tampa Bay? From a biographical perspective, the answer is a 23-year-old left-handed-hitting first baseman who came into this year ranked fourth in the Tampa Bay system. He made his big-league debut in June and went on to post a .700 OPS, with 11 home runs, in 388 plate appearances. Bauers played his maiden season as a 22-year-old, not turning 23 until the month of October.

From a self-assessment perspective, Bauer is a hitter who knows who he is, and needs to stay true to those elements in order to be successful. The newest member of the Indians organization explained what those elements are when the Rays visited Fenway Park this past August.

———

Bauers on his keep-it-natural swing: “My swing has just kind of been natural. Any time I went to a hitting coach growing up, the only thing they’d say is, ‘Don’t change anything.’ Beyond that, there have maybe been little tweaks here and there, but mostly it’s been about doing my work and staying right.

“I have to keep my swing and just let it happen. I have to trust that the natural path of my swing is going to take over — that by doing what comes natural, everything will take care of itself.

“When I’m trying to hit the ball in the air — trying to hit for launch angle — my swing tends to get long and loopy and I end up not getting the result I want. Everything will get out of sync. My hips will go early. My hands will drag behind and then try to catch up. I’ll end up pulling off to where I can’t reach the outside pitch and I’m getting jammed on the inside pitch.” Read the rest of this entry »