Below is an analysis of the prospects in the farm system of the Philadelphia Phillies. Scouting reports were compiled with information provided by industry sources as well as my own observations. This is the fourth year we’re delineating between two anticipated relief roles, the abbreviations for which you’ll see in the “position” column below: MIRP for multi-inning relief pitchers, and SIRP for single-inning relief pitchers. The ETAs listed generally correspond to the year a player has to be added to the 40-man roster to avoid being made eligible for the Rule 5 draft. Manual adjustments are made where they seem appropriate, but we use that as a rule of thumb.
A quick overview of what FV (Future Value) means can be found here. A much deeper overview can be found here.
All of the ranked prospects below also appear on The Board, a resource the site offers featuring sortable scouting information for every organization. It has more details (and updated TrackMan data from various sources) than this article and integrates every team’s list so readers can compare prospects across farm systems. It can be found here. Read the rest of this entry »
The following article is part of Jay Jaffe’s ongoing look at the candidates on the BBWAA 2024 Hall of Fame ballot. For a detailed introduction to this year’s ballot, and other candidates in the series, use the tool above; an introduction to JAWS can be found here. For a tentative schedule, see here. All WAR figures refer to the Baseball-Reference version unless otherwise indicated.
2024 BBWAA Candidate: Adrián González
Player
Pos
Career WAR
Peak WAR
JAWS
H
HR
AVG/OBP/SLG
OPS+
Adrián González
1B
43.5
34.6
39.1
2,050
317
.287/.358/.485
129
SOURCE: Baseball-Reference
Joe Mauer isn’t the only number one pick on this year’s ballot. In 2000, one year before the Twins took Mauer with the first pick, the Marlins used the top pick to select Adrián González out of Eastlake High School in Chula Vista, California. He would turn out to be one of the more successful number one picks, making five All-Star teams, winning four Gold Gloves, and receiving MVP votes in eight different seasons in his 15-year major league career spent with the Rangers, Padres, Red Sox, Dodgers, and Mets. He never played a major league game for the Marlins, however, and was traded five times, including twice at the center of his era’s biggest blockbusters. Along with his two older brothers, he also continued the legacy of his father, David González Sr., by representing Mexico in international competition.
Adrián Sabin González was born on May 8, 1982 in San Diego, California, the youngest of three sons of David and Alba González. His father had been a star first baseman in his own right for the Mexican National Team, and when the family lived in San Diego, he commuted daily across the border to Tijuana, Mexico, where he owned a successful air conditioning business. All three of the couple’s sons were born in the United States and all three would play baseball. The oldest, David Jr., was a shortstop who made it as far as college baseball but injured his arm and never played professionally. The middle son, Edgar (b. 1978), had a 15-year professional career himself (2000-15), including two seasons as Adrián’s teammate in San Diego. Read the rest of this entry »
Last year, the Cincinnati Reds surprisingly vaulted into contention thanks to an ascendant crop of young position players. Led by Matt McLain, Reds rookie hitters accrued 7.6 WAR, tops in the majors. Yet, their postseason bid ultimately fell short; while the Reds ran a middle-of-the-pack offense with a 98 wRC+ (17th in the bigs), their pitching flopped. Even park-adjusted ERA-, which removes claustrophobic Great American Ball Park from the equation, pegged them as the eighth-worst staff in the majors with a 105 mark.
Cincinnati’s cache of young hurlers was supposed to serve as a complement to the team’s potential-filled lineup. But pitching is a fickle beast, and the Reds’ staff was dogged by injuries and inconsistency in 2023. Now, they’ve added Frankie Montas, the poster child of injuries and inconsistency, to that group. Read the rest of this entry »
The Cubs made the first big splash of the offseason by purloining Craig Counsell, widely regarded as one of the top managers in baseball, from the division rival Brewers, under the nose of the voracious, all-consuming Mets. On January 2, the Cubs introduced Counsell’s major league coaching staff. Right-handed pitcher Colten Brewer will also be joining the team in 2024.
But Counsell’s signing was supposed to herald a big and flashy offseason, a statement of intent that the Cubs were set to return to the forward-thinking, all-conquering form that made them such a force in the National League in the middle of the last decade. But the Cubs’ most recent trade was November 6. Their most recent major league free agent signing was Edwin Ríos, on February 17 of last year. That assumes Brewer is on a minor league deal; he’s pitched in the majors in five of the past six seasons, but he broke his own signing on Instagram rather than going through the agent-to-newsbreaker pipeline.
Having a quiet offseason so far is not necessarily a bad thing. There’s plenty of winter left, and plenty of free agents still on the board. Besides, maybe Jed Hoyer is doing a bit based on the fact that the team’s mascot is a bear and bears hibernate. That’d be sick. If there are two things I love, it’s hibernating and overcommitting to a bit. Read the rest of this entry »
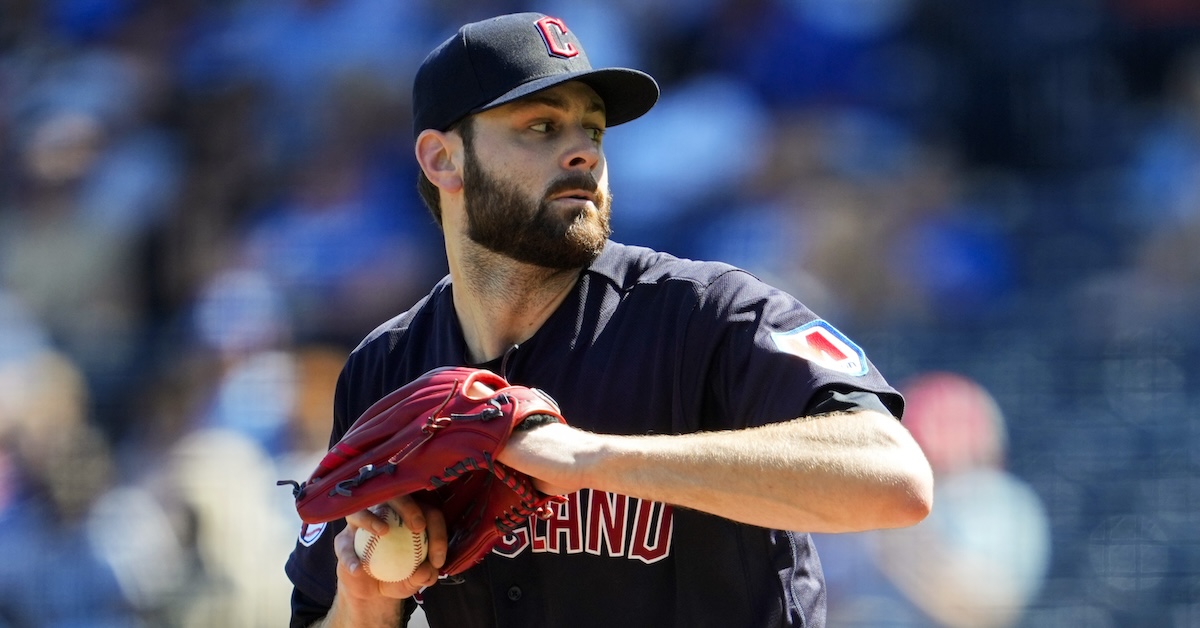
After running his highest FIP since his breakout season in 2019, Lucas Giolito has secured a modified prove-it deal. Over the holidays, the right-hander signed a two-year contract with the Boston Red Sox worth $38.5 million. He will make $18 million in the first season and $19 million in the second; he can opt out after 2024. If he elects not to opt out, a conditional option kicks in for the 2026 season that is dependent on whether he throws at least 140 innings in 2025. If he does, it becomes a mutual option worth $19 million; if he doesn’t, it becomes a $14 million club option.
Despite Giolito’s 4.88 ERA, 5.27 FIP, and 41 home runs allowed (second to only Lance Lynn) in 2023, he was still perceived as a mid-rotation option entering free agency. Much of that was due to his above-average performance from 2019-21, but he has also proven he can stay healthy and make his starts. Since 2021, he is 16th in the league in innings pitched. His 184.1 IP with the White Sox, Angels, and Guardians in 2023 only further cemented his reputation. With Boston ranking second-to-last in the American League in starter innings pitched behind only Oakland, this was a practical match that came at a reasonable cost.
Giolito’s $19.25 million AAV is fifth among starting pitchers who have signed free agent contracts this offseason (excluding Shohei Ohtani), placing him in between the top and middle tier. Given that he hasn’t reached his 30th birthday, it seems plausible that he can keep up his volume while potentially improving his results and returning to the starter he was for a three-year stretch in Chicago.
After his first start with the Guardians in September (he was famously scooped up off waivers from the Angels, who had acquired him from the White Sox just five weeks prior), Giolito spoke with David Laurila about his season and impending free agency. In that conversation, Giolito was candid about his lack of execution in 2023, and how he hadn’t been able to command the anchor of his arsenal, his fastball-changeup combination. Giolito expressed that he wants to consistently command his heater up in the zone; for the changeup, the goal is more competitive pitches in the zone. Like any fastball-changeup combo, helping one will inherently help the other. As a high-release, big-extension pitcher, this is a natural path for Giolito, especially considering that the blueprint has already worked. To better understand how his fastball has fluctuated in recent seasons, let’s look at some qualities of the pitch:
Giolito Four-Seamer Characteristics
Year
Run Value
Vert. Rel
Hor. Rel
Vert. Location
Hor. Location
2019
15.3
6.56
-1.26
2.74
0.14
2020
5.8
6.49
-1.26
2.91
0.22
2021
-0.4
6.40
-1.5
2.81
0.02
2022
0.3
6.36
-1.39
2.85
0.10
2023
-7.7
6.33
-1.19
2.93
-0.07
His fastball plays best when it’s at the top of the zone. Interestingly, his fastball was located higher on average in 2023 than in any other season since 2019 but was by far the worst in terms of value, though I’m not sure that was the primary reason for his struggles. Instead, I’d look to his horizontal location, and the trend of him throwing his heater closer to righties and further away from lefties. Since his breakout in 2019, Giolito had always neutralized left-handed batters, with his fastball-changeup combo the reason. Lefties had never posted a wOBA above .283 against him; that mark jumped to .334 in 2023. By moving the pitch further to the edge (likely due to his release point change), his two-pitch combo lost some of its in-zone consistency, especially the changeup. The trend started in 2022, and even with a slight bounce back this year, the changeup still struggled:
Giolito Changeup Characteristics
Year
Run Value
Vert. Rel
Hor. Rel
Vert. Location
Hor. Location
2019
10.9
6.52
-1.31
2.14
-0.10
2020
1.7
6.48
-1.33
1.88
-0.12
2021
10.8
6.36
-1.59
2.04
-0.19
2022
-7.0
6.35
-1.44
1.88
-0.16
2023
0.6
6.29
-1.31
1.88
-0.27
Similar to the heater, the pitch moved progressively further toward righties as its performance dipped. In the two seasons where Giolito threw the pitch at its highest height on average, it’s been the most effective. Given Giolito’s tendency to keep the fastball up, a higher tunnel with the changeup is logical. But going back to its in-zone utility, 2022 and 2023 saw him have in-zone rates below 50% (45.0% and 49.2%, respectively) after he ran the pitch in the zone between 51.3% and 59.1% from 2019 to 2023. The nature of the tunnel is most deceptive when he can keep the pitch in the strike zone. All of this to say, the story that Giolito told Laurila a few months ago tracks very well. The question now is what he and the Red Sox can do to flip things back to what they were during his very good three-year run in Chicago.
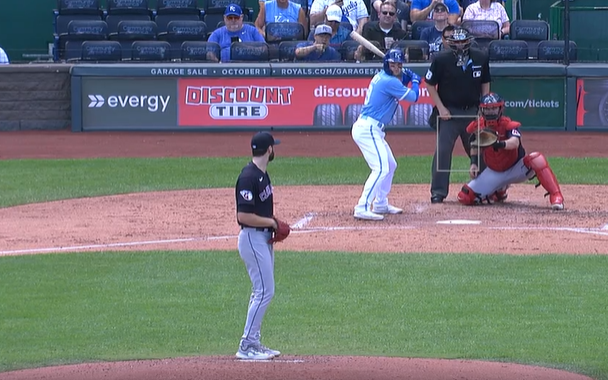
Without any making any mechanical changes, my first thought would be to shift Giolito to the first base side of the rubber to ensure his pitches are moving on the side of the plate where he had success. Seems foolproof, right? The thing is, he has been on this side of the rubber for years. He can’t go any further! Here is a screenshot from a late September start:
Next, we might look to something mechanical that has had a direct impact on where he is releasing the ball or the angle his arm is at when he releases it. That makes me think of what we know about Giolito in general and what he did to become the pitcher he was from 2019-21. The most obvious thing is his abbreviated arm action. A big piece of unlocking his performance was getting his arm swing timing in line with the rest of his body by shortening it. If he got out whack in the last two seasons, perhaps it’s related to this, even if it’s not as drastic as his early career form. To analyze that, let’s do a video comparison of Giolito in 2021 versus 2023. The first two clips are from 2021 and the next two are 2023:
His arm was late during his run in Cleveland. Visually, when his lead foot stabilized on the ground, his forearm was still below 45 degrees. Ben Brewster from Tread Athletics has stated that an “on time” arm is between 45 to 90 degrees at contact/stabilization, while slightly late is from 25-45, and late is less than 25. In both Cleveland clips, Gio’s arm is hardly getting to 25 degrees when his lead leg block contacts the ground. In Chicago, he is hovering somewhere around 60 degrees, give or take.
Basically, we know what Giolito’s arm looks like when it’s on time. When looking at where he was in Cleveland, it’s clear he was later than is ideal for him. In terms of release point and command, it makes sense that he has lost some feel. His arm is in a different position than when he was succeeding. Trying to execute the same game plan with this difference, even if it is slight, can be difficult. The good news is that this change hasn’t affected his health or ability to maintain volume. The bad news is that if his body isn’t as mobile in some areas as it was in his mid-20s, these positions might not be as attainable.
Even if Giolito doesn’t make a return to his peak form from a few years ago, he is still a positive addition for the Red Sox. As their rotation is currently constructed, it’s highly plausible that he will lead the team in innings, as no other pitcher on the roster has ever thrown more than 180 in their respective careers. Giolito is a good start to raising their floor, but they need a sure-thing, high-quality pitcher. And while Chris Sale isn’t that pitcher anymore, trading him to Atlanta only further increases their need. What they do from here on will depend on their willingness to open their pocket book or deal from their core of position player prospects.
For the 20th consecutive season, the ZiPS projection system is unleashing a full set of prognostications. For more information on the ZiPS projections, please consult this year’s introduction and MLB’s glossary entry. The team order is selected by lot, and the next team up is the Arizona Diamondbacks.
Batters
Last year, I noted in this space that I had to double-check the Diamondbacks’ ZiPS projections, as the computer seemed surprisingly optimistic about Arizona’s outlook. It turned out to be a little too optimistic, though I was wrong about the relative strength of the Giants and Padres, who both finished below the Snakes in the standings (though you can quibble about how good the Padres actually were in 2023).
Naturally, since ZiPS had a sunny view of Arizona then, it’s certainly not going to be less sunny now that a lot of the things the system liked have came to pass. Looking at the 2024 projections as a whole, they actually feels very Cardinals-y, and not in the sense of the 2023 Cardinals. The projections from top to bottom are quite steady, in the manner of a good Cards team, with a lot of positional flexibility on the roster and a solidly above-average projected defense from bow to stern. Read the rest of this entry »
Ben Lindbergh and Meg Rowley recap news and transactions from over the holidays, including Yoshinobu Yamamoto’s thoughts on San Francisco and Yu Darvish’s thoughts on the Dodgers signing his WBC teammates, the Mariners signing Mitch Garver, the Reds signing Frankie Montas, a smattering of Blue Jays and White Sox signings, the Estevan Florial trade, and the retirement of Andrelton Simmons. Then (49:19) they discuss the Lucas Giolito signing and the Chris Sale trade before segueing into a Stat Blast (1:07:05) about the evolution of starting-pitcher workloads, volume vs. efficiency, and what an “innings eater” is in 2024.
The best defense is a good offense. As much as the pacifist in me hates to admit it, the old platitude is true. Many have tried to flip this popular saying in a sports context, suggesting instead that the best offense is a good defense, but that’s just patently false. No matter how terrific a team’s run prevention abilities may be, they can’t win a ballgame without scoring at least once. Conversely, it doesn’t matter how many runs a team concedes as long as their offense can score even more. As such, I’d embrace the strategic offensive principle of war (or should I say WAR) more readily than I’d accept its antimetabole.
Nevertheless, Kevin Kiermaier and Isiah Kiner-Falefa are the kinds of players who make the patently false seem true. Kiermaier is the greatest center fielder of the modern statistical era; no other outfielder comes within 10 points of him in either DRS or OAA. His defense makes a convincing argument that players should earn bonus points for impossible catches and spectacular throws.
Kiner-Falefa, meanwhile, is the consummate picture of defensive versatility. He’s the first player since the turn of the 20th century to play at least 50 career games at catcher, shortstop, and in the outfield – not to mention 154 games at third base, 21 appearances at second, and four innings pitched as the cherry on top. In 2018, a then-23-year-old Kiner-Falefa became the first player to start multiple games at catcher and shortstop in the same season since Dave Roberts (not thatDave Roberts) and Derrel Thomas in 1980. Add in the fact that he also started multiple games at second and third base the same year, and he’s the first player to have done all that since Marty Martinez in 1968. Read the rest of this entry »
The Mariners have made their first significant upgrade of the offseason, inking Mitch Garver to a two-year deal worth $24 million. Formerly a member of the Twins and Rangers, the soon-to-be 33-year-old Garver first made a name for himself in the peak of the juiced ball era, clubbing 31 homers in just 93 games while slugging .630 in his 2019 campaign. He hasn’t reached such heights since, but Garver has remained an offensive threat, even as he’s struggled to stay healthy and demonstrate his prowess over a full season.
Let’s take a look at the best-hitting catchers of 2023. In the modern era of lower catcher workloads and backstops moonlighting at first base, DH, and even in the outfield, you can define “best-hitting catcher” in many ways. But for now, I’ll just use primary catchers as defined by our leaderboards:
On the surface, Garver was the best offensive catcher in the league, along with former teammate Ryan Jeffers, who broke out in his first season as Minnesota’s “primary” backstop (his 82 starts behind the plate were barely a majority). Michael Baumann pointed out last month that Garver is masterful at waiting for his pitch and then pulling it out of the yard. Those pitches are usually fastballs, which he’s crushed with authority throughout his career to the tune of a +51 run value. Over time, pitchers have picked up on his tendencies, throwing him breaking balls at a 98th-percentile rate. And while 2023 marked an improvement in his results against bendy stuff, Garver’s success in spite of this has come thanks to his selective aggression, patiently waiting for heaters in his wheelhouse. Read the rest of this entry »
On December 26, the New York Yankees sent 26-year-old outfielder Estevan Florial to the Cleveland Guardians in exchange for 27-year-old reliever Cody Morris.
Florial has appeared in parts of four big league seasons but has never had more than 71 plate appearances in any one of them. He’s accumulated enough playing time to lose rookie eligibility but not enough to evaluate him based on his big league performance; he’s still more or less an older prospect. I considered Florial to be one of the Yankees’ best couple of prospects in the 2018-19 window, but his strikeouts became excessive at the upper levels (usually hovering around 30%) and, especially after the pandemic season, I began to move off of him. After a rough introduction to Triple-A in 2021, Florial has had two really solid seasons, with a wRC+ in the 124-130 range each of the last two years. He experienced a substantial uptick in his power output as a 25-year-old at Triple-A Scranton in 2023, as Florial clubbed 25 homers in just 101 games, matching his combined Triple-A total from 2022 and 2021 across 180 games. Read the rest of this entry »