For the 18th consecutive season, the ZiPS projection system is unleashing a full set of prognostications. For more information on the ZiPS projections, please consult this year’s introduction and MLB’s glossary entry. The team order is selected by lot, and the next team up is the Chicago Cubs.
Batters
When you look at Chicago’s offense, you see a lot of the parts of a 90-win team, but not all of the parts. It’s sort of like a birthday cake that’s been frosted, but lacks any decorations. It’s edible, but it isn’t really exciting quite yet. First base and third base are decidedly meh-minus positions, and I feel for poor Matt Mervis, since he keeps projecting for fewer plate appearances than a much worse-projected starter. (Incidentally, I’m only about 80% sure that Matt Mervis isn’t actually Matt Murton with a dye job and some cosmetic surgery trying to get some more service time in.) I’d still like to see the Cubs add at least one 1B/DH option before the season starts, someone like Michael Conforto. Unfortunately, the options there are dwindling.
Don’t get too alarmed by the Ian Desmond comp for Dansby Swanson. Individual comps are 99.9% fun and 0.1% meaningful compared to the large cohort of similar players, and in any case, Desmond aged even worse than the projections thought and Swanson gets a lot of his value from defense, which Desmond didn’t outside of the ability to stand at shortstop for awhile. I feel bad for Nick Madrigal, who had a second season ruined by an injury, this time to his groin, but a team trying to become more competitive can’t just hang around and wait to see if he can make his retro-1960s game actually work. I hope he eventually gets to a lousy team that has the flexibility to look at him. It’s hard to fault the Cubs for not giving him a lot of rope; he wasn’t a guy who came up through the organization and the player traded for him and Codi Heuer, Craig Kimbrel, isn’t someone the Cubs grumble about missing.
The funny thing about Cody Bellinger is that he’s probably a bit underrated overall right now. He had an abysmal 2021 and while one can hardly characterize his ’22 as a triumphant return to his prior glory, he was an acceptable starter in center field. Since he was a legitimate MVP-type just a few years ago, that’s always going to feel bad. Still, he’s 27, not 37, so the projection reflects that there’s at least some chance he has that upside still lurking in his bat somewhere.
Pitchers
ZiPS doesn’t see huge upside for literally anyone in the rotation, but it does see the top three of Marcus Stroman, Justin Steele, and Jameson Taillon as a very stable group. I’m certainly not putting the over/under for Taillon’s playing time anywhere near what’s on the depth chart, however. Sadly, ZiPS does not see Kyle Hendricks as more than a back-of-the-rotation innings-eater at this point in his career, but at least that’s the role he’s expected to fill now, rather than being the team’s de facto ace. Wade Miley is also a cut above the usual fourth/fifth starter [And is a free agent, duh. I had Drew Smyly on the brain. — DS], and ZiPS is a fan of some of the emergency options, like prospect Ben Brown (who I believe will end up in the ZiPS Top 100 prospects this year, though I’m not positive). ZiPS isn’t in on Hayden Wesneski yet, and I think I like him better than the projection does.
The bullpen looks to be a rather mediocre group, with few outright disasters in the projections, but also no real top-tier out-makers for high-leverage innings. Mark Leiter Jr. comes closest; if projected as a full-time reliever, he comes out forecast for a 3.07 ERA. ZiPS joins Steamer in its fascination with hard-throwing reliever Jeremiah Estrada.
In the AL East or NL West, this might be a team fighting for fourth place. But in the NL Central, the Cubs look a team that’s somewhere around .500, and the side of that record they finish on may come down to what happens on the injury front. The Cardinals and Brewers are still better, but it’s close enough that if the right cards flip over, the Cubs could make things interesting. Right now, I think they’re still one star away from forcing the division into a three-way dance.
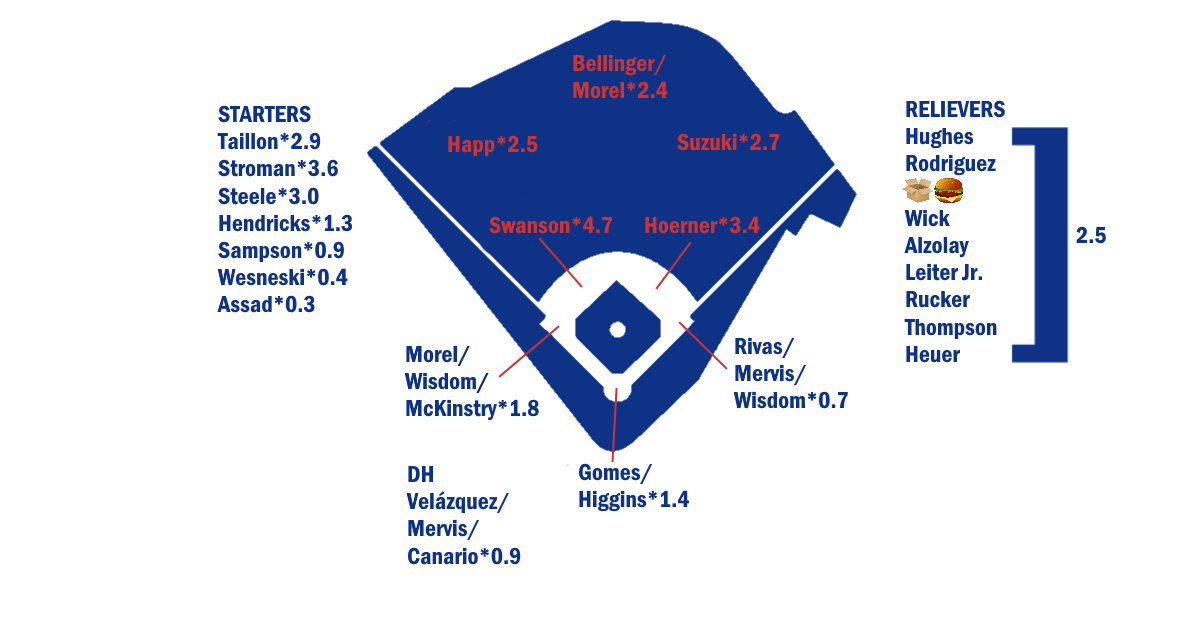
Ballpark graphic courtesy Eephus League. Depth charts constructed by way of those listed here.
Batters – Advanced
| Player |
PA |
BA |
OBP |
SLG |
OPS+ |
ISO |
BABIP |
Def |
WAR |
wOBA |
| Dansby Swanson |
644 |
.259 |
.323 |
.436 |
106 |
.177 |
.318 |
9 |
4.5 |
.327 |
| Nico Hoerner |
469 |
.273 |
.326 |
.384 |
94 |
.111 |
.302 |
8 |
2.8 |
.309 |
| Ian Happ |
585 |
.244 |
.329 |
.428 |
105 |
.184 |
.301 |
4 |
2.3 |
.328 |
| Seiya Suzuki |
466 |
.267 |
.352 |
.488 |
127 |
.221 |
.321 |
-3 |
2.3 |
.358 |
| Cody Bellinger |
525 |
.230 |
.309 |
.406 |
94 |
.176 |
.274 |
4 |
2.1 |
.307 |
| Rafael Ortega |
412 |
.252 |
.331 |
.405 |
101 |
.153 |
.303 |
3 |
2.0 |
.321 |
| Patrick Wisdom |
475 |
.214 |
.300 |
.444 |
100 |
.230 |
.281 |
-2 |
1.8 |
.320 |
| Miles Mastrobuoni |
528 |
.266 |
.330 |
.376 |
93 |
.110 |
.328 |
-2 |
1.5 |
.310 |
| Alexander Canario |
517 |
.220 |
.281 |
.419 |
88 |
.199 |
.292 |
0 |
1.4 |
.301 |
| Matt Mervis |
543 |
.253 |
.311 |
.448 |
105 |
.196 |
.295 |
1 |
1.4 |
.325 |
| Andrelton Simmons |
350 |
.245 |
.300 |
.298 |
65 |
.053 |
.285 |
12 |
1.3 |
.269 |
| Franmil Reyes |
505 |
.246 |
.305 |
.458 |
105 |
.211 |
.313 |
-2 |
1.3 |
.325 |
| Christopher Morel |
516 |
.231 |
.296 |
.418 |
93 |
.186 |
.309 |
-3 |
1.2 |
.308 |
| Nick Madrigal |
347 |
.273 |
.327 |
.342 |
84 |
.069 |
.298 |
4 |
1.2 |
.297 |
| Pete Crow-Armstrong |
478 |
.244 |
.297 |
.389 |
86 |
.145 |
.317 |
1 |
1.1 |
.297 |
| Ben DeLuzio |
398 |
.235 |
.302 |
.352 |
79 |
.116 |
.320 |
4 |
1.1 |
.289 |
| Zach McKinstry |
409 |
.252 |
.319 |
.407 |
97 |
.154 |
.311 |
-7 |
1.0 |
.314 |
| Yan Gomes |
302 |
.243 |
.291 |
.389 |
84 |
.146 |
.278 |
2 |
1.0 |
.293 |
| Kevin Alcantara |
472 |
.227 |
.288 |
.374 |
80 |
.146 |
.315 |
3 |
1.0 |
.287 |
| Esteban Quiroz |
282 |
.225 |
.335 |
.371 |
93 |
.146 |
.287 |
-1 |
0.9 |
.313 |
| Levi Jordan |
368 |
.234 |
.292 |
.344 |
74 |
.110 |
.290 |
5 |
0.8 |
.280 |
| Robel Garcia |
303 |
.211 |
.290 |
.389 |
84 |
.178 |
.304 |
1 |
0.6 |
.295 |
| Kevin Made |
390 |
.226 |
.280 |
.337 |
68 |
.111 |
.291 |
2 |
0.5 |
.272 |
| Jake Slaughter |
439 |
.231 |
.296 |
.354 |
77 |
.123 |
.312 |
0 |
0.5 |
.287 |
| Chase Strumpf |
436 |
.191 |
.296 |
.324 |
70 |
.133 |
.302 |
2 |
0.5 |
.279 |
| Brennen Davis |
424 |
.214 |
.297 |
.354 |
78 |
.140 |
.302 |
6 |
0.5 |
.289 |
| Yonathan Perlaza |
497 |
.233 |
.300 |
.390 |
87 |
.157 |
.305 |
1 |
0.5 |
.299 |
| Frank Schwindel |
396 |
.257 |
.298 |
.422 |
94 |
.165 |
.289 |
0 |
0.4 |
.308 |
| David Bote |
333 |
.222 |
.297 |
.354 |
78 |
.131 |
.294 |
-1 |
0.4 |
.286 |
| Luis Vazquez |
415 |
.231 |
.274 |
.324 |
63 |
.093 |
.308 |
4 |
0.3 |
.263 |
| P.J. Higgins |
328 |
.238 |
.313 |
.352 |
82 |
.114 |
.307 |
2 |
0.1 |
.294 |
| Michael Hermosillo |
240 |
.208 |
.305 |
.353 |
80 |
.145 |
.303 |
-4 |
0.1 |
.293 |
| Nelson Velázquez |
440 |
.223 |
.284 |
.399 |
84 |
.176 |
.319 |
-9 |
0.0 |
.294 |
| BJ Murray Jr. |
370 |
.226 |
.314 |
.330 |
77 |
.104 |
.300 |
1 |
-0.1 |
.289 |
| Donnie Dewees |
270 |
.244 |
.305 |
.382 |
87 |
.138 |
.281 |
-4 |
-0.2 |
.300 |
| Carlos Sepulveda |
335 |
.220 |
.293 |
.267 |
55 |
.047 |
.284 |
3 |
-0.2 |
.256 |
| Andy Weber |
358 |
.221 |
.275 |
.299 |
57 |
.079 |
.320 |
1 |
-0.2 |
.254 |
| Darius Hill |
497 |
.258 |
.297 |
.351 |
77 |
.092 |
.302 |
2 |
-0.2 |
.283 |
| Tyler Payne |
251 |
.221 |
.260 |
.319 |
58 |
.098 |
.301 |
-1 |
-0.2 |
.253 |
| Bryce Ball |
506 |
.217 |
.296 |
.344 |
75 |
.126 |
.295 |
3 |
-0.3 |
.283 |
| Miguel Amaya |
268 |
.209 |
.302 |
.325 |
72 |
.115 |
.280 |
0 |
-0.3 |
.282 |
| Jordan Nwogu |
373 |
.219 |
.287 |
.361 |
76 |
.142 |
.305 |
-7 |
-0.3 |
.284 |
| Alfonso Rivas |
429 |
.232 |
.315 |
.322 |
76 |
.090 |
.323 |
-1 |
-0.4 |
.286 |
| Nelson Maldonado |
373 |
.241 |
.285 |
.362 |
76 |
.121 |
.303 |
0 |
-0.4 |
.282 |
| Zach Davis |
247 |
.216 |
.286 |
.252 |
50 |
.036 |
.318 |
-2 |
-0.4 |
.247 |
| Greg Deichmann |
369 |
.204 |
.274 |
.315 |
61 |
.111 |
.303 |
-1 |
-0.4 |
.262 |
| Bryce Windham |
280 |
.230 |
.309 |
.302 |
69 |
.073 |
.278 |
-8 |
-0.4 |
.277 |
| Ed Howard |
239 |
.209 |
.251 |
.276 |
44 |
.067 |
.308 |
0 |
-0.5 |
.234 |
| Luis Verdugo |
400 |
.220 |
.273 |
.306 |
59 |
.087 |
.284 |
-1 |
-0.6 |
.257 |
| Christian Donahue |
202 |
.189 |
.245 |
.249 |
36 |
.059 |
.283 |
1 |
-0.7 |
.223 |
| Trent Giambrone |
343 |
.196 |
.265 |
.288 |
52 |
.093 |
.275 |
-1 |
-0.7 |
.247 |
| Bradlee Beesley |
215 |
.204 |
.256 |
.323 |
57 |
.119 |
.289 |
-2 |
-0.8 |
.255 |
| Yeison Santana |
310 |
.219 |
.290 |
.262 |
53 |
.043 |
.299 |
-2 |
-0.8 |
.253 |
| Jackson Frazier |
353 |
.217 |
.300 |
.351 |
78 |
.134 |
.311 |
-8 |
-0.8 |
.289 |
| Jake Washer |
232 |
.201 |
.246 |
.333 |
57 |
.132 |
.298 |
0 |
-0.8 |
.253 |
| Fabian Pertuz |
442 |
.206 |
.245 |
.297 |
48 |
.091 |
.282 |
-1 |
-1.0 |
.238 |
| Cole Roederer |
293 |
.211 |
.271 |
.331 |
64 |
.120 |
.298 |
-3 |
-1.0 |
.263 |
| D.J. Artis |
257 |
.199 |
.292 |
.283 |
59 |
.084 |
.296 |
-9 |
-1.0 |
.263 |
| Yohendrick Pinango |
509 |
.239 |
.273 |
.338 |
66 |
.099 |
.291 |
-1 |
-1.0 |
.267 |
| Pablo Aliendo |
361 |
.211 |
.270 |
.305 |
57 |
.094 |
.290 |
-10 |
-1.1 |
.256 |
| Scott McKeon |
228 |
.174 |
.239 |
.227 |
29 |
.053 |
.302 |
0 |
-1.1 |
.214 |
| Owen Caissie |
414 |
.199 |
.271 |
.302 |
57 |
.103 |
.298 |
-3 |
-1.5 |
.257 |
Batters – Top Near-Age Offensive Comps
Batters – Top Near-Age Offensive Comps
| Player |
80th BA |
80th OBP |
80th SLG |
80th OPS+ |
80th WAR |
20th BA |
20th OBP |
20th SLG |
20th OPS+ |
20th WAR |
| Dansby Swanson |
.287 |
.349 |
.490 |
125 |
6.2 |
.234 |
.296 |
.388 |
88 |
3.1 |
| Nico Hoerner |
.301 |
.352 |
.424 |
111 |
3.9 |
.244 |
.300 |
.342 |
76 |
1.7 |
| Ian Happ |
.270 |
.351 |
.483 |
124 |
3.7 |
.222 |
.305 |
.381 |
90 |
1.2 |
| Seiya Suzuki |
.297 |
.378 |
.554 |
148 |
3.6 |
.243 |
.326 |
.431 |
105 |
1.1 |
| Cody Bellinger |
.253 |
.334 |
.456 |
113 |
3.4 |
.205 |
.281 |
.358 |
75 |
1.0 |
| Rafael Ortega |
.279 |
.357 |
.454 |
119 |
2.9 |
.224 |
.304 |
.354 |
81 |
0.9 |
| Patrick Wisdom |
.241 |
.322 |
.509 |
121 |
2.9 |
.191 |
.276 |
.383 |
81 |
0.5 |
| Miles Mastrobuoni |
.293 |
.356 |
.413 |
111 |
2.7 |
.238 |
.301 |
.330 |
74 |
0.3 |
| Alexander Canario |
.249 |
.307 |
.481 |
112 |
2.9 |
.194 |
.255 |
.370 |
69 |
0.1 |
| Matt Mervis |
.278 |
.332 |
.500 |
123 |
2.7 |
.229 |
.285 |
.401 |
88 |
0.2 |
| Andrelton Simmons |
.274 |
.331 |
.333 |
82 |
2.1 |
.214 |
.268 |
.267 |
48 |
0.5 |
| Franmil Reyes |
.274 |
.330 |
.518 |
125 |
2.6 |
.219 |
.275 |
.401 |
82 |
-0.2 |
| Christopher Morel |
.260 |
.327 |
.471 |
113 |
2.5 |
.204 |
.269 |
.371 |
74 |
-0.1 |
| Nick Madrigal |
.302 |
.355 |
.386 |
103 |
2.0 |
.243 |
.297 |
.308 |
67 |
0.3 |
| Pete Crow-Armstrong |
.271 |
.323 |
.440 |
106 |
2.3 |
.219 |
.272 |
.343 |
69 |
0.0 |
| Ben DeLuzio |
.263 |
.324 |
.398 |
94 |
1.9 |
.211 |
.272 |
.299 |
58 |
0.1 |
| Zach McKinstry |
.284 |
.349 |
.454 |
117 |
2.1 |
.227 |
.292 |
.356 |
78 |
0.0 |
| Yan Gomes |
.272 |
.320 |
.442 |
103 |
1.8 |
.212 |
.266 |
.335 |
63 |
0.2 |
| Kevin Alcantara |
.254 |
.316 |
.418 |
97 |
2.1 |
.201 |
.263 |
.322 |
60 |
-0.2 |
| Esteban Quiroz |
.252 |
.362 |
.424 |
112 |
1.6 |
.199 |
.306 |
.326 |
75 |
0.3 |
| Levi Jordan |
.263 |
.320 |
.392 |
92 |
1.6 |
.209 |
.268 |
.308 |
56 |
0.0 |
| Robel Garcia |
.237 |
.316 |
.443 |
104 |
1.4 |
.186 |
.267 |
.344 |
66 |
-0.1 |
| Kevin Made |
.256 |
.308 |
.391 |
91 |
1.7 |
.200 |
.255 |
.292 |
51 |
-0.3 |
| Jake Slaughter |
.257 |
.323 |
.406 |
98 |
1.7 |
.205 |
.268 |
.311 |
60 |
-0.5 |
| Chase Strumpf |
.217 |
.319 |
.379 |
88 |
1.5 |
.162 |
.269 |
.274 |
48 |
-0.7 |
| Brennen Davis |
.242 |
.326 |
.409 |
98 |
1.5 |
.190 |
.273 |
.305 |
58 |
-0.6 |
| Yonathan Perlaza |
.261 |
.327 |
.437 |
105 |
1.6 |
.207 |
.272 |
.339 |
68 |
-0.7 |
| Frank Schwindel |
.291 |
.330 |
.478 |
118 |
1.6 |
.227 |
.270 |
.366 |
74 |
-0.6 |
| David Bote |
.252 |
.324 |
.402 |
94 |
1.0 |
.196 |
.272 |
.311 |
59 |
-0.4 |
| Luis Vazquez |
.256 |
.301 |
.367 |
81 |
1.3 |
.204 |
.248 |
.291 |
47 |
-0.6 |
| P.J. Higgins |
.266 |
.339 |
.393 |
98 |
0.8 |
.213 |
.287 |
.311 |
63 |
-0.7 |
| Michael Hermosillo |
.237 |
.334 |
.403 |
101 |
0.6 |
.184 |
.279 |
.308 |
61 |
-0.5 |
| Nelson Velázquez |
.250 |
.314 |
.454 |
106 |
1.2 |
.195 |
.259 |
.351 |
64 |
-1.2 |
| BJ Murray Jr. |
.251 |
.340 |
.377 |
98 |
0.9 |
.200 |
.286 |
.287 |
60 |
-0.9 |
| Donnie Dewees |
.272 |
.334 |
.437 |
108 |
0.6 |
.218 |
.281 |
.326 |
68 |
-0.8 |
| Carlos Sepulveda |
.252 |
.327 |
.308 |
76 |
0.7 |
.190 |
.266 |
.230 |
39 |
-0.9 |
| Andy Weber |
.246 |
.303 |
.338 |
74 |
0.6 |
.196 |
.250 |
.264 |
42 |
-0.9 |
| Darius Hill |
.287 |
.323 |
.389 |
94 |
0.9 |
.226 |
.266 |
.308 |
57 |
-1.5 |
| Tyler Payne |
.259 |
.296 |
.369 |
81 |
0.5 |
.194 |
.232 |
.277 |
40 |
-0.8 |
| Bryce Ball |
.250 |
.325 |
.386 |
93 |
0.9 |
.193 |
.272 |
.300 |
58 |
-1.5 |
| Miguel Amaya |
.243 |
.329 |
.385 |
95 |
0.4 |
.182 |
.273 |
.278 |
54 |
-0.9 |
| Jordan Nwogu |
.243 |
.316 |
.405 |
93 |
0.5 |
.188 |
.262 |
.320 |
58 |
-1.2 |
| Alfonso Rivas |
.256 |
.343 |
.363 |
92 |
0.6 |
.201 |
.284 |
.276 |
56 |
-1.4 |
| Nelson Maldonado |
.267 |
.311 |
.407 |
92 |
0.4 |
.212 |
.253 |
.319 |
55 |
-1.4 |
| Zach Davis |
.243 |
.314 |
.283 |
65 |
0.1 |
.190 |
.259 |
.221 |
34 |
-0.9 |
| Greg Deichmann |
.232 |
.305 |
.367 |
81 |
0.5 |
.178 |
.248 |
.281 |
45 |
-1.2 |
| Bryce Windham |
.267 |
.341 |
.348 |
90 |
0.3 |
.199 |
.278 |
.263 |
52 |
-1.1 |
| Ed Howard |
.242 |
.282 |
.332 |
67 |
0.2 |
.186 |
.224 |
.241 |
30 |
-1.0 |
| Luis Verdugo |
.246 |
.300 |
.346 |
73 |
0.2 |
.195 |
.249 |
.269 |
42 |
-1.5 |
| Christian Donahue |
.219 |
.274 |
.282 |
54 |
-0.2 |
.164 |
.221 |
.213 |
20 |
-1.1 |
| Trent Giambrone |
.221 |
.293 |
.337 |
69 |
0.1 |
.168 |
.238 |
.246 |
34 |
-1.5 |
| Bradlee Beesley |
.233 |
.286 |
.375 |
79 |
-0.2 |
.174 |
.223 |
.282 |
38 |
-1.3 |
| Yeison Santana |
.248 |
.318 |
.295 |
71 |
-0.1 |
.192 |
.264 |
.227 |
38 |
-1.4 |
| Jackson Frazier |
.248 |
.332 |
.405 |
99 |
0.1 |
.190 |
.271 |
.308 |
60 |
-1.7 |
| Jake Washer |
.229 |
.270 |
.387 |
76 |
-0.3 |
.177 |
.217 |
.285 |
38 |
-1.4 |
| Fabian Pertuz |
.232 |
.272 |
.341 |
66 |
0.1 |
.181 |
.223 |
.260 |
32 |
-1.8 |
| Cole Roederer |
.245 |
.304 |
.371 |
83 |
-0.2 |
.187 |
.247 |
.288 |
48 |
-1.6 |
| D.J. Artis |
.227 |
.321 |
.329 |
78 |
-0.4 |
.169 |
.263 |
.241 |
40 |
-1.6 |
| Yohendrick Pinango |
.266 |
.300 |
.377 |
83 |
0.1 |
.212 |
.247 |
.293 |
51 |
-2.0 |
| Pablo Aliendo |
.243 |
.300 |
.367 |
81 |
0.0 |
.184 |
.244 |
.267 |
41 |
-1.9 |
| Scott McKeon |
.199 |
.267 |
.265 |
46 |
-0.6 |
.146 |
.211 |
.194 |
13 |
-1.5 |
| Owen Caissie |
.228 |
.301 |
.350 |
77 |
-0.5 |
.173 |
.245 |
.261 |
40 |
-2.4 |
Pitchers – Standard
| Player |
T |
Age |
W |
L |
ERA |
G |
GS |
IP |
H |
ER |
HR |
BB |
SO |
| Marcus Stroman |
R |
32 |
9 |
8 |
3.58 |
28 |
28 |
150.7 |
148 |
60 |
16 |
41 |
128 |
| Justin Steele |
L |
27 |
6 |
4 |
3.70 |
23 |
20 |
104.7 |
93 |
43 |
10 |
44 |
104 |
| Jeremiah Estrada |
R |
24 |
3 |
2 |
3.71 |
38 |
0 |
51.0 |
42 |
21 |
6 |
22 |
66 |
| Wade Miley |
L |
36 |
6 |
6 |
3.95 |
22 |
22 |
109.3 |
114 |
48 |
12 |
39 |
77 |
| Mark Leiter Jr. |
R |
32 |
6 |
6 |
3.98 |
30 |
11 |
83.7 |
74 |
37 |
10 |
28 |
88 |
| Codi Heuer |
R |
26 |
4 |
3 |
4.00 |
32 |
0 |
45.0 |
46 |
20 |
5 |
14 |
37 |
| Jameson Taillon |
R |
31 |
8 |
8 |
4.02 |
27 |
27 |
145.7 |
142 |
65 |
20 |
35 |
125 |
| Rowan Wick |
R |
30 |
4 |
4 |
4.03 |
55 |
0 |
58.0 |
55 |
26 |
7 |
24 |
61 |
| Ben Leeper |
R |
26 |
3 |
3 |
4.09 |
42 |
0 |
44.0 |
40 |
20 |
5 |
18 |
41 |
| Adbert Alzolay |
R |
28 |
6 |
5 |
4.11 |
20 |
15 |
81.0 |
73 |
37 |
12 |
26 |
85 |
| Brandon Hughes |
L |
27 |
3 |
2 |
4.13 |
54 |
0 |
61.0 |
52 |
28 |
10 |
22 |
72 |
| Brad Boxberger |
R |
35 |
3 |
3 |
4.15 |
58 |
0 |
52.0 |
46 |
24 |
7 |
23 |
56 |
| Walker Powell |
R |
27 |
6 |
6 |
4.18 |
28 |
5 |
79.7 |
82 |
37 |
10 |
21 |
59 |
| Ben Brown |
R |
23 |
5 |
6 |
4.19 |
24 |
23 |
103.0 |
99 |
48 |
12 |
38 |
88 |
| Keegan Thompson |
R |
28 |
6 |
7 |
4.22 |
29 |
15 |
102.3 |
97 |
48 |
16 |
38 |
96 |
| Caleb Kilian |
R |
26 |
5 |
5 |
4.24 |
23 |
23 |
108.3 |
103 |
51 |
10 |
51 |
105 |
| Sean Newcomb |
L |
30 |
3 |
3 |
4.35 |
35 |
3 |
51.7 |
47 |
25 |
6 |
29 |
54 |
| Kervin Castro |
R |
24 |
3 |
5 |
4.37 |
41 |
2 |
57.7 |
54 |
28 |
7 |
28 |
56 |
| Ethan Roberts |
R |
25 |
3 |
3 |
4.40 |
33 |
0 |
43.0 |
42 |
21 |
6 |
14 |
42 |
| Matt Dermody |
L |
32 |
4 |
4 |
4.42 |
19 |
11 |
73.3 |
78 |
36 |
9 |
23 |
54 |
| Kyle Hendricks |
R |
33 |
6 |
7 |
4.43 |
20 |
20 |
113.7 |
121 |
56 |
18 |
26 |
85 |
| Jordan Wicks |
L |
23 |
5 |
6 |
4.47 |
27 |
27 |
100.7 |
100 |
50 |
14 |
35 |
83 |
| Matt Swarmer |
R |
29 |
5 |
6 |
4.50 |
25 |
18 |
104.0 |
107 |
52 |
16 |
39 |
93 |
| Robert Gsellman |
R |
29 |
2 |
3 |
4.50 |
23 |
6 |
42.0 |
44 |
21 |
5 |
15 |
29 |
| Danis Correa |
R |
23 |
3 |
4 |
4.53 |
38 |
0 |
53.7 |
48 |
27 |
6 |
31 |
55 |
| Sheldon Reed |
R |
25 |
2 |
2 |
4.54 |
30 |
0 |
33.7 |
31 |
17 |
5 |
17 |
38 |
| Hayden Wesneski |
R |
25 |
7 |
8 |
4.58 |
23 |
21 |
106.0 |
106 |
54 |
13 |
36 |
90 |
| Conner Menez |
L |
28 |
3 |
3 |
4.60 |
25 |
12 |
72.3 |
69 |
37 |
10 |
35 |
74 |
| Michael Rucker |
R |
29 |
2 |
2 |
4.62 |
41 |
0 |
62.3 |
63 |
32 |
10 |
23 |
59 |
| Brendon Little |
L |
26 |
3 |
4 |
4.63 |
30 |
2 |
46.7 |
47 |
24 |
5 |
25 |
42 |
| Scott Kobos |
L |
25 |
1 |
2 |
4.68 |
20 |
0 |
25.0 |
21 |
13 |
3 |
17 |
30 |
| Adrian Sampson 샘슨 |
R |
31 |
5 |
6 |
4.72 |
26 |
20 |
110.7 |
121 |
58 |
18 |
34 |
76 |
| Javier Assad |
R |
25 |
5 |
6 |
4.73 |
27 |
24 |
116.0 |
122 |
61 |
17 |
45 |
94 |
| Steven Brault |
L |
31 |
2 |
3 |
4.82 |
16 |
10 |
56.0 |
58 |
30 |
7 |
24 |
45 |
| Drew Smyly |
L |
34 |
5 |
7 |
4.84 |
21 |
19 |
93.0 |
99 |
50 |
19 |
30 |
84 |
| Alec Mills |
R |
31 |
4 |
5 |
4.84 |
21 |
14 |
83.7 |
94 |
45 |
13 |
23 |
60 |
| Blake Whitney |
R |
27 |
4 |
5 |
4.85 |
30 |
0 |
55.7 |
58 |
30 |
9 |
23 |
52 |
| Bailey Horn |
L |
25 |
2 |
2 |
4.86 |
28 |
5 |
50.0 |
48 |
27 |
7 |
30 |
52 |
| James Bourque |
R |
29 |
2 |
3 |
4.87 |
31 |
0 |
40.7 |
36 |
22 |
6 |
28 |
51 |
| Joe Biagini |
R |
33 |
3 |
4 |
4.88 |
27 |
8 |
55.3 |
58 |
30 |
7 |
28 |
42 |
| Stephen Gonsalves |
L |
28 |
2 |
4 |
4.91 |
18 |
7 |
51.3 |
44 |
28 |
7 |
37 |
62 |
| Wyatt Short |
L |
28 |
3 |
5 |
4.91 |
27 |
5 |
62.3 |
62 |
34 |
8 |
31 |
52 |
| Samuel Reyes |
R |
27 |
3 |
4 |
4.98 |
26 |
1 |
47.0 |
49 |
26 |
8 |
24 |
43 |
| CD Pelham |
L |
28 |
1 |
2 |
4.98 |
31 |
0 |
34.3 |
34 |
19 |
5 |
20 |
33 |
| DJ Herz |
L |
22 |
4 |
5 |
5.03 |
27 |
27 |
91.3 |
78 |
51 |
12 |
65 |
103 |
| Anderson Espinoza |
R |
25 |
4 |
6 |
5.06 |
24 |
17 |
74.7 |
71 |
42 |
11 |
45 |
73 |
| Cam Sanders |
R |
26 |
4 |
6 |
5.07 |
26 |
16 |
81.7 |
80 |
46 |
13 |
45 |
78 |
| Richard Gallardo |
R |
21 |
6 |
9 |
5.10 |
24 |
23 |
109.3 |
122 |
62 |
17 |
42 |
70 |
| Eric Stout |
L |
30 |
2 |
2 |
5.13 |
35 |
3 |
52.7 |
50 |
30 |
8 |
33 |
58 |
| Ryan Jensen |
R |
25 |
3 |
4 |
5.19 |
18 |
18 |
59.0 |
59 |
34 |
9 |
32 |
52 |
| Cayne Ueckert |
R |
27 |
1 |
2 |
5.23 |
32 |
1 |
43.0 |
41 |
25 |
7 |
29 |
44 |
| Erich Uelmen |
R |
27 |
3 |
6 |
5.30 |
38 |
5 |
69.7 |
70 |
41 |
11 |
34 |
61 |
| Peyton Remy |
R |
26 |
4 |
6 |
5.31 |
23 |
10 |
76.3 |
78 |
45 |
12 |
38 |
68 |
| Joe Nahas |
R |
23 |
3 |
5 |
5.33 |
22 |
6 |
77.7 |
84 |
46 |
12 |
36 |
54 |
| Manuel Rodríguez |
R |
26 |
2 |
3 |
5.35 |
24 |
3 |
38.7 |
40 |
23 |
7 |
18 |
33 |
| Riley Thompson |
R |
26 |
3 |
5 |
5.46 |
18 |
18 |
56.0 |
61 |
34 |
11 |
28 |
51 |
| Hunter Bigge |
R |
25 |
2 |
5 |
5.75 |
33 |
0 |
40.7 |
39 |
26 |
7 |
33 |
43 |
| Aneuris Rosario |
R |
28 |
1 |
4 |
5.96 |
18 |
0 |
22.7 |
24 |
15 |
4 |
15 |
20 |
| Eury Ramos |
R |
25 |
1 |
2 |
6.00 |
23 |
1 |
30.0 |
32 |
20 |
5 |
20 |
24 |
| Max Bain |
R |
25 |
2 |
6 |
6.05 |
19 |
11 |
58.0 |
60 |
39 |
10 |
41 |
49 |
| Eduarniel Nunez |
R |
24 |
2 |
6 |
6.34 |
33 |
1 |
44.0 |
47 |
31 |
7 |
35 |
35 |
| Brailyn Marquez |
L |
24 |
2 |
6 |
7.32 |
12 |
12 |
51.7 |
57 |
42 |
16 |
40 |
58 |
| Burl Carraway |
L |
24 |
1 |
2 |
7.84 |
22 |
0 |
20.7 |
19 |
18 |
3 |
30 |
20 |
Pitchers – Advanced
| Player |
IP |
K/9 |
BB/9 |
HR/9 |
BB% |
K% |
BABIP |
ERA+ |
FIP |
ERA- |
WAR |
| Marcus Stroman |
150.7 |
7.6 |
2.4 |
1.0 |
6.5% |
20.2% |
.297 |
112 |
3.73 |
89 |
2.9 |
| Justin Steele |
104.7 |
8.9 |
3.8 |
0.9 |
9.8% |
23.2% |
.290 |
109 |
3.81 |
92 |
1.9 |
| Jeremiah Estrada |
51.0 |
11.6 |
3.9 |
1.1 |
10.0% |
30.0% |
.300 |
109 |
3.51 |
92 |
0.5 |
| Wade Miley |
109.3 |
6.3 |
3.2 |
1.0 |
8.2% |
16.2% |
.297 |
102 |
4.32 |
98 |
1.7 |
| Mark Leiter Jr. |
83.7 |
9.5 |
3.0 |
1.1 |
8.0% |
25.0% |
.290 |
101 |
3.89 |
99 |
1.2 |
| Codi Heuer |
45.0 |
7.4 |
2.8 |
1.0 |
7.0% |
18.6% |
.301 |
101 |
4.02 |
99 |
0.3 |
| Jameson Taillon |
145.7 |
7.7 |
2.2 |
1.2 |
5.8% |
20.6% |
.288 |
100 |
4.05 |
100 |
2.1 |
| Rowan Wick |
58.0 |
9.5 |
3.7 |
1.1 |
9.6% |
24.3% |
.306 |
100 |
3.96 |
100 |
0.3 |
| Ben Leeper |
44.0 |
8.4 |
3.7 |
1.0 |
9.6% |
21.8% |
.285 |
99 |
4.20 |
101 |
0.2 |
| Adbert Alzolay |
81.0 |
9.4 |
2.9 |
1.3 |
7.7% |
25.1% |
.285 |
98 |
4.13 |
102 |
1.1 |
| Brandon Hughes |
61.0 |
10.6 |
3.2 |
1.5 |
8.6% |
28.1% |
.282 |
98 |
4.25 |
102 |
0.3 |
| Brad Boxberger |
52.0 |
9.7 |
4.0 |
1.2 |
10.3% |
25.1% |
.287 |
97 |
4.25 |
103 |
0.3 |
| Walker Powell |
79.7 |
6.7 |
2.4 |
1.1 |
6.2% |
17.5% |
.293 |
96 |
4.17 |
104 |
0.8 |
| Ben Brown |
103.0 |
7.7 |
3.3 |
1.0 |
8.6% |
19.9% |
.290 |
96 |
4.21 |
104 |
1.3 |
| Keegan Thompson |
102.3 |
8.4 |
3.3 |
1.4 |
8.6% |
21.8% |
.284 |
96 |
4.60 |
105 |
1.3 |
| Caleb Kilian |
108.3 |
8.7 |
4.2 |
0.8 |
10.6% |
21.9% |
.304 |
95 |
3.94 |
105 |
1.3 |
| Sean Newcomb |
51.7 |
9.4 |
5.1 |
1.0 |
12.5% |
23.3% |
.295 |
93 |
4.37 |
108 |
0.2 |
| Kervin Castro |
57.7 |
8.7 |
4.4 |
1.1 |
11.0% |
22.0% |
.294 |
92 |
4.40 |
108 |
0.2 |
| Ethan Roberts |
43.0 |
8.8 |
2.9 |
1.3 |
7.6% |
22.7% |
.300 |
92 |
4.20 |
109 |
0.1 |
| Matt Dermody |
73.3 |
6.6 |
2.8 |
1.1 |
7.3% |
17.1% |
.301 |
91 |
4.46 |
110 |
0.7 |
| Kyle Hendricks |
113.7 |
6.7 |
2.1 |
1.4 |
5.4% |
17.7% |
.294 |
91 |
4.56 |
110 |
1.1 |
| Jordan Wicks |
100.7 |
7.4 |
3.1 |
1.3 |
8.1% |
19.2% |
.289 |
90 |
4.53 |
111 |
1.0 |
| Matt Swarmer |
104.0 |
8.0 |
3.4 |
1.4 |
8.6% |
20.4% |
.300 |
90 |
4.55 |
112 |
0.9 |
| Robert Gsellman |
42.0 |
6.2 |
3.2 |
1.1 |
8.2% |
15.8% |
.293 |
90 |
4.68 |
112 |
0.3 |
| Danis Correa |
53.7 |
9.2 |
5.2 |
1.0 |
12.6% |
22.4% |
.292 |
89 |
4.46 |
112 |
0.0 |
| Sheldon Reed |
33.7 |
10.2 |
4.5 |
1.3 |
11.3% |
25.2% |
.299 |
89 |
4.70 |
113 |
-0.1 |
| Hayden Wesneski |
106.0 |
7.6 |
3.1 |
1.1 |
7.9% |
19.8% |
.297 |
88 |
4.21 |
114 |
0.9 |
| Conner Menez |
72.3 |
9.2 |
4.4 |
1.2 |
10.9% |
23.1% |
.299 |
88 |
4.52 |
114 |
0.5 |
| Michael Rucker |
62.3 |
8.5 |
3.3 |
1.4 |
8.5% |
21.8% |
.299 |
87 |
4.60 |
115 |
-0.1 |
| Brendon Little |
46.7 |
8.1 |
4.8 |
1.0 |
11.6% |
19.5% |
.307 |
87 |
4.55 |
115 |
0.1 |
| Scott Kobos |
25.0 |
10.8 |
6.1 |
1.1 |
15.0% |
26.5% |
.295 |
86 |
4.59 |
116 |
0.0 |
| Adrian Sampson |
110.7 |
6.2 |
2.8 |
1.5 |
7.1% |
15.8% |
.294 |
85 |
5.03 |
117 |
0.7 |
| Javier Assad |
116.0 |
7.3 |
3.5 |
1.3 |
8.8% |
18.4% |
.300 |
85 |
4.78 |
117 |
0.8 |
| Steven Brault |
56.0 |
7.2 |
3.9 |
1.1 |
9.6% |
18.1% |
.300 |
84 |
4.67 |
120 |
0.3 |
| Drew Smyly |
93.0 |
8.1 |
2.9 |
1.8 |
7.4% |
20.7% |
.299 |
83 |
5.04 |
120 |
0.5 |
| Alec Mills |
83.7 |
6.5 |
2.5 |
1.4 |
6.3% |
16.5% |
.305 |
83 |
4.74 |
120 |
0.4 |
| Blake Whitney |
55.7 |
8.4 |
3.7 |
1.5 |
9.2% |
20.7% |
.306 |
83 |
4.73 |
120 |
-0.3 |
| Bailey Horn |
50.0 |
9.4 |
5.4 |
1.3 |
13.1% |
22.7% |
.301 |
83 |
4.81 |
121 |
0.0 |
| James Bourque |
40.7 |
11.3 |
6.2 |
1.3 |
14.7% |
26.8% |
.303 |
83 |
4.85 |
121 |
-0.2 |
| Joe Biagini |
55.3 |
6.8 |
4.6 |
1.1 |
11.2% |
16.7% |
.298 |
83 |
4.96 |
121 |
0.2 |
| Stephen Gonsalves |
51.3 |
10.9 |
6.5 |
1.2 |
15.7% |
26.3% |
.294 |
82 |
5.02 |
122 |
0.1 |
| Wyatt Short |
62.3 |
7.5 |
4.5 |
1.2 |
11.1% |
18.6% |
.293 |
82 |
5.08 |
122 |
0.0 |
| Samuel Reyes |
47.0 |
8.2 |
4.6 |
1.5 |
11.3% |
20.2% |
.301 |
81 |
5.20 |
123 |
-0.3 |
| CD Pelham |
34.3 |
8.7 |
5.2 |
1.3 |
12.3% |
20.4% |
.299 |
81 |
5.13 |
124 |
-0.3 |
| DJ Herz |
91.3 |
10.1 |
6.4 |
1.2 |
15.4% |
24.3% |
.286 |
80 |
5.10 |
125 |
0.3 |
| Anderson Espinoza |
74.7 |
8.8 |
5.4 |
1.3 |
13.2% |
21.3% |
.291 |
80 |
5.24 |
126 |
0.1 |
| Cam Sanders |
81.7 |
8.6 |
5.0 |
1.4 |
12.1% |
21.0% |
.294 |
80 |
5.30 |
126 |
0.2 |
| Richard Gallardo |
109.3 |
5.8 |
3.5 |
1.4 |
8.6% |
14.4% |
.297 |
79 |
5.21 |
127 |
0.2 |
| Eric Stout |
52.7 |
9.9 |
5.6 |
1.4 |
13.8% |
24.2% |
.302 |
79 |
5.03 |
127 |
-0.2 |
| Ryan Jensen |
59.0 |
7.9 |
4.9 |
1.4 |
12.0% |
19.5% |
.292 |
78 |
5.25 |
129 |
0.1 |
| Cayne Ueckert |
43.0 |
9.2 |
6.1 |
1.5 |
14.6% |
22.1% |
.293 |
77 |
5.53 |
130 |
-0.4 |
| Erich Uelmen |
69.7 |
7.9 |
4.4 |
1.4 |
10.9% |
19.6% |
.292 |
76 |
5.39 |
131 |
-0.3 |
| Peyton Remy |
76.3 |
8.0 |
4.5 |
1.4 |
11.0% |
19.6% |
.297 |
76 |
5.26 |
132 |
-0.1 |
| Joe Nahas |
77.7 |
6.3 |
4.2 |
1.4 |
10.2% |
15.3% |
.294 |
76 |
5.43 |
132 |
-0.2 |
| Manuel Rodríguez |
38.7 |
7.7 |
4.2 |
1.6 |
10.4% |
19.1% |
.292 |
75 |
5.43 |
133 |
-0.3 |
| Riley Thompson |
56.0 |
8.2 |
4.5 |
1.8 |
10.9% |
19.8% |
.307 |
74 |
5.49 |
136 |
0.0 |
| Hunter Bigge |
40.7 |
9.5 |
7.3 |
1.5 |
16.8% |
21.8% |
.296 |
70 |
5.78 |
143 |
-0.6 |
| Aneuris Rosario |
22.7 |
7.9 |
6.0 |
1.6 |
14.3% |
19.0% |
.303 |
68 |
5.80 |
148 |
-0.4 |
| Eury Ramos |
30.0 |
7.2 |
6.0 |
1.5 |
13.5% |
16.2% |
.297 |
67 |
5.82 |
149 |
-0.5 |
| Max Bain |
58.0 |
7.6 |
6.4 |
1.6 |
14.7% |
17.6% |
.292 |
67 |
6.24 |
150 |
-0.6 |
| Eduarniel Nunez |
44.0 |
7.2 |
7.2 |
1.4 |
15.9% |
15.9% |
.299 |
64 |
6.36 |
157 |
-0.9 |
| Brailyn Marquez |
51.7 |
10.1 |
7.0 |
2.8 |
15.6% |
22.6% |
.304 |
55 |
7.43 |
181 |
-1.1 |
| Burl Carraway |
20.7 |
8.7 |
13.1 |
1.3 |
25.9% |
17.2% |
.281 |
51 |
7.90 |
194 |
-0.8 |
Pitchers – Top Near-Age Comps and Percentiles
Players are listed with their most recent teams wherever possible. This includes players who are unsigned or have retired, players who will miss 2023 due to injury, and players who were released in 2022. So yes, if you see Joe Schmoe, who quit baseball back in August to form a Norwegian Death Dixieland Bubblegum Ska-Funk band, he’s still listed here intentionally. ZiPS is assuming a league with an ERA of 4.22, above 2022’s level of offense but lower than other years. Pitchers who appear to have a fairly definite change in the majors from start-to-relief or vice-versa from these projections will receive reconfigured updates in the spring.
Hitters are ranked by zWAR, which is to say, WAR values as calculated by me, Dan Szymborski, whose surname is spelled with a z. WAR values might differ slightly from those that appear in the full release of ZiPS. Finally, I will advise anyone against — and might karate chop anyone guilty of — merely adding up WAR totals on a depth chart to produce projected team WAR.
As always, incorrect projections are either caused by flaws in the physical reality of the universe or by skillful sabotage of our friend and former editor. You can, however, still get mad at me on Twitter.