The Continued Decline of the Intentional Walk

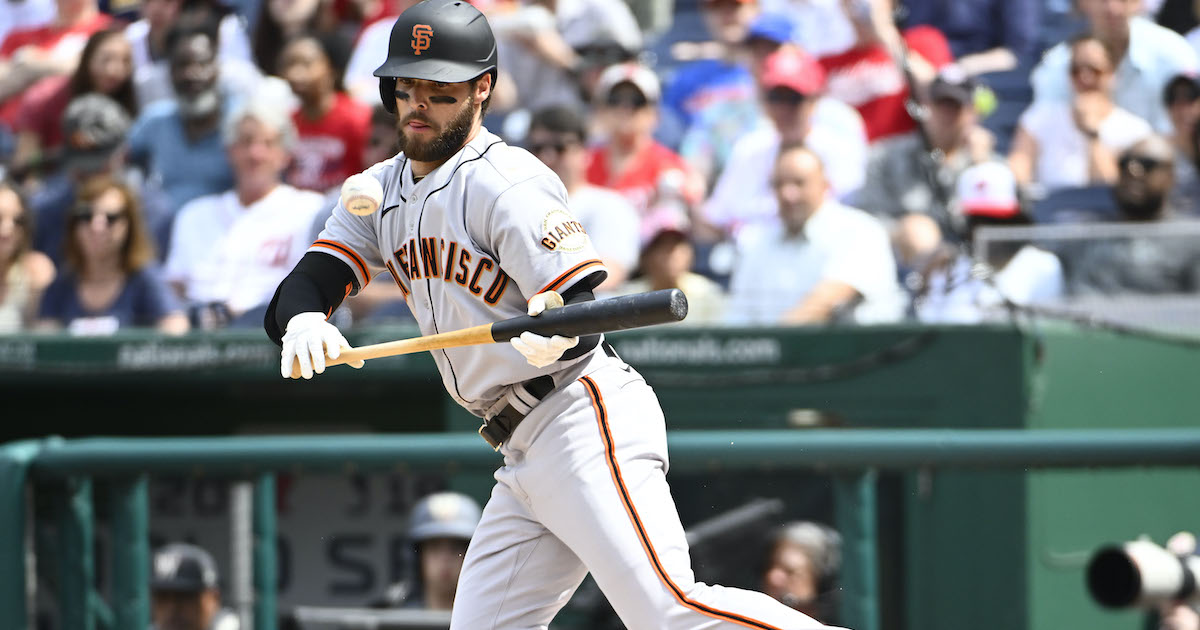
I’m on record as being against intentional walks in most situations. That’s hardly some bold claim — over the last 15 years, they’re on a steady downward path as front offices and managers come to grips with the ills of extra baserunners. That’s not to say there’s never a good situation for a free pass, but those situations are few and far between.

Why pinpoint the last 15 years as the timeframe for this drop-off? In 1955, the first year where we have intentional walk totals, teams issued roughly 7.5 intentional walks per 1,000 plate appearances. In 2002, they issued 7.8 intentional walks per 1,000 PAs. Sure, there were peaks and valleys in between, but the data hardly indicated a trend. Take a look at the number of intentional walks issued per 1,000 plate appearances each year since 1955:

One note: I’ve excluded 2020 because of the universal DH, which created a meaningfully different backdrop for intentional walks — walking a decent hitter to face a pitcher is one of the best uses of the tactic.

I could end this article right there. That’s a convincing chart — the year with the least frequent intentional walks is 2021, and the year with the second-least is 2019. They’re roughly equivalent — four walks per 1,000 in 2019, 3.8 in ’21 — but even so, the writing is on the wall. Give the game 20 years, and we’ll surely see even fewer. Read the rest of this entry »


The 3,000 Hit Club Is Closed for Maintenance

Batting average may have rightfully lost its sex appeal in player evaluation, but not everything that’s fun needs to be a measure of a player’s overall value. We’ve been treated to eight new members of the 3,000 hit club over the last 20 years; that’s a quarter of the 3,000-hitsmen in baseball history, with a few more just outside that arbitrary endpoint. Miguel Cabrera almost certainly won’t get the 21 hits he needs to reach the milestone over Detroit’s nine remaining games this season, but he should get there sometime in early 2022. After he does, however, baseball won’t have to print any more membership cards for a while.

By definition, players who end up with 3,000 career hits necessarily must have had 2,000 hits at some point. In 2021, we have fewer active 2,000-hit hitters than at any other “normal” time in baseball history:

There was only a single batter with 2,000 career hits after the 1952 season: Stan Musial, who had 2,023. But that bottleneck is hardly surprising given that many of baseball’s stars missed multiple seasons due to service in World War II. There were 10 active 1,500-hit hitters that year and six of them (Musial, Johnny Mize, Enos Slaughter, Ted Williams, Dom DiMaggio, and Mickey Vernon) went to war. Baseball set a record for the most active players with 2,000 hits fairly recently, with 27 after the 2004 season. Right now, there are only five: Cabrera, Robinson Canó, Yadier Molina, Albert Pujols, and Joey Votto. Read the rest of this entry »


From Reliever to Relief: How Ranger Suárez Gave the Phillies a Rotation Boost

The Phillies’ rotation hasn’t been a total disaster this season. Zack Wheeler is a top Cy Young candidate, and Aaron Nola has held his own as one of the league’s best starters, with the two combining for 10.8 WAR. But the rest? Zach Eflin went down in mid-July with a knee injury before getting surgery earlier this month. Vince Velasquez spent nearly two months on the injured list with a blister and was recently DFA’d; he now wears a Padres uniform. Spencer Howard had his own sophomore struggles before being traded to the Rangers at the deadline. Enter 26-year-old left-hander Ranger Suárez, who, after picking up the slack in the bullpen and briefly filling in as the team’s closer, was called upon to step into the rotation.

Suárez has been remarkably consistent since being stretched out as a starter, going at least five innings and allowing two earned runs or fewer in each of his last six starts:

Ranger Suárez Last Six Starts
Date Opp IP H ER HR BB SO
2021-09-20 BAL 6 7 2 0 1 5
2021-09-15 CHC 6 6 2 1 1 8
2021-09-09 COL 6 5 1 0 1 6
2021-09-04 @MIA 5 2 0 0 2 7
2021-08-29 ARI 5.1 5 1 0 2 5
2021-08-24 TBR 6.2 6 1 0 1 7

During that stretch, he has only given up one home run. He’s been prolific in that regard all season, having allowed just four homers total and boasting a minuscule 0.26 HR/9 rate over those last six starts. If we extend that to the beginning of August, when he first took the mound as a starter, that becomes an even more impressive 0.18 HR/9 over 49.2 innings pitched. Not only does he seem to have the home run thing figured out, but he also doesn’t give out many free passes either: He’s issued no more than two walks in each of his last six games, good for a 5.6 BB%.

Read the rest of this entry »


The Keys to the Cardinals’ Resurgence

On a hot afternoon in St. Louis on August 8, in a game that felt meaningless at the time, the Cardinals rallied for three runs in the eighth inning to tie their game with the Royals at 5–5. In the next half inning, a Paul Goldschmidt throwing error and a go-ahead single by Nicky Lopez dropped St. Louis to 55–56, mired in third place in the National League Central. The team was 10.5 games behind Milwaukee for the division lead, 8.5 games behind the Padres for the second wild card spot, and, per our Playoff Odds, had a 1.4% chance of reaching the postseason.

But following that ugly loss, back-to-back sweeps of road series in Pittsburgh and Kansas City put the Cardinals back over the .500 mark for good, and a 10-game winning streak entering Wednesday’s game in Milwaukee has them with a commanding lead for that second Wild Card spot, and the overwhelming favorites to stay that way. Since that loss to the Royals, St. Louis has gone 26–13, but those hot streaks show just how, well, streaky the team has been; those 16 wins wrap around a 10–13 run.

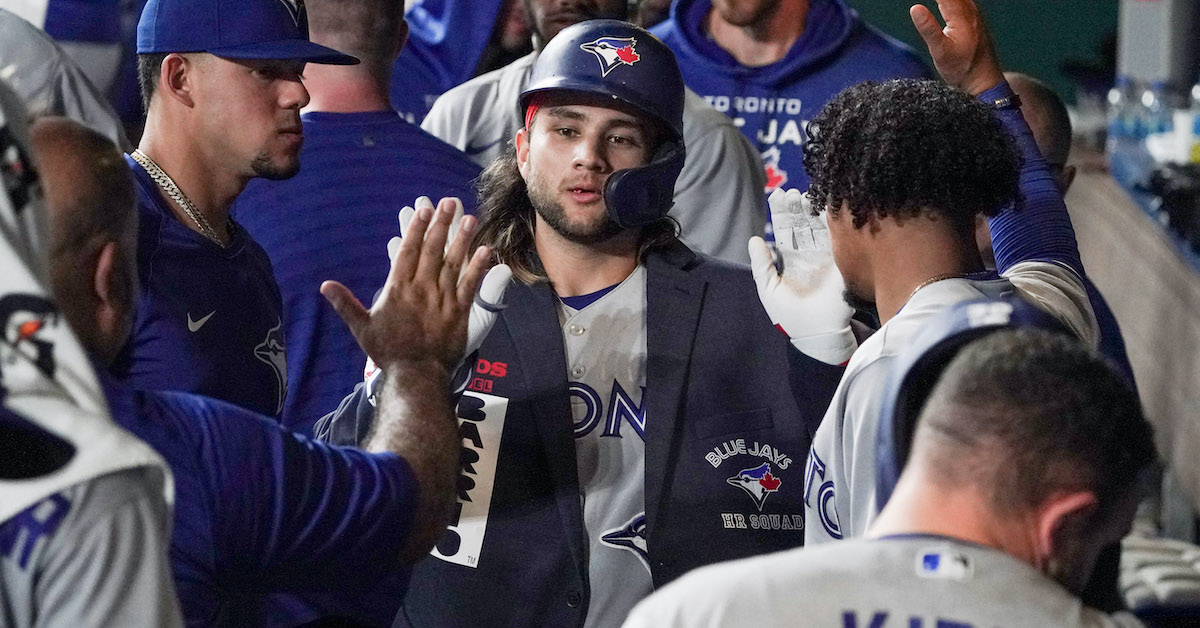
Still, whether the wins come in bunches or not, the Cardinals have been one of the stories of September, and that story feels largely ignored, mostly due to the five-team dogfight that is the AL Wild Card and the back-and-forth NL West battle between the Dodgers and Giants. On last week’s episode of Chin Music, Joe Sheehan and I wondered why everyone was talking about the Blue Jays and not the Cardinals in the battle of surging birds. Our take: the team is boring. The Blue Jays have swag, infectious energy and cool jackets for when somebody hits home runs. The Cardinals, meanwhile, are relative automatons, getting overshadowed by a Toronto club that is just more fun to watch.

That’s not to take anything away from St. Louis. Entertainment value be damned, this is suddenly looking like a postseason team planning to line up a surprising ace for the coin-flip game. Here are five key factors as to how the Cardinals went from under .500 six weeks ago to being in the driver’s seat for that final playoff slot.

Read the rest of this entry »


Jon Lester’s Well-Timed Hot Streak

The Cardinals’ 10-game winning streak has given them control of the race for the second NL Wild Card spot, as they’ve built a four-game lead over the Reds, reduced their magic number to clinch a spot to eight, and threatened to cut my Team Entropy workload way down. Monday’s victory over the Brewers, their ninth win in that streak, marked the 200th career win for Jon Lester, thereby increasing the count of active hurlers who have achieved that milestone from two to three, as the 37-year-old southpaw — who was acquired from the Nationals at the July 30 deadline — joined Justin Verlander (226) and Zack Greinke (219).

Before you ask: no, I don’t think this does much for Lester’s Hall of Fame case, not with a 39.5 JAWS, which ranks 156th among starting pitchers, below the likes of Cliff Lee, Jamie Moyer, Carlos Zambrano, Brad Radke, Bartolo Colon and current teammate Adam Wainwright — and more than 20 points behind Verlander, Greinke, and Clayton Kershaw, all of whom are around the Hall of Fame standard (61.7). Two-hundred wins, five All-Star appearances, three World Series rings, and three top-five Cy Young award finishes is a nice set of credentials, but let’s not go overboard.

Anyway, Lester pitched badly with the Nationals, and he wasn’t so hot over his final two-plus seasons with the Cubs, either, as his diminished strikeout rate caught up with him. His tenure with the Cardinals — who were just 51-51 with 2.1% Playoff Odds when they traded outfielder Lane Thomas to the Nationals in exchange for him — began in similarly dismal fashion. Yet over his last six turns, he’s delivered a 2.27 ERA in 35.2 innings, allowing no more than two earned runs in any of those outings, which have come against the Tigers, Reds (twice), Brewers (twice), and Mets. Then again, a peek at Lester’s FIP during that six-start stretch (5.68) — driven by a gaudy 2.02 homers per nine — suggests that not all that much has changed for him, so the question is, what’s underlying those better results? Read the rest of this entry »


Mike Zunino Powers Up

If you want to figure out who the most fearsome power hitters in the majors are, you can consider any number of criteria. The longest home runs? The hardest-hit batted balls? Those both make some sense. The raw number of home runs? Sure, why not? Personally, I like to look at barrels per swing — how frequently a given batter converts a swing into loud contact.

That’s often what we’re asking when we think about sluggers. If you hit 30 bombs but do it by swinging frequently and putting the ball in the air with average raw, that’s not really what I’d consider a slugger. Similarly, if you almost never make contact, I don’t care too much what happens when you do. Turning swings into smashed baseballs? That’s pretty much what I want to see.

The statistic has the added bonus of mostly passing the sniff test. Vladimir Guerrero Jr. and Shohei Ohtani are in the top 10. So are Ronald Acuña Jr., Fernando Tatis Jr., Yordan Alvarez, and Max Muncy. Some of this year’s fun surprises — Byron Buxton and Joey Votto — are on there, too. Aaron Judge is 11th. Who tops the list? I’m glad you asked:

Barrel-per-Swing Leaders, 2021
Player Barrels Swings Barrels/Swing
Mike Zunino 47 657 7.2%
Ronald Acuña Jr. 44 620 7.1%
Max Muncy 58 844 6.9%
Fernando Tatis Jr. 67 987 6.8%
Shohei Ohtani 72 1107 6.5%
Vladimir Guerrero Jr. 70 1089 6.4%
Josh Donaldson 55 867 6.3%
Byron Buxton 24 395 6.1%
Joey Votto 54 907 6.0%
Yordan Alvarez 57 955 6.0%

That’s right: Mike Zunino is, by this metric at least, the best pure power hitter in baseball. He’s having a whale of a season, too, hitting .209/.296/.553, good for a strange-looking 131 wRC+. Though he’s barely above the Mendoza line, he’s clubbing enough homers (and it’s really just homers — he only has 10 doubles) and taking enough walks (9.4%) to make up for his ghastly 35.6% strikeout rate. Read the rest of this entry »


Effectively Wild Episode 1749: Cheat Sheet

EWFI
Ben Lindbergh and Meg Rowley banter about the unwritten rules controversy stemming from Kevin Kiermaier absconding with a Blue Jays scouting card, the Padres’ collapse, dysfunction, and outlook for 2022, the Cardinals’ surge and the Braves’ revamped outfield, Anthony Gose’s return to the majors as a pitcher, a number of injured arms making comebacks, the Pirates yet again failing to sweep, and the impact of depressed pitcher pay on team payrolls, then (41:43) talk to Jonathan Judge of Baseball Prospectus about his proposal to redistribute MLB revenue between the owners and players and to reapportion pay among the players.

Audio intro: The Clash, "The Card Cheat"
Audio interstitial: Laura Marling, "I Was Just a Card"
Audio outro: Kiwi Jr., "Salary Man"

Link to story on Kiermaier controversy
Link to story about Rays apology
Link to story about Mets-Dodgers dispute
Link to episode on banning in-game cards
Link to The Athletic on Padres dysfunction
Link to The Union-Tribune on the Padres
Link to story on Tatis and Machado
Link to Dan Szymborski on the Padres
Link to story on the Cardinals’ surge
Link to story on Atlanta’s outfield
Link to story on Gose’s comeback
Link to story on Syndergaard and deGrom
Link to story on Bieber
Link to story on Bassitt
Link to Rob Mains on pitcher pay
Link to Judge’s baseball economics article
Link to old EW episode about similar proposal
Link to story about minor league wristbands
Link to Angell watching the Mets
Link to Roger Angell EW episode

 iTunes Feed (Please rate and review us!)
 Sponsor Us on Patreon
 Facebook Group
 Effectively Wild Wiki
 Twitter Account
 Get Our Merch!
 Email Us: podcast@fangraphs.com


A Last Pass at the Low-Hanging Fruit on the Top 100

Earlier this week, Kevin Goldstein and I took a pass at the low-hanging fruit in the 50 FV tier and above to move or add prospects we thought merited action before heading into the offseason. The new “Top 100” can be found here. There is an up or down arrow in the “trend” column next to the name of any player whose FV changed as a result of our discussions so they’re easy to identify on the list. I get into more detail — including on those players whose FVs haven’t changed but whose ordinal rankings have — below.

Shuffling the 60 FV Tier

There are no new names among this group but we did reorder them, with Bobby Witt Jr. moving into the second overall spot behind top-ranked Adley Rutschman. Witt usurps San Diego middle-infielder CJ Abrams because a) he’s been healthy while Abrams has been out since July with a fractured tibia, b) he has progressed a level beyond Abrams, and c) he has more power. Abrams has the superior feel to hit, and the gap between the two on defense — where a healthy Abrams improved while Witt sputtered — has closed. Witt’s range and hands have both regressed; he’s not a lost cause at shortstop but he does need polish.

Noelvi Marte moved ahead of Marco Luciano as they’re similar in many ways (age, level, performance at that level, hit/power combination) but Marte has a better chance to stay at shortstop. Read the rest of this entry »


There’s Hope for the Padres… Just Not Right Now

San Diego’s 2021 season has become a campaign of devolving questions. From the preseason’s burning query of whether or not the Padres could best the Dodgers, we’ve gone from wondering whether they could top the Giants to whether they would make the playoffs at all. Now, as we head into the final week of the regular season, it’s unclear if San Diego can even beat the .500 mark.

Even if you’re hopeful about the team — and you probably don’t feel very optimistic after watching this weekend’s games or reading Jay’s piece on second-half collapses — finishing with a winning record is an open question. All of the Padres’ remaining games are against teams that would make the playoffs if the season ended today, and none of them can set cruise control; the Dodgers and Giants are fighting for the division, and the Braves still haven’t put away the Phillies.

The unraveling of the Padres became even more pronounced over the weekend. A three-game sweep at the hands of the Cardinals pushed San Diego 3.5 games out of a playoff spot, and in dramatic fashion. A clearly frustrated Manny Machado got in a public shouting match with Fernando Tatis Jr. after the latter became visibly angry about umpire Phil Cuzzi’s strike zone; fortunately for the team, manager Jayce Tingler took over the argument and was the one ejected instead of Tatis. Just as ugly was Tatis’ dropped pop-up in the first inning of Sunday’s game, compounded by a throw home instead of to second base for the force.

Coming into the season, the ZiPS projections pegged San Diego as a 98-win team, the second-best in baseball — the first time ZiPS had ever projected the franchise to win 90 games, the previous bests being 86 wins in 2007 and ’20 (before the season was pared down to a 60-game schedule). To finish 98–64 at this point, the Padres would have to go 23 and -9, which quite obviously will not happen unless MLB invents some new, bizarre rule.

Technically, there’s a path to the Padres ending 2021 on a satisfying note, but the odds are quickly becoming less “roll a double to get out of Monopoly jail” and more Dumb and Dumber-esque “so you’re saying there’s a chance.”

ZiPS Projected Standings – NL West
Team W L GB Pct Div% WC% Playoff% WS Win%
San Francisco Giants 104 58 .642 58.4% 41.6% 100.0% 17.2%
Los Angeles Dodgers 103 59 1 .636 41.6% 58.4% 100.0% 15.1%
San Diego Padres 82 80 22 .506 0.0% 3.0% 3.0% 0.1%
Colorado Rockies 75 87 29 .463 0.0% 0.0% 0.0% 0.0%
Arizona Diamondbacks 53 109 51 .327 0.0% 0.0% 0.0% 0.0%

Coming into the season, ZiPS had the Padres with a one-in-eight chance of winning the World Series; now, it’s one-in-1,607. Perhaps if the season were 200 games, they would have time to right the ship somewhat and make the playoffs, but given how this year has gone, maybe an extended season would have them falling behind the Rockies, too.

Read the rest of this entry »


Team Entropy 2021: Thinning the Herd, Slightly

This is the third installment of this year’s Team Entropy series, my recurring look not only at the races for the remaining playoff spots but the potential for end-of-season chaos in the form of down-to-the-wire suspense and even tiebreakers. Ideally, we want more ties than the men’s department at Macy’s. If you’re new to this, please read the introduction here.

We’re now inside of two weeks remaining in the 2021 season, and in both leagues, the playoff herds have thinned. With the Mets and Mariners both slipping in the Wild Card standings of their respective leagues, it appears that Major League Baseball’s heretofore unpublished five-way tiebreaker protocol will remain under wraps for another year, and time is running out for some other teams. Even so, there’s still a lot in play.

NL West and NL East

For starters, the race for the NL West flag is very much alive. The Giants won nine in a row from September 5-14, turning what had briefly been a tie with the Dodgers — which they broke with a season series-clinching win to kick off the streak — into a 2 1/2-game advantage. But after beating the Padres twice to start their four-game set at Oracle Park, the Giants lost the last two game of the series, and took “only” two of three agains the Braves this past weekend. Meanwhile the Dodgers split four games with the Cardinals in St. Louis, swept six games from the Padres and the Diamondbacks at home, and took two out of three from the Reds in Cincinnati, trimming the gap to a single game.

Both teams were idle on Monday, and now the defending champions visit Colorado and Arizona for three-game sets this week before returning home to close out the regular season with three-gamers against the Padres and Brewers. The Giants visit the Padres and then the Rockies for three apiece, then close by hosting the Diamondback and Padres. The Playoff Odds have ever so slightly tilted back to the Dodgers, 50.5% to 49.5%, but a stiff breeze could undo that pretty quickly.

The potential end-of-season scenario for these two teams hasn’t changed. If they’re tied after 162 games — the odds of which are currently at 16.1% — the Giants will host the tiebreaker, and the winner will be crowned division champion and get the NL’s top seed, while the loser will host the Wild Card Game; whoever wins that will turn around and play the NL West champion in the Division Series.

Meanwhile, with the Braves losing five out of six to the Marlins, Rockies, and Giants from September 11-18, the gap in the NL East shrank to a single game. It’s back up to three now, but I still get to run the table:

NL East Contenders Head-to-Head Records and Games Remaining
Team Record GB Braves Phillies Mets
Braves 78-70 7-9 (3,0) 8-8 (3,0)
Phillies 76-74 3 9-7 (0,3) 10-9
Mets 73-77 6 8-8 (0,3) 9-10
Games remaining between each pair of teams in parentheses, in format (Home,Road). Yellow cells denote that team has clinched the season series.

The Phillies, who just took two of three from both the Cubs and Mets, have the NL’s second-easiest remaining schedule the rest of the way, with a weighted opponents’ winning percentage of .448. They’re in the midst of hosting the Orioles — who have done their part to play the spoiler in the AL East, and beat the Phils at Camden Yards on Monday — and Pirates, the latter for four games instead of three, then finish with three apiece in Atlanta (where they can clinch the season series with a single win) and Miami. The Braves (.512 oppo win percentage) are in the midst of visiting the Diamondbacks for four and then the Padres for three before returning home to host the Phillies and Mets. I’m humoring the Mets here, because with odds of just 0.4% — all for the division, as they’ve slipped below the visibility threshold in the Wild Card race — New York is barely relevant. They do close against Atlanta; before that, the visit Boston for two and Milwaukee for three, then host Miami for four.

If the Phillies and Braves do end up tied (8.8% odds), the winner of the season series would play host to a Game 163 tiebreaker while the loser would, in all likelihood, go home. If somehow the two teams do finish 162 games with the same record as the second Wild Card team, the division-deciding tiebreaker wouldn’t be considered as breaking that tie. Instead, they’d become part of whatever Wild Card tie-breaking process is on the table. For example, if the Braves, Phillies, and Cardinals all finish at 86-76… You know what? I’m getting ahead of myself.

NL Wild Card No. 2

NL Wild Card Contenders Head-to-Head Records
Team Record GB Cardinals Reds Padres Phillies
Cardinals 80-69 9-10 3-3 3-4
Reds 79-73 3 10-9 1-6 4-2
Padres 76-73 4 3-3 6-1 2-4
Phillies 76-74 4.5 4-3 2-4 4-2
Yellow cells denote that team has clinched the season series.

Let’s backtrack a bit. By beating up on the Padres and Reds, the Dodgers did their share to clear up the Wild Card picture, which gained additional clarity as the Cardinals swept six games from the Mets and Padres, running their winning streak to eight straight. The Cardinals don’t have the easiest road ahead, in that six of their remaining 13 games (plus the one they won on Monday night, stretching their winning streak to nine) are against the Brewers, first as part of a four-game series in Milwaukee. They follow that with three against the Cubs in Chicago, then return home to host the Brewers and Cubs for three apiece. Their Playoff Odds, which were 7.9% as of September 11, and 36.0% on September 16, have skyrocketed to 79.6%.

By losing series to the Cardinals, Pirates, and Dodgers, the Red have dropped their odds from 52.9% to 14.4%, and losing Jesse Winker after a premature one-game return from his intercostal strain didn’t help (never believe a team when they say they think a player can return from an intercostal strain in 10 days). They do have the easiest remaining schedule, with a .440 weighted opponents’ winning percentage; that’s thanks to a pair of three-game series against the Pirates — first at home, beginning with Monday night’s win, then closing on the road — bookending a four-game series hosting the Nationals and then visiting the South Side for two against the White Sox.

The Padres are falling apart at the seams. Their odds were still at 44.0% on September 9, but they’ve gone 2-8 since then, sandwiching sweeps by the Dodgers and Cardinals around a split of a four-game series with the Giants. Saturday night’s dugout confrontation between Manny Machado and Fernando Tatis Jr. not only didn’t look good but hinted at bigger troubles behind the scenes.

As noted previously, the Padres have a brutal schedule the rest of the way, with six games against the Giants (three at home this week, then three in San Francisco on the final weekend) bookending a three-game series hosting the Braves and a three-game trip to visit the Dodgers. Oh, and get this, that series against the Braves also includes the conclusion of a suspended game that began on July 21, where the Braves trail 5-4 in the bottom of the fifth inning of a seven-inning game; in other words, for a brief time, they’ll be the home team at Petco Park.

Tiebreaker-wise, if two of these teams wind up with the same records atop this group after 162 games (11.9% odds), the host for the game will be determined by the better head-to-head record, and if not that then the better intradivision record; here the Reds (41-30, .577) and Phillies (40-30, .571) have big advantages over the Cardinals (32-31, .508) and Padres (32-35, .478, yikes). If that doesn’t unknot the tie, then intraleague records are next, positioning the Cardinals (69-60, .535) ahead of the Phillies (70-62, .530), and Padres (62-67, .481). If somehow that didn’t break the tie, they’d drill down to records in the last half of intraleague games, and then the last half plus one, plus two, and so on. I’m not digging through schedules for those hypotheticals just yet.

If three teams wind up tied for a single Wild Card spot, it gets complicated. This time around, I’ll use a hypothetical example involving the Cardinals, Reds, and Phillies. The Reds won their season series against both of the other teams (10-9 over Cardinals, 4-2 over Phillies), so they’re first in the pecking order, then the Phillies are second by dint of their 4-3 edge over the Cardinals. The teams then draft spots within the following scenario: Club A hosts Club B, with the winner hosting Club C. In other words, the team picking first can either choose a shot at two home games, or limit themselves to one road game. The team with the short straw in the three-way tiebreaker is actually Club B, which in a best-case scenario has to win not one but two road games just to get into the playoffs.

If four teams wind up tied for one spot, they’re ranked by their combined head-to-head records, which in this case shake out as the Padres (11-8, .579), Phillies (10-9, .526), Reds (15-17, .469), and Cardinals (15-17, .469), with the last two teams separated by Cincinnati’s aforementioned 10-9 season series advantage. The four teams would then draft spots in the following scenario: Club A hosts Club B and Club C hosts Club D, with the A/B winner hosting the C/D winner.

Back to the aforementioned scenario involving the Braves, Phillies, and Cardinals, with the first two teams tied for the NL East lead and all three tied for the second Wild Card spot. Once the Game 163 tiebreaker determines the NL East champion, the losing team would still be considered tied for the Wild Card spot. The Cardinals lost season series to both the Braves (1-6) and Phillies (3-4) so regardless of the division tiebreaker’s outcome, they would be the road team for that play-in, the winning of which would merely send them into the Wild Card game as the road team. Note that if the Padres are the third team instead of the Cardinals, they lost the season series to the Phillies (2-4) but haven’t yet finished their series against the Braves, so there’s a still chance they could be the home team if that play-in transpired.

AL Wild Cards

AL Wild Card Contenders Head-to-Head Records & Games Remaining
Team Record GB Red Sox Blue Jays Yankees A’s Mariners
Red Sox 86-65 +1.5 10-9 10-6 (3,0) 3-3 4-3
Blue Jays 84-66 9-10 10-6 (3,0) 5-2 2-4
Yankees 84-67 0.5 6-10 (0,3) 6-10 (0,3) 4-3 5-2
A’s 82-68 2 3-3 2-5 3-4 4-9 (3,3)
Mariners 81-69 3 3-4 4-2 2-5 9-4 (3,3)
Games remaining between each pair of teams in parentheses, in format (Home,Road). Yellow cells denote that team has clinched the season series.

With five straight wins over the Mariners and Orioles, the Red Sox have moved to the head of the class, and they have a relatively thin schedule the rest of the way (.486 oppo win percentage) in which their three games against the Yankees this coming weekend are the only ones against a team above .500; first they host the Mets for two, then spend their final week on the road with three apiece against the Orioles and Nationals. Their odds at claiming a spot are now 89.8%.

The Blue Jays lost the first of three to the Rays in Tampa Bay on Monday night but are still a major league best 15-4 this month. They’ve got two more there, and four in Minnesota before finishing by hosting the Yankees and Orioles for three apiece. Their odds of winning a Wild Card spot are a solid 62.6%. The Yankees, who are tied with the Orioles for the league’s worst record since August 27 (8-15), have been busy dropping key series to the Mets and Cleveland, to say nothing of their troubles with the Birds. They did beat the Rangers in the first game of their three-game series on Monday, after which they face a critical six-game road trip to Toronto and Boston before returning home to host Tampa Bay. Among the remaining AL Wild Card contenders, their weighted opponents’ winning percentage of .539 is now the highest, and their odds (40.1%) are less than half of what they were at their peak (85.7% on September 4).

In danger of fading from the picture are the two AL West contenders. Despite a five-game winning streak over the Royals and Angels, the A’s are just 9-9 this month, and their odds have fallen to 5.5%. Losing to the Mariners at home on Monday night, in the first game of a four-game set, didn’t help, particularly as they now have to run the table just to take the season series. They’ve got a tough schedule the rest of the way (.537 oppo win percentage) because in addition to Seattle, they’ve got six games left against the Astros; they close the season in Houston. They’re still better off than the Mariners, whose odds are down to 1.6%, though at least Seattle gets six games against the Angels instead of six with the Astros.

Tie-wise, the three AL East contenders have odd numbers of head-to-head games, so determining the host of a two-team play-in is straightforward. As for three-way ties, assuming it’s the beasts from the east, the order would shake out with the Red Sox getting to pick first because they own the season series advantage over the other two teams, with the Blue Jays picking second and the Yankees third. If somehow the A’s were to replace the Yankees in such a scrum, I think — but am not 100% sure based on the wording of the tiebreaker protocol (“If Club 1 has a better record against Clubs 2 and 3, and Club 2 has a better record against Club 3, then Club 1 chooses its designation, followed by Club 2”) — that the order would be Red Sox, Blue Jays, and A’s because while Boston and Oakland split their six games, the former has the better intradivision record (40-30 versus 33-31). Again the teams draft into the familiar scenario: Club A hosts Club B, with the winner hosting Club C.

A four-team scenario involving all but the Mariners would move to a ranking by combined head-to-head records. The exact order is still up in the air thanks to the Yankees having three games apiece against their AL East rivals, but if we’re doing this today it would go Blue Jays (24-18, .571, three to play), Red Sox (23-18, .561, three to play), Yankees (16-23, .410, six to play), A’s (8-12, .400). Want to swap the Mariners for the A’s? Fine, sure, whatever: Red Sox (24-18, .571, 3 to play), Blue Jays (21-20, .512, three to play), Mariners (9-11, .450), Yankees (17-22, .436, six to play). Again, the four teams draft spots, and Club A hosts Club B and Club C hosts Club D, with the A/B winner hosting the C/D winner atop the coconut tree (I might need to review my notes).

Our tiebreaker page tells us that the two-way AL tie has the best odds of any such tie scenario, at 17.1%, with a three-way tie for the second spot at 2.1%, a three-way tie for the top spot at 2.3%, and a four-way tie at 0.1%. If that doesn’t give you something to root for, then contributor Jake Mailhot has a handy guide to potential spoilers:

Now, get rooting!