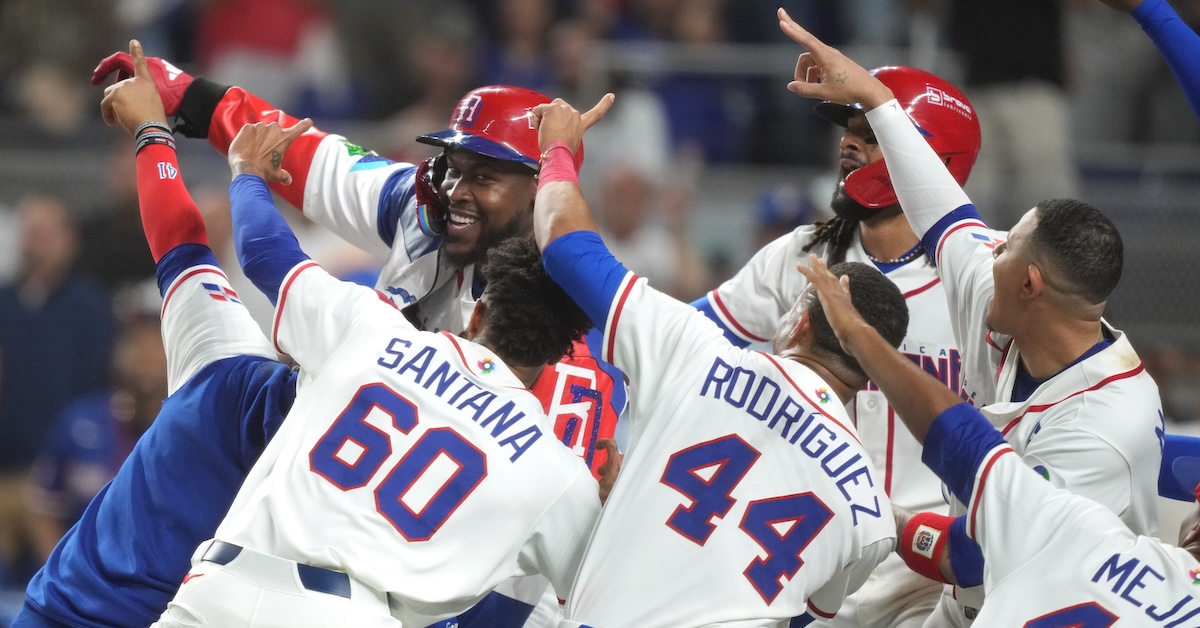
No one can deny that the first round of World Baseball Classic play was dramatic; we got the first two walk-off home runs in tournament history, and on the same day no less!
The second capped a thrilling comeback win for Puerto Rico over Panama, in San Juan, in front of one of the loudest home crowds you’ll ever see. I say “one of” because our Matt Martell was in the house for Venezuela-Dominican Republic on Wednesday night, with the roof closed at loanDepot Park, and I think he suffered the kind of systemic sonic shockwave-related physical trauma you’d get from standing too close to a rocket launch. Read the rest of this entry »
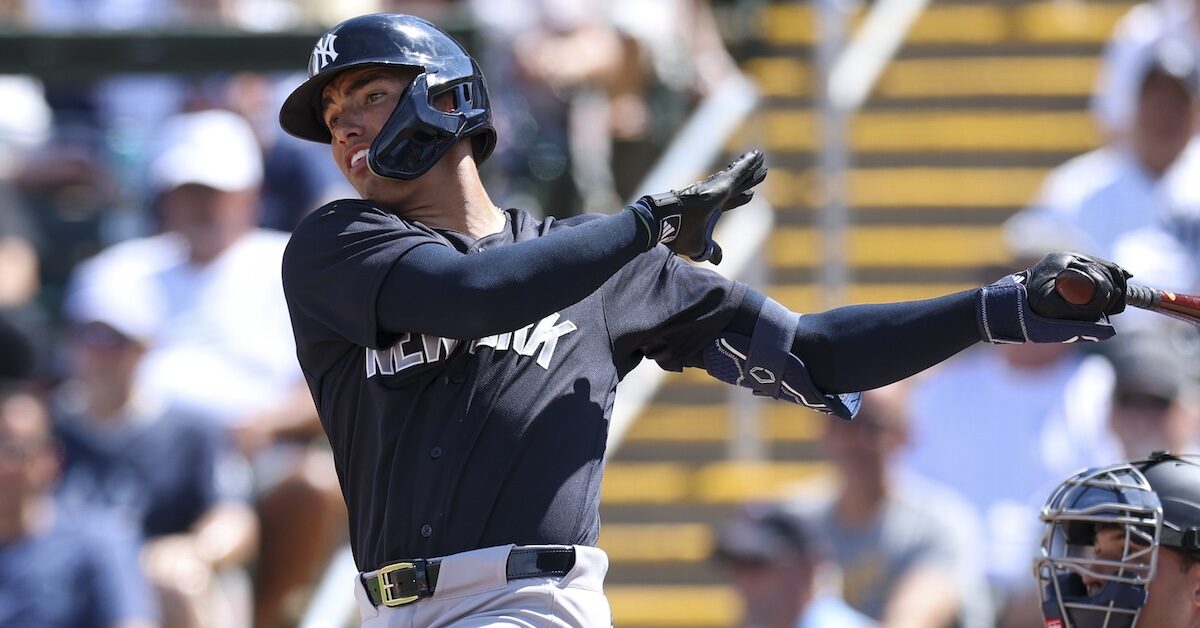
George Lombard Jr. Photo: Nathan Ray Seebeck-Imagn Images
Below is an analysis of the prospects in the farm system of the New York Yankees. Scouting reports were compiled with information provided by industry sources as well as our own observations. This is the sixth year we’re delineating between two anticipated relief roles, the abbreviations for which you’ll see in the “position” column below: MIRP for multi-inning relief pitchers, and SIRP for single-inning relief pitchers. The ETAs listed generally correspond to the year a player has to be added to the 40-man roster to avoid being made eligible for the Rule 5 draft. Manual adjustments are made where they seem appropriate, but we use that as a rule of thumb.
A quick overview of what FV (Future Value) means can be found here. A much deeper overview can be found here.
All of the ranked prospects below also appear on The Board, a resource the site offers featuring sortable scouting information for every organization. It has more details (and updated TrackMan data from various sources) than this article and integrates every team’s list so readers can compare prospects across farm systems. It can be found here. Read the rest of this entry »
Company Description
We’re the world’s leading sports technology company, at the intersection between sports, media, and betting. More than 1,700 sports federations, media outlets, betting operators, and consumer platforms across 120 countries rely on our know-how and technology to boost their business.
Job Description
ABOUT US:
Synergy Sports is seeking motivated candidates to work as Video Scouts for the 2026 Cape Cod Baseball League season – the premier collegiate summer wood-bat league in the United States. Synergy Sports provides world-class video scouting for baseball globally at all professional and amateur levels. We are the exclusive video provider of the CCBL to Major League clubs.
Cape Cod Video Scouts will capture live multi-angle video footage from every game of the CCBL season and upload video/data to the Synergy platform for client use. Video Scouts may also be asked to track rosters and perform various data audit projects throughout the summer. The Video Scout position is in conjunction with Blast Motion, where you will also be responsible for the distribution of Blast sensors to each player pre-game and collection/upload of Blast swing data. Many past Synergy Video Scouts have moved on to roles with Major League and Collegiate baseball organizations. The position will run from early June to mid-August and will include hourly compensation.
We are also hiring Regional Video Scouts to fulfill similar responsibilities for various showcases and tournaments throughout the summer of 2026. We are looking for Video Scouts in the Southeast (GA, FL, AL, NC), Southwest (CA, AZ, TX), Midwest (IN, IL, KC), and Northeast (NY, MA, PA).
THE CHALLENGE:
Manage game day video and technology equipment for data capture.
Manage distribution and collection of Blast Motion sensors.
Serve as Synergy liaison on-site for Cape Cod teams and pro scouts.
Track and update rosters and player information.
Verify data accuracy and video quality.
Provide daily updates to staff and content partners.
ABOUT YOU:
Knowledge of and strong interest in baseball operations, amateur scouting, or
player development.
Proficiency with computers (Windows, Mac).
Experience with video equipment, including cameras, SD cards, tripods, and
clamps is preferred.
Experience in College Baseball, Softball, or Minor League Baseball is a plus.
Strong work ethic, organizational skills, and attention to detail.
Must have access to reliable transportation and housing on the Cape.
Payment: $15 per hour. Daily wage earned is dependent on number of games worked.
Additional Information Sportradar intends to offer the selected candidate base pay within this range, dependent on job-related, non-discriminatory factors including but not limited to experience, qualifications, and location. Base pay is just one component of the Total Rewards that Sportradar provides to compensate and recognize employees for their work. Sportradar offers best-in-class benefits such as a comprehensive benefits package, performance bonus program, equity stock purchase and 401k contribution. Please consult with your recruiter to learn more as all benefits are subject to eligibility requirements.
At Sportradar, we celebrate our diverse group of hardworking employees. Sportradar is committed to ensuring equal access to its programs, facilities, and employment opportunities. All qualified applicants will receive consideration for employment without regard to age, race, color, religion, sex, sexual orientation, gender identity, national origin, disability, or status as a protected veteran. We encourage you to apply even if you only meet most of the requirements (but not 100% of the listed criteria) – we believe skills evolve over time. If you’re willing to learn and grow with us, we invite you to join our team!
Ben Lindbergh and Meg Rowley banter about Team Italy’s triumphs (and good vibes) at the WBC, a tumultuous week for Team USA and Mark DeRosa, and where the tournament stands entering the quarterfinals, then preview the 2026 Philadelphia Phillies (39:21) with The Athletic’s Matt Gelb, and the 2026 Los Angeles Angels (1:21:00) with The Athletic’s Sam Blum, plus a postscript (2:09:08).
I’ve now spent nearly a quarter of a century working with baseball projections, and in that time, I’ve always been struck by the certainty with which so many people view them. People are far more certain than they should be that great teams will be great, star players will be stars, and so on. However, one of the things that comes from working with projections for a big chunk of your life is that you develop a painful awareness of how much of the future cannot be known until it actually happens.
As in most seasons, we enter without a general conception of which teams will be the best. We may pretend everyone starts off with a clean slate, but absolutely nobody expects the Rockies to be better than the Dodgers. But even if that particular scenario is extremely unlikely, every one of the top teams has a scenario in which things fall apart. These clubs have a vested interest in protecting against that potential downside, as much as possible, so I thought it would be interesting to look at the doomsday scenario for some of the best teams in baseball.
To get an idea, I did a full seasonal simulation of the ZiPS projected standings, and instead of looking at the standings overall, I looked at the bottom 20% of outcomes to see what we could glean from the results. According to ZiPS, every team except the Dodgers misses the playoffs when it performs no better than its 20th-percentile win total.
Philadelphia Phillies: Rotation Depth
This almost seems counterintuitive given just how good the rotation projections are for the Phillies, but the projections are not enthusiastic about their depth here. And what makes that especially worrisome is that with so much uncertainty around the health of Zack Wheeler and the performance of Aaron Nola, Philadelphia is probably going to need that depth more than it did last year. This time around, the Phillies are missing Ranger Suarez, who signed with the Red Sox during the offseason. Andrew Painter was healthy in 2025, but one cannot ignore that he was rather middling against Triple-A hitting. The outfield looks like a problem, as well, but it generally has been, and ZiPS is a fan of Justin Crawford.
If Philadelphia adds one of the innings-eaters still available in free agency, ZiPS sees the team’s outlook improve, much more than I expected. Just having someone like Lucas Giolito, Tyler Anderson, or even Patrick Corbin around did a lot to alleviate the rotational downside. It may come down to which of these pitchers is open to a swing role or a minor league deal with an opt-out date. And yes, I do think it feels weird to suggest Corbin as an upgrade for a team in 2026.
New York Mets: Right Field
The Mets certainly don’t dominate in either the rotation or bullpen projections, but ZiPS is fairly confident that both of these units will hold up over the course of the season. Despite a solid projection for Carson Benge in right field, the range of outcomes is quite high, and in the simulations where Benge struggles, ZiPS has trouble competently filling in right field. Tyrone Taylor is an underwhelming option, and ZiPS thinks Brett Baty would have a tough time defensively in the outfield. With no particularly interesting outfielders available in free agency, the best solution might simply be making sure Jacob Reimer gets some time in the outfield. New York’s roster just isn’t really set up to get him time at third base, where he probably is most valuable. But he also represents the most tantalizing 2026 upside of any player the Mets have in the minors, so they ought to try and be open to promoting him aggressively, and getting a little weird with it, if need be.
New York Yankees: Injuries
The Yankees’ outcomes are weird, in that their bad seasons were mostly ones in which Aaron Judge, for whatever reason, ended up with fewer than 300 plate appearances, and only occasionally something else. Getting limited innings from Gerrit Cole and Carlos Rodón was already baked into the cake, and ZiPS thinks there are enough fourth-starter types to patch up any rotation holes that might pop up. The problem is, just how do you replace Judge? I’m not sure there’s a scenario where the Yankees can do much to mitigate any risk there, for the simple reality that in a tightly projected division, suddenly losing six wins is likely to drop them out of the AL East divisional race. At the very least, the Yankees should hold off on shopping Spencer Jones for help elsewhere, but it wouldn’t fix a Judge loss.
Baltimore Orioles: Rotation Quality
Baltimore has potential aces in both Trevor Rogers and Kyle Bradish, but that word potential is an unpleasant adjective. Adding Pete Alonso and Taylor Ward really stabilizes the offense, which was a concern last year, but the rotation is an issue. The Orioles finished with a bottom five rotation in the ZiPS simulations more often than all other AL East teams combined. There’s nothing on the farm that helps this, and I think that with the Orioles increasingly pushing their chips in, they ought to be aggressive at taking the opportunity to loot struggling teams of their top pitching, even if the prospect hit would be tremendous. I think there are even scenarios, though not many, in which it might make sense for the O’s to trade either Adley Rutschman, assuming he has a bounce-back season, or Samuel Basallo.
Boston Red Sox: First Base
The good news is that ZiPS sees the Red Sox as the most stable of AL contenders, with the lowest percentage of sub-.500 seasons of any AL team. The rotation isn’t the best in baseball, but it may be the most bulletproof one, and that isn’t even counting on getting lots of innings from pitchers like Payton Tolle and Connelly Early, who would be Plan As in most rotations in baseball. In fact, when the Red Sox had their worst performance, it was almost entirely the offense that fell short, and not necessarily from the position you might expect.
Most people have focused on third base because of the loss of Alex Bregman, but Caleb Durbin is actually a decent option. Plus, if Durbin struggles, Marcelo Mayer could very likely provide what the former isn’t. Where there is real downside risk is at first base. I liked the Willson Contreras acquisition, too, and he’s probably going to be at least solidly average in 2026, but he’s also going to be 34 in May. It’s an age where you look at the long left tails of the outcome distribution for non-elite first basemen, and there’s always a real risk of a very sudden plummet off a cliff. Triston Casas hasn’t played in a game since last May — and won’t even play in any spring training games this year — and he has a real mixed history.
What to do? That’s a lot trickier. Boston obviously isn’t going to replace Contreras before he has that downside year. But this team should be ready for that possibility, and if the surplus of pitching turns out to be real, the Sox will have a position of depth from which to trade.
Chicago Cubs: Rotation Quality
The outlook improved with the addition of Edward Cabrera, but ZiPS still has the Cubs with the weakest rotation of the 10 teams listed here. In the ZiPS simulations, the rotation was largely the source of the Cubs’ worst seasons. There aren’t really any exciting starters left out there in free agency, but I think I’d do what I suspect the Cubs are already thinking of doing: giving Ben Brown’s upside as a starting pitcher more serious consideration. He allowed too many home runs and had a high BABIP on a really good defensive team, but it’s guys like that who tend to come out of nowhere quickly (see Corbin Burnes in 2019). Brown has swing-and-miss stuff, and I think given the potential, I’d rather see him starting at Triple-A than pitching in relief in the majors.
Houston Astros: Outfield Corners
Not counting 2020, for obvious reasons, the 686 runs the Astros scored in 2025 represented their fewest since 2014. A full, healthy season of Yordan Alvarez would be incredibly helpful, but the team’s also not likely to wring another 135 wRC+ out of Jeremy Peña. Not helping matters is that Joey Loperfido and Cam Smith project as one of the weakest corner outfield tandems in the majors in 2026. Smith surprised many, including me, in the early months last year, but an OPS that fell shy of .500 in the second half is highly concerning. There’s a chance that the Astros get little from their outfield corners, which is a problem for a team with a middling offense that just lost ace Framber Valdez in free agency. In some 30% of simulations, the Astros got a sub-90 wRC+ out of their corner outfielders, and in those runs, they had a .475 winning percentage. If there’s a team that should aggressively go after either Jarren Duran or Wilyer Abreu, it’s Houston.
Toronto Blue Jays: Rotation Depth
Even with the loss of Anthony Santander to shoulder surgery, ZiPS still sees the Blue Jays’ rotation as their biggest pain point. There are simply a lot of question marks once you get past Dylan Cease and Kevin Gausman, something I mentioned a bit in Toronto’s ZiPS rundown in January. In a lot of the sims, the team got next to nothing out of any of Cody Ponce, José Berríos, Shane Bieber, and Max Scherzer, whether because of injury, decline, or general performance issues. If Sandy Alcantara looks anywhere near his old self with the Marlins in the early months, I think the Jays ought to be one of his suitors. At the very least, Alcantara would do well with an infield that has Andrés Giménez and Ernie Clement.
Seattle Mariners: Outfield Corners
As with the Astros, ZiPS sees Seattle’s corner outfield spots as having the most downside. Unlike the Astros, ZiPS doesn’t view it as truly a doomsday scenario. After the Red Sox and Dodgers, ZiPS considers the Mariners to be the contender with the least downside. Randy Arozarena’s projection distribution is pretty interesting, with the bottom falling out of him once you get under the 15th-percentile projection or so; while his 20th-percentile OPS+ is a non-disastrous 94, it drops to 70 for the 10th-percentile level. As for Victor Robles, he’s been all over the place in his career, and the Plan Bs in the organization are unimpressive. I think Seattle’s strong enough that it doesn’t necessarily have the same need to be aggressive as Houston does, but this is still a potential point of weakness that could pose an issue.
Los Angeles Dodgers: Black Swans
It’s really hard to kill the Dodgers. I argued after the 2024-2025 offseason, a very busy one, that the Dodgers weren’t really improving their average outcome so much as drastically raising their floor. I stand by it; they’ve added Kyle Tucker and Edwin Díaz while losing nobody who was crucial to the 2025 team. That doesn’t mean they’re going to be projected to win 105 games or anything, but it does mean that in most of their worst projected outcomes, they’re still a playoff contender. Their 10th-percentile projection, for example, is 86 wins. Their 2% chance of finishing below .500 is the smallest percentage I’ve ever projected, a record that now goes back more than 20 years. Doomsday for the Dodgers may require an actual doomsday scenario like societal collapse, nuclear war, or a vacuum metastability event. Since I do not know how to prevent any of those, there’s nothing more I can add.
Dan Szymborski: A rarity! Dan is on time and not distracted by arguing something with someone elsewhere
12:00
robertobeers: A man a Dan a chat cat update tadputactahcanadanama
12:00
Poncetification: When pondering Ponce, how does ZiPS weigh the surge in Korea vs more mediocrity in Japan vs MLB and MiLB way back when?
12:01
Dan Szymborski: Most strongly (since it’s most recent), but it’s also treated like a league between AA and AAA
12:01
Dan Szymborski: That doesn’t mean the best players aren’t as good as MLBers, but the depth of talent isn’t the same, and a pitcher/hitter will face mostly non-MLB talents’
12:02
Dan Szymborski: ZiPS sees NPB as between AAA and MLB
We’ve made two major updates to the FanGraphs Lab. Below, you’ll see an overview of the new capabilities. You can also see a list of all of the Lab upgrades and bug fixes, minor and major, here. Sean has been busy elsewhere, too, which you can read about here.
Squared-Up Explorer
The initial iteration of the Squared-Up Explorer used a pre-calculated dataset to handle the extensive transformations that take a raw set of batted ball data and turn it into an interpolated chart. We used that method to get the tool in front of people as quickly as we could, but the long-term goal was always to connect to the main FanGraphs database to allow more years of data, finer slicing, and increased flexibility across the board.
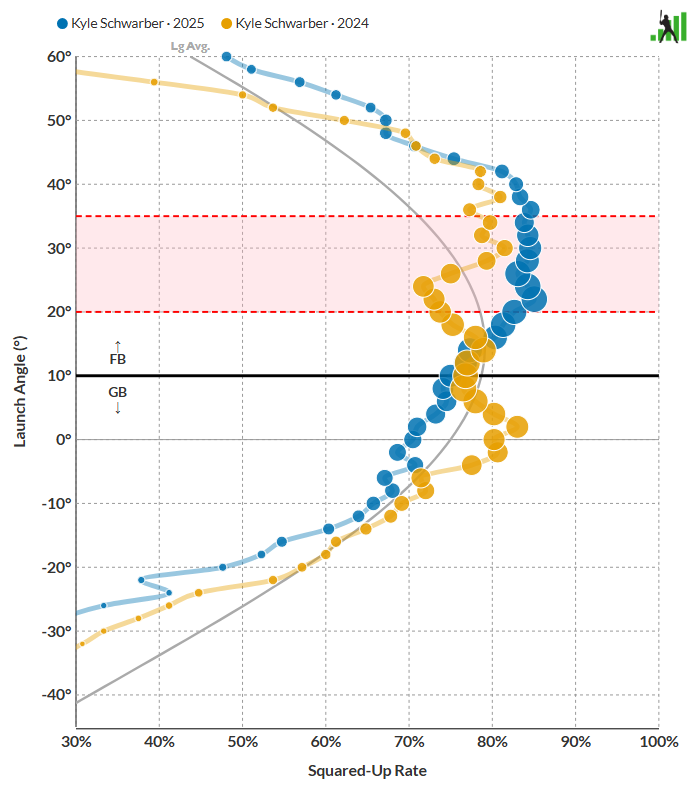
Sean and David Appelman built the necessary tools to handle the data processing in the background, before it ever hits Squared-Up Explorer. That expanded the capabilities of the tool significantly. Sean and Ben then rebuilt the user interface with the new capabilities in mind. Want to see how Kyle Schwarber hit for so much more power in 2025 than he did in 2024? You can compare his swing:
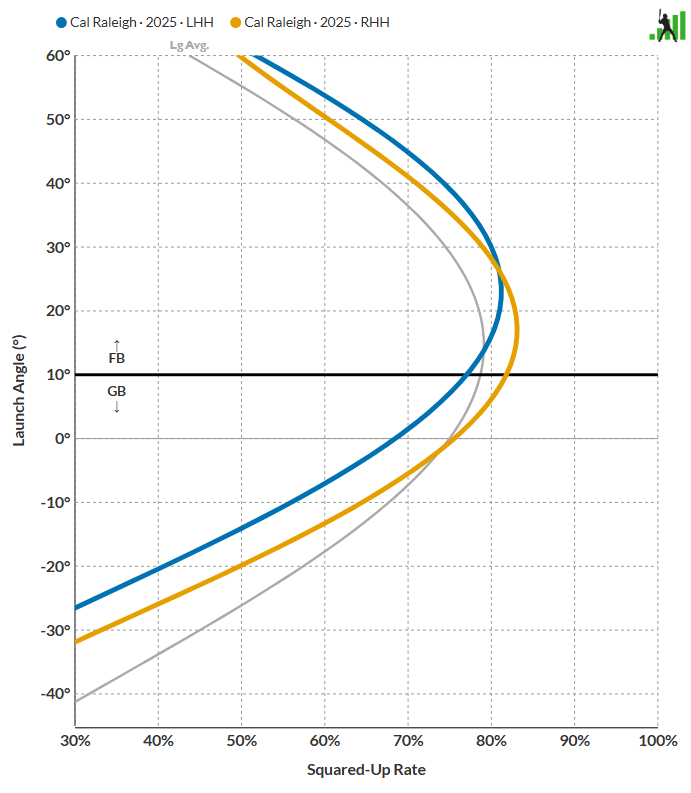
Want to dig into Cal Raleigh’s tendencies from each side of the plate? We’ve got you covered:
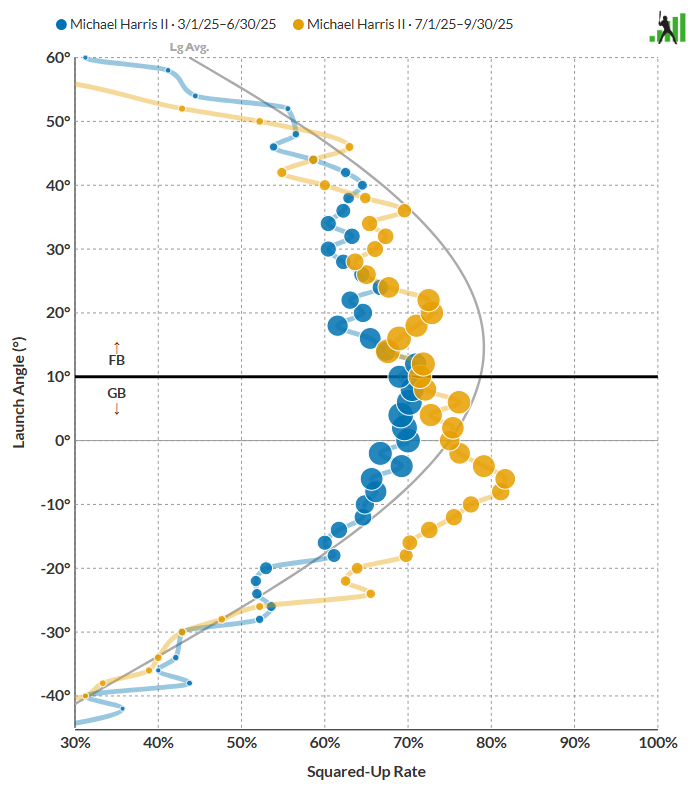
Want to look into Michael Harris II’s wild first-half/ second-half splits? It’s as simple as deciding which date ranges you care about. It turns out that your batted ball results will improve if you just square up everything more frequently, and get more balls in the air while you’re at it:
With the new data architecture in place, you can select by batter handedness, pitcher handedness, pitch type, and even time span. Mookie Betts against lefty four-seamers early in the year? Sure thing. Ozzie Albies batting righty against sinkers? You can do that too. You can even compare someone to another player or themselves over a different time period, against a different pitch type, or any permutation of these options.
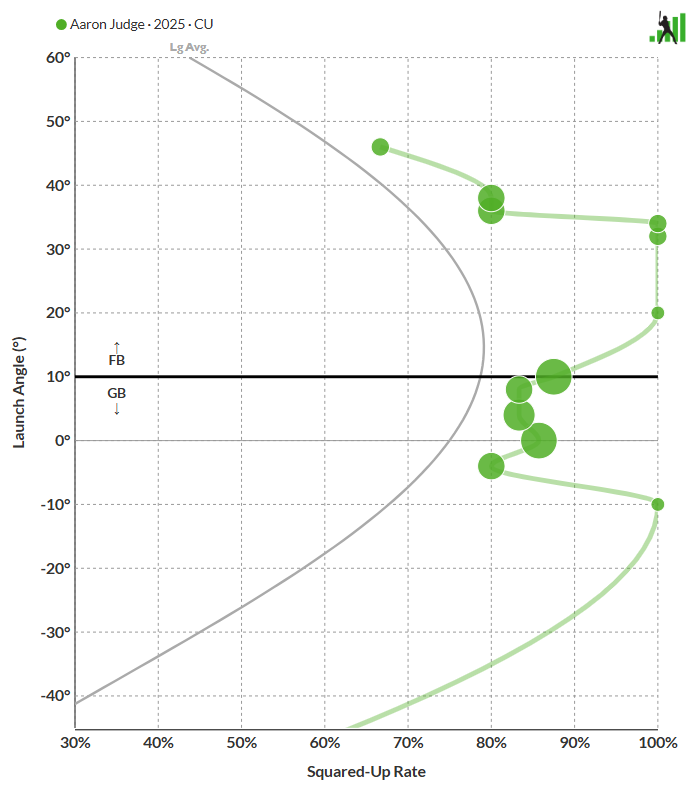
Slicing up aggregated data into tiny sample sizes like this is definitely going to result in some weird charts. For example, here’s what Aaron Judge did against curveballs in 2025:
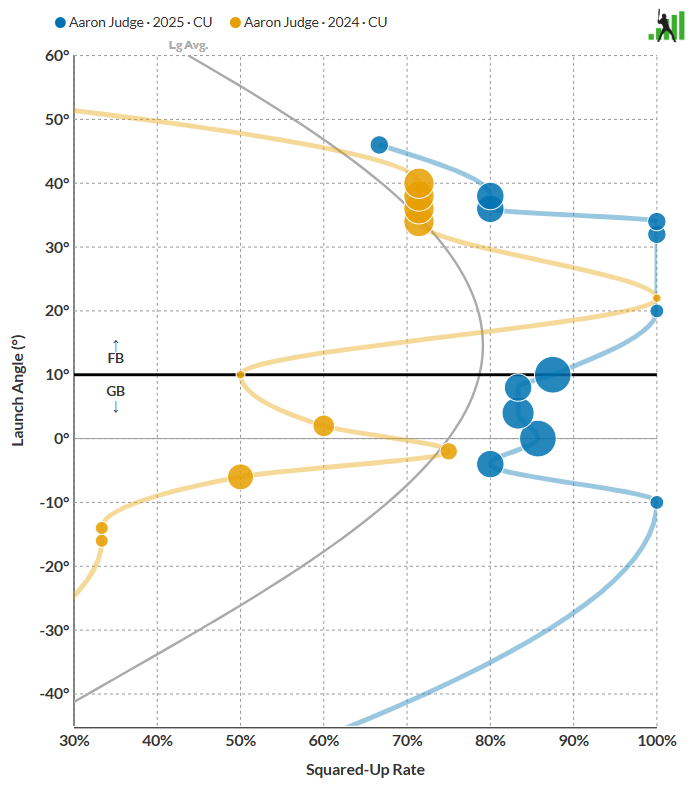
With so few observations, extreme values are bound to happen, like the multiple launch angles where Judge squared up every curveball he put into play. When you split things this minutely, be aware that the resulting charts are descriptive but volatile. There aren’t that many batted balls of separation between 2025 and 2024 here, and yet the charts and interpolated lines look quite different:
We mention that merely as a word of caution as you interpret results, not to say that you can’t use the Explorer this way. Batters really do have different swing profiles against different pitch shapes, and it’s fun to investigate that visually. Just take the results with a grain of salt, the same way you would with any small-sample baseball dataset. We’ve added a line to the summary statistic table showing the number of batted balls that make up each graph so that you can see for yourself. For example, Judge’s two years of data cover 17 and 18 curveballs, respectively.
We’ve also added a few other upgrades to complement the newly available data. Hovering over a frequency bubble now displays launch angle, squared-up rate, and relative frequency. The interpolation behavior has been updated to change dynamically with the chart orientation. We’ve also added detail to the legends and descriptors to make it easier to see which split you’re viewing. Try it out – we think you’ll like the upgrades.
Hot Streak Tool Update
We received a huge number of feature requests to upgrade our Hot Streak tool, and Sean bundled many of them into a single large update.
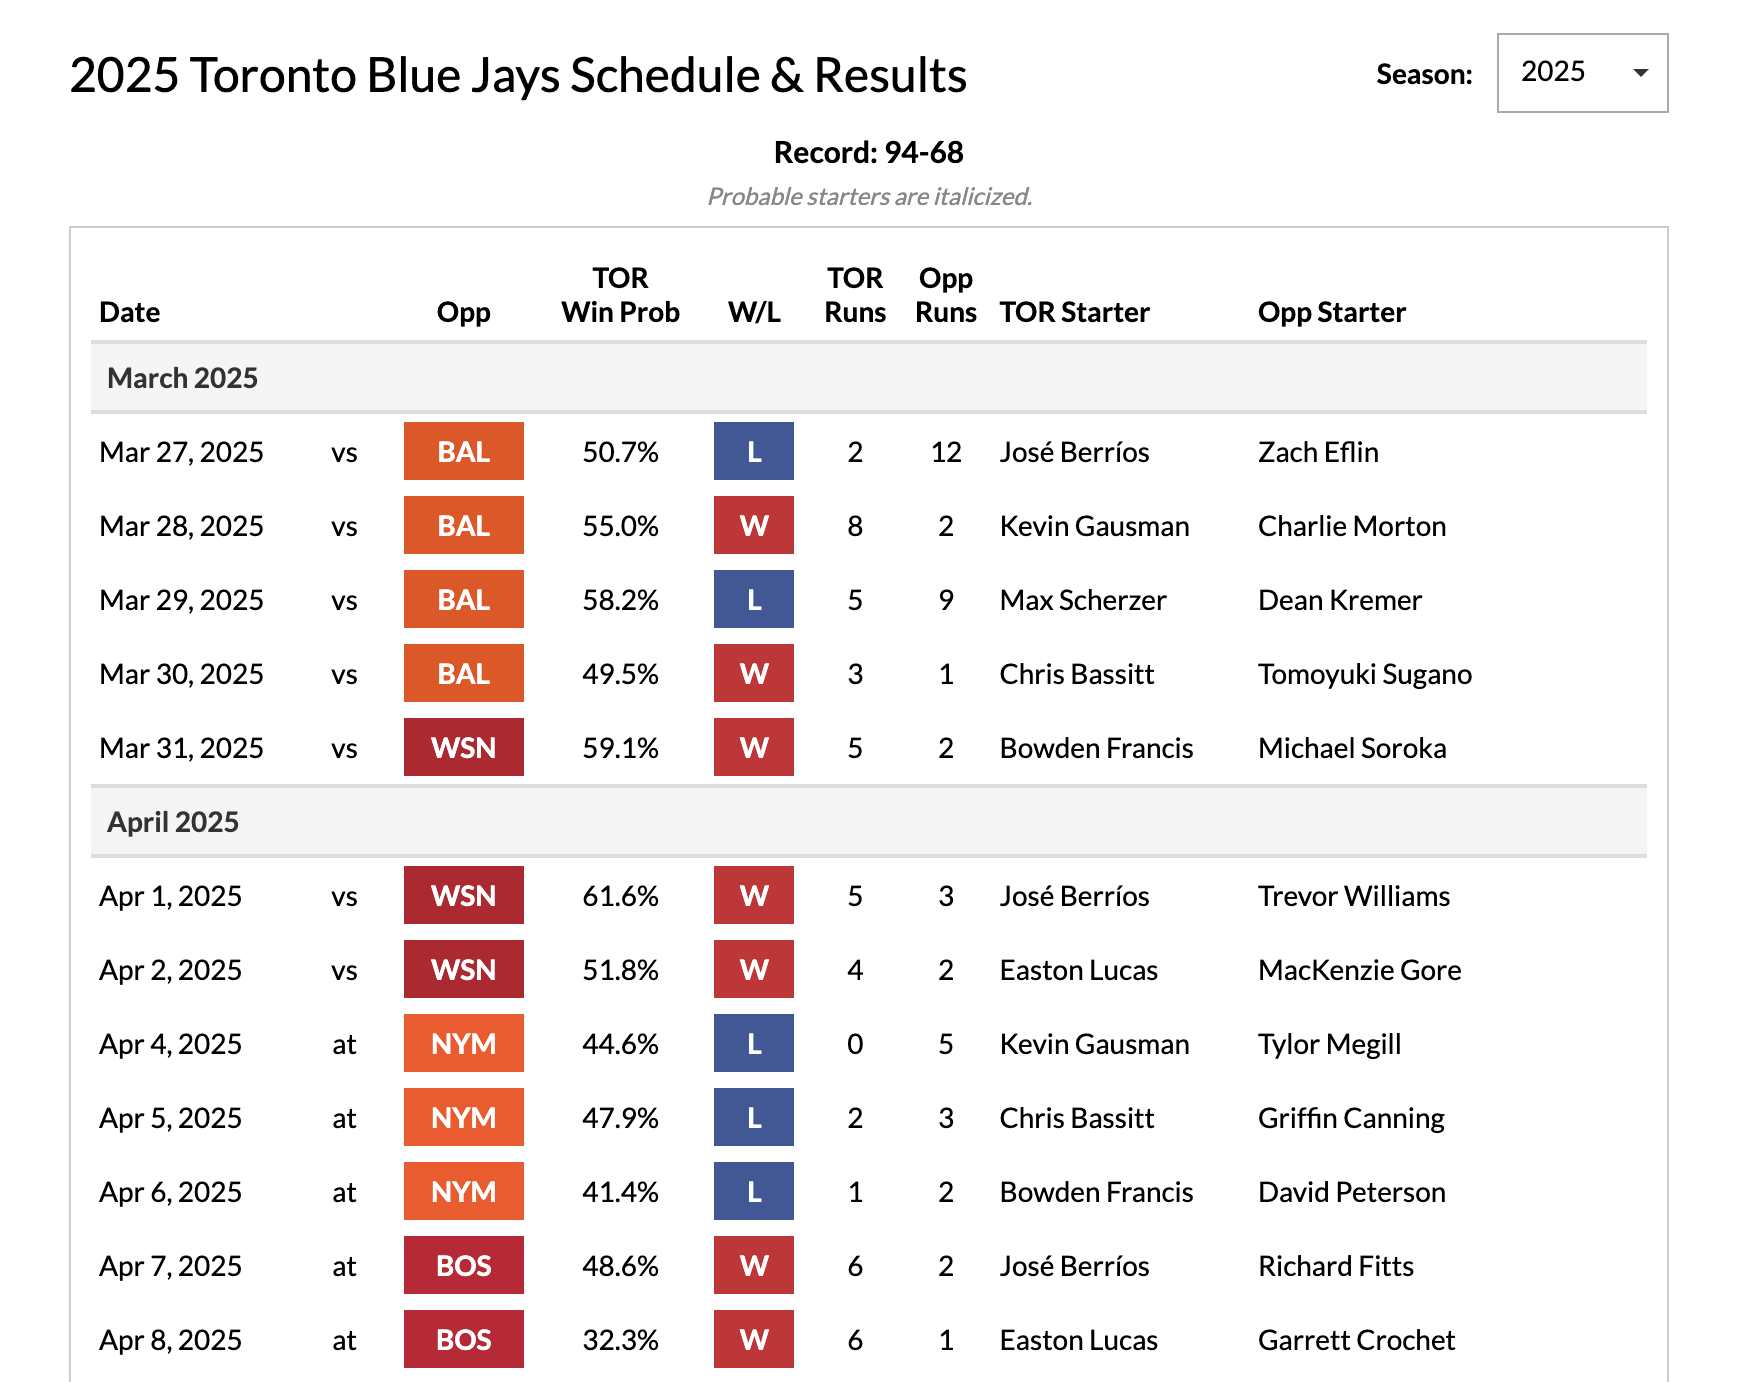
Opponent Information
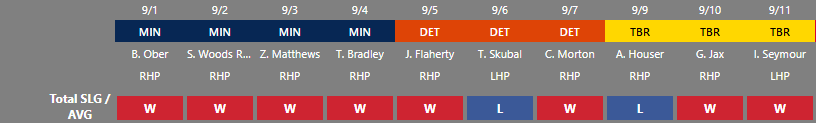
Each game now displays the opposing team, opposing team’s starting pitcher, and that pitcher’s handedness. In addition, the opposing team’s name is a link to that team’s Hot Streak page:
More Stats
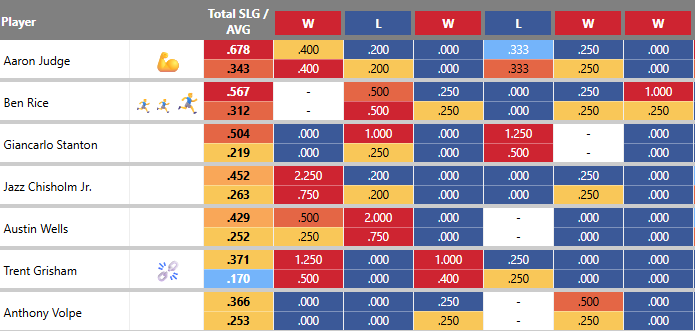
We’ve added wOBA, xwOBA, xSLG, and xBA to the statistics that are available to chart. We’ve also added the ability to display two statistics stacked on top of each other in the same table. Want to see power and contact together? Now you can:
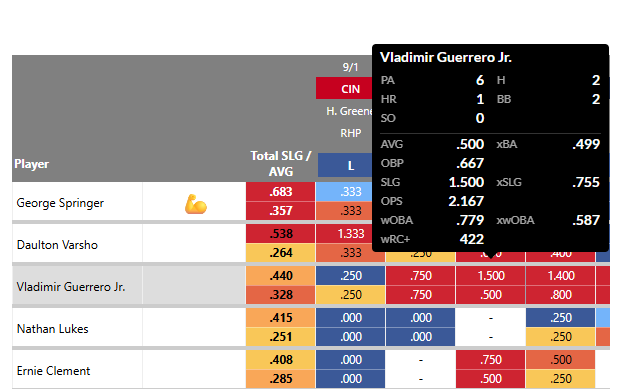
More Context
Even when you’re displaying two statistics at once, valuable data could still be missing. Our solution? A tooltip with a detailed line score for each player and game:
More Sortability
Want to see the most recent games first? You can now choose between oldest-to-newest and newest-to-oldest.
That’s the latest and greatest in the FanGraphs Lab. We hope you’ll enjoy trying out these enhancements. And if these tools aren’t quite your speed, stay tuned. We’ll be addressing team strength and pitch pairings in our next release, and we have a few other ideas percolating.
As part of our effort to build the best possible version of FanGraphs, we regularly roll out new site features and refine existing ones. It can be easy to lose track of all the changes, so we thought it would be useful to start giving a semi-regular overview of what we’ve been doing on the development side of the site. This is the first of those updates, with a focus on the new tools we’ve added over the offseason, as well as the work we’ve done recently to improve Member features and your experience of the site.
First, here are a few important updates we’ve already announced, in case you missed them:
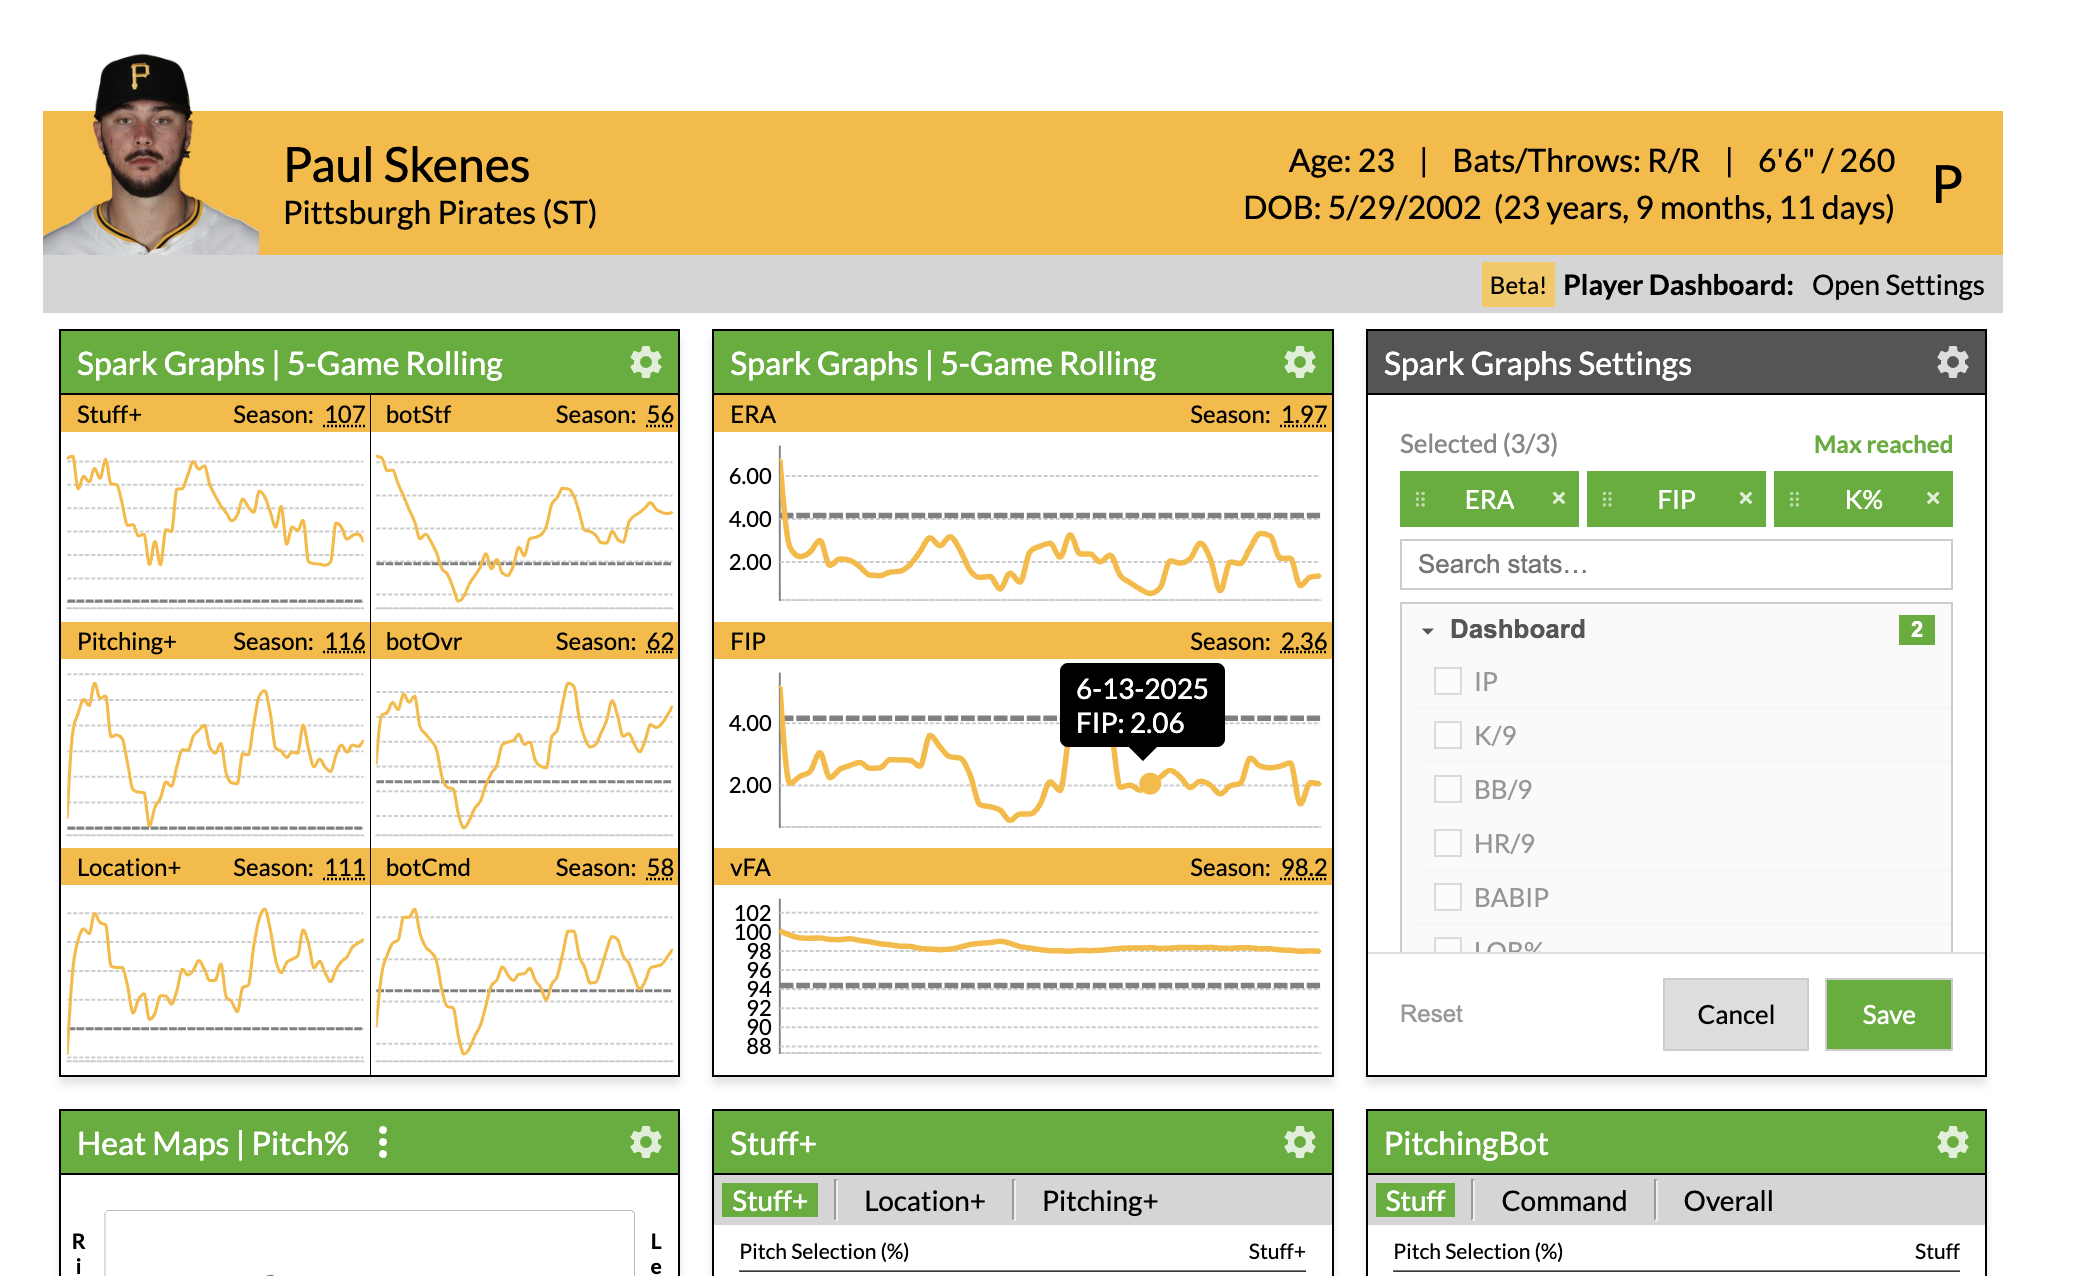
Members have been able to create their own player page dashboards since 2024, but now you are able to further customize the settings of some of the cards by pressing the gear icon (⚙) in the top right corner of the card:
Spark Graphs: You can now pick your stats based on what we have available in the Game Logs. You are even able to use the Spark Graphs in multiple slots in your dashboard and feature different stats on each one.
Heat Maps: You can now set your default stat.
Stuff+ and PitchingBot: You can choose your default model (Stuff+, Location+, or Pitching+ for Stuff+, and Stuff, Command, or Overall for PitchingBot).
News: You can filter by article type (FanGraphs/RotoGraphs), and choose to hide injury information or the Rotowire news lines.
As a reminder, custom cards currently need to be set separately for pitchers and batters, so you’ll need to configure your dashboard for a pitcher and a batter initially. You can’t change your cards as a non-Member, but you can open the dialog box and preview the available options.
App Updates
If you haven’t used the FanGraphs app in a while, a lot has changed. Over the past few months, we have made the following updates:
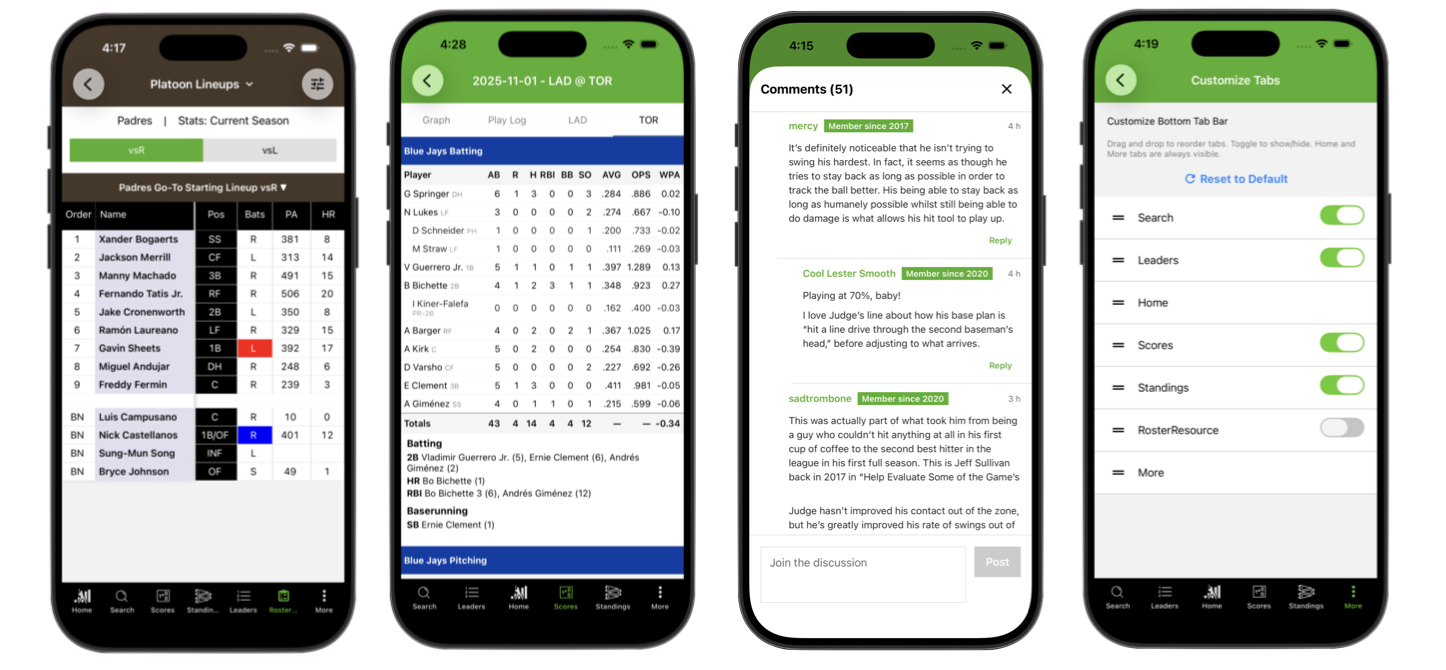
Added comments on articles
Added several RosterResource pages:
Platoon Lineups
Closer Depth Charts
Transaction Tracker
Offseason Tracker
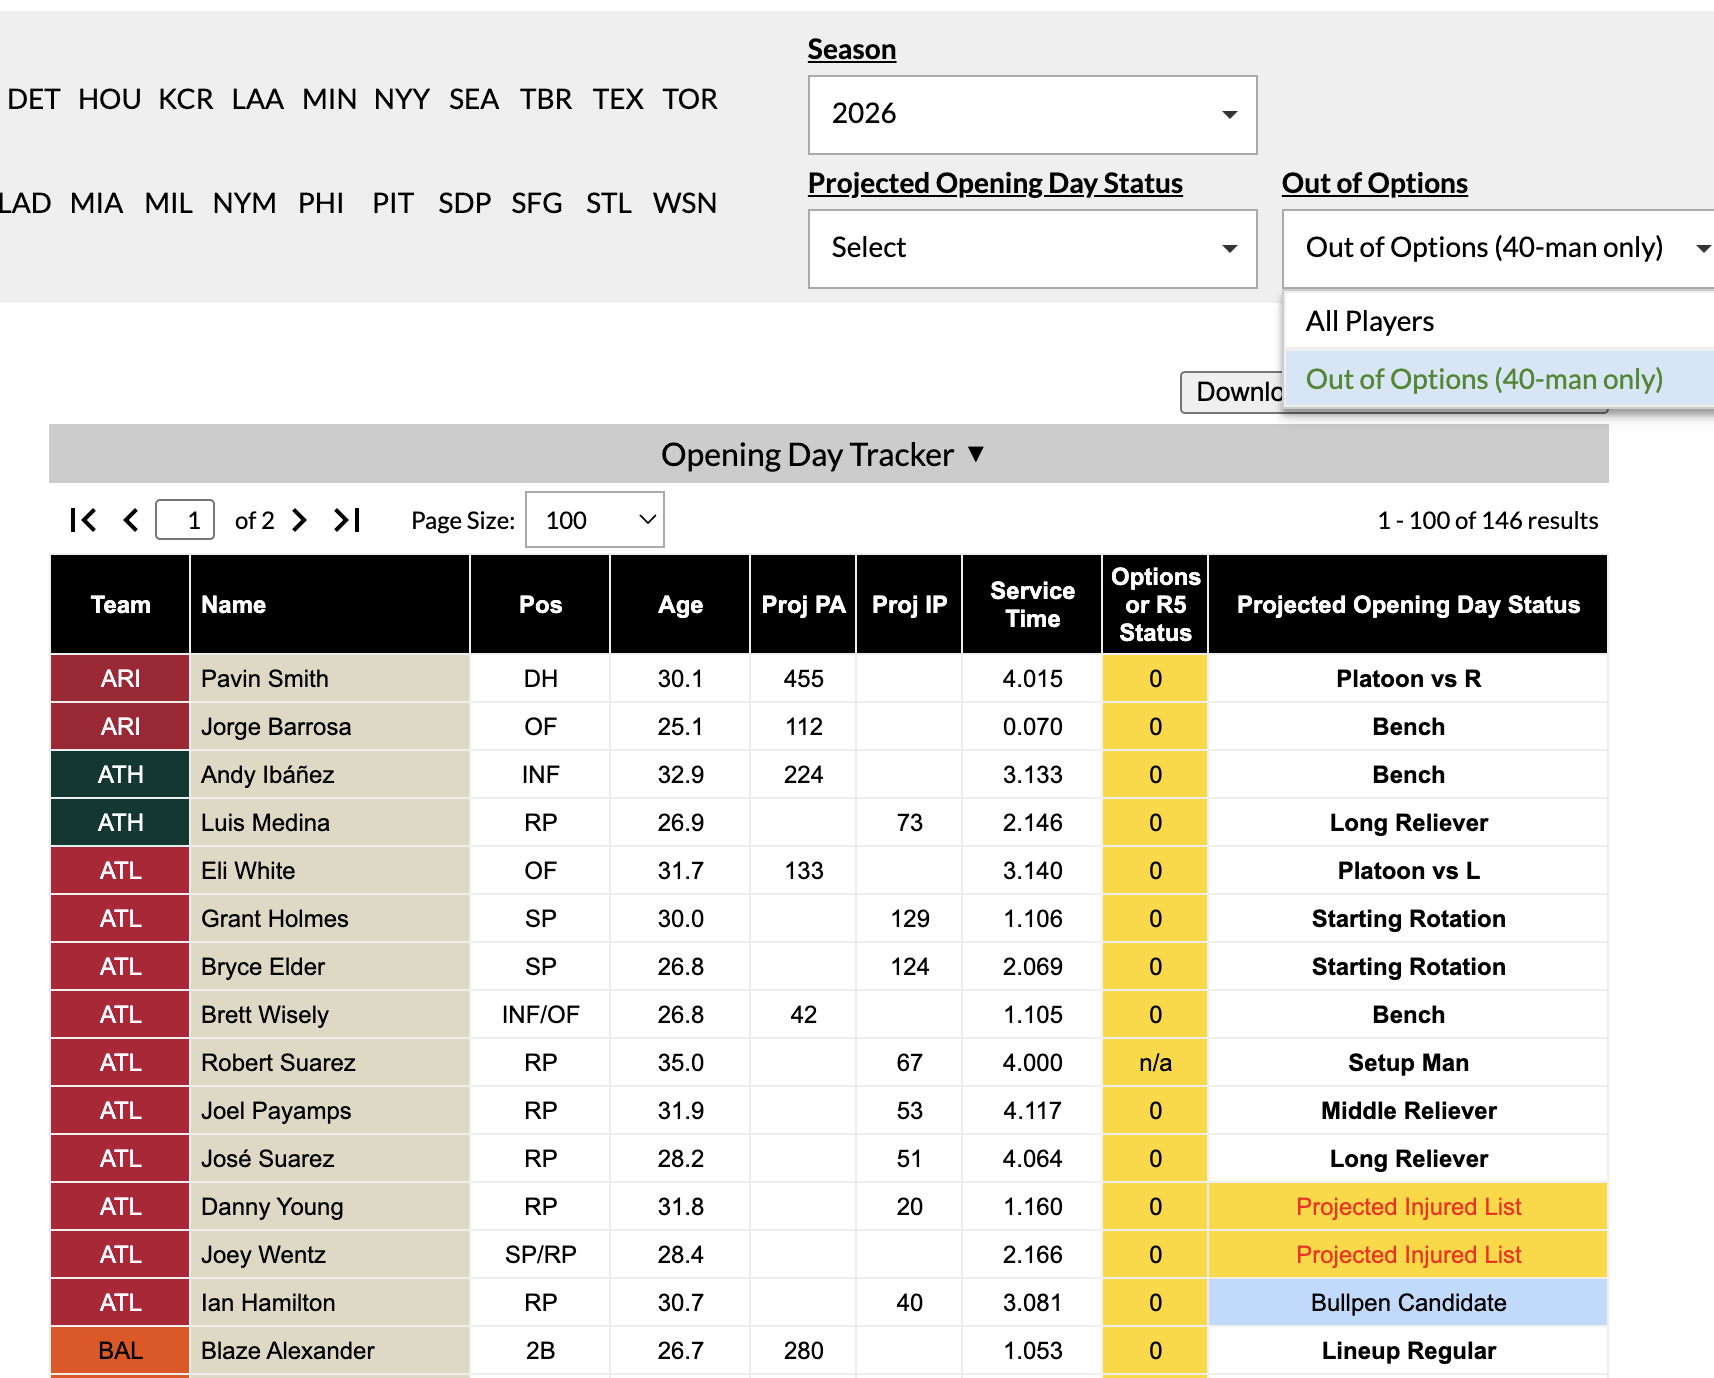
Opening Day Tracker
Added some of the site’s simpler leaderboards:
WAR Leaders
Spring Training Leaders
College Leaders
KBO Leaders
NPB Leaders
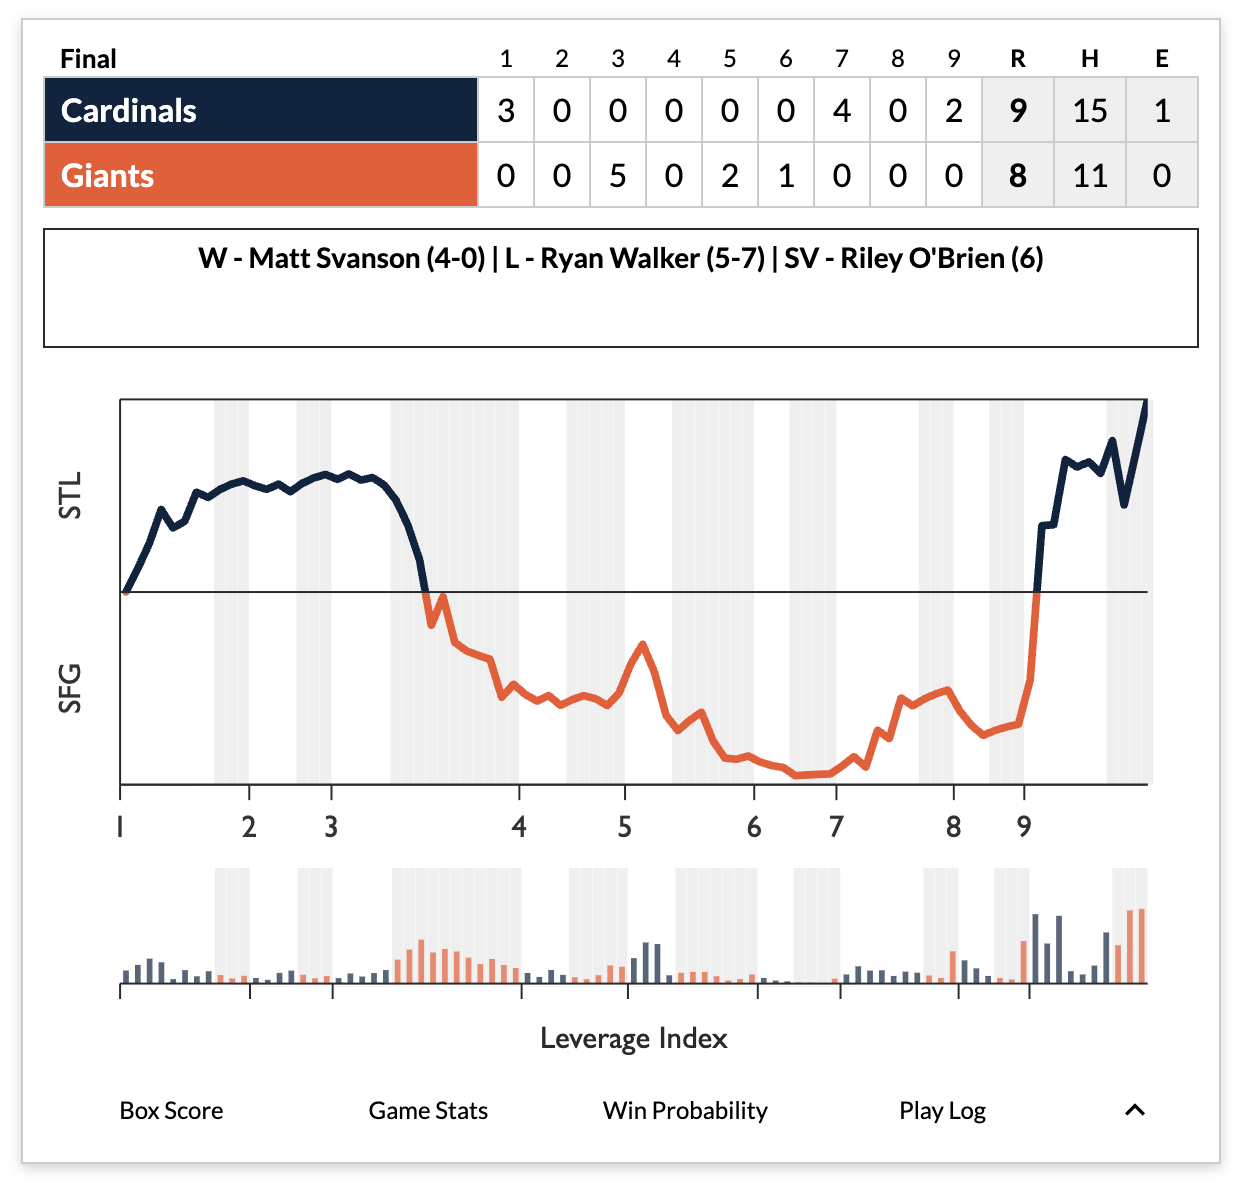
Updated our Win Expectancy Graphs and Box Scores to match the site’s update (more on that below)
Added Pythagorean and BaseRun Records (available under Standings)
Added Playoff Odds Graphs (available under Standings)
Members can share articles from the app
Members can customize their bottom tab bar
Tool Updates
At the very end of last season, we updated the Win Expectancy Graphs to use team colors, and we flipped the y-axis to more naturally reflect the home and away teams:
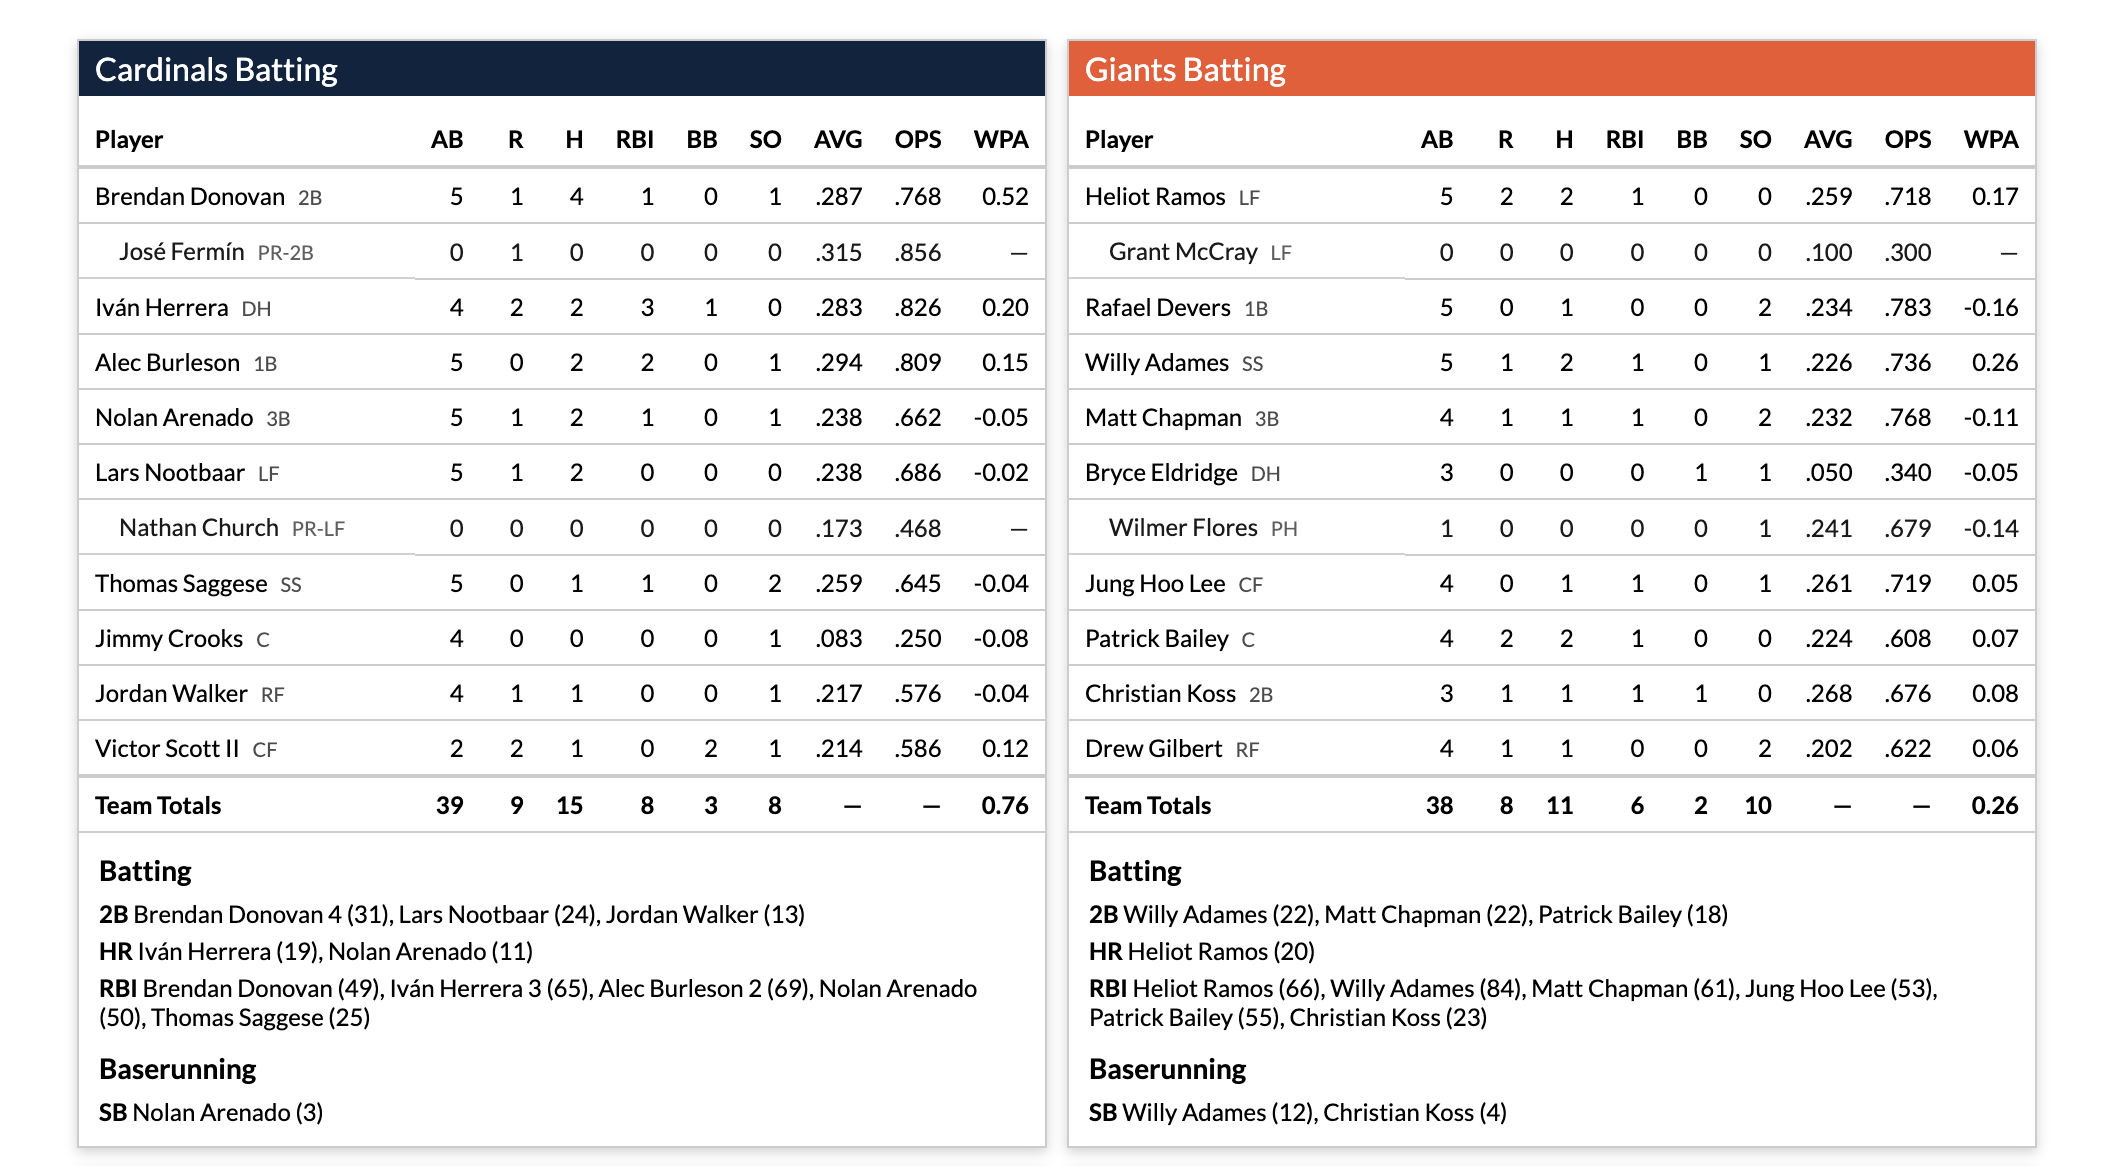
We’ve improved our box scores to reflect more familiar formatting:
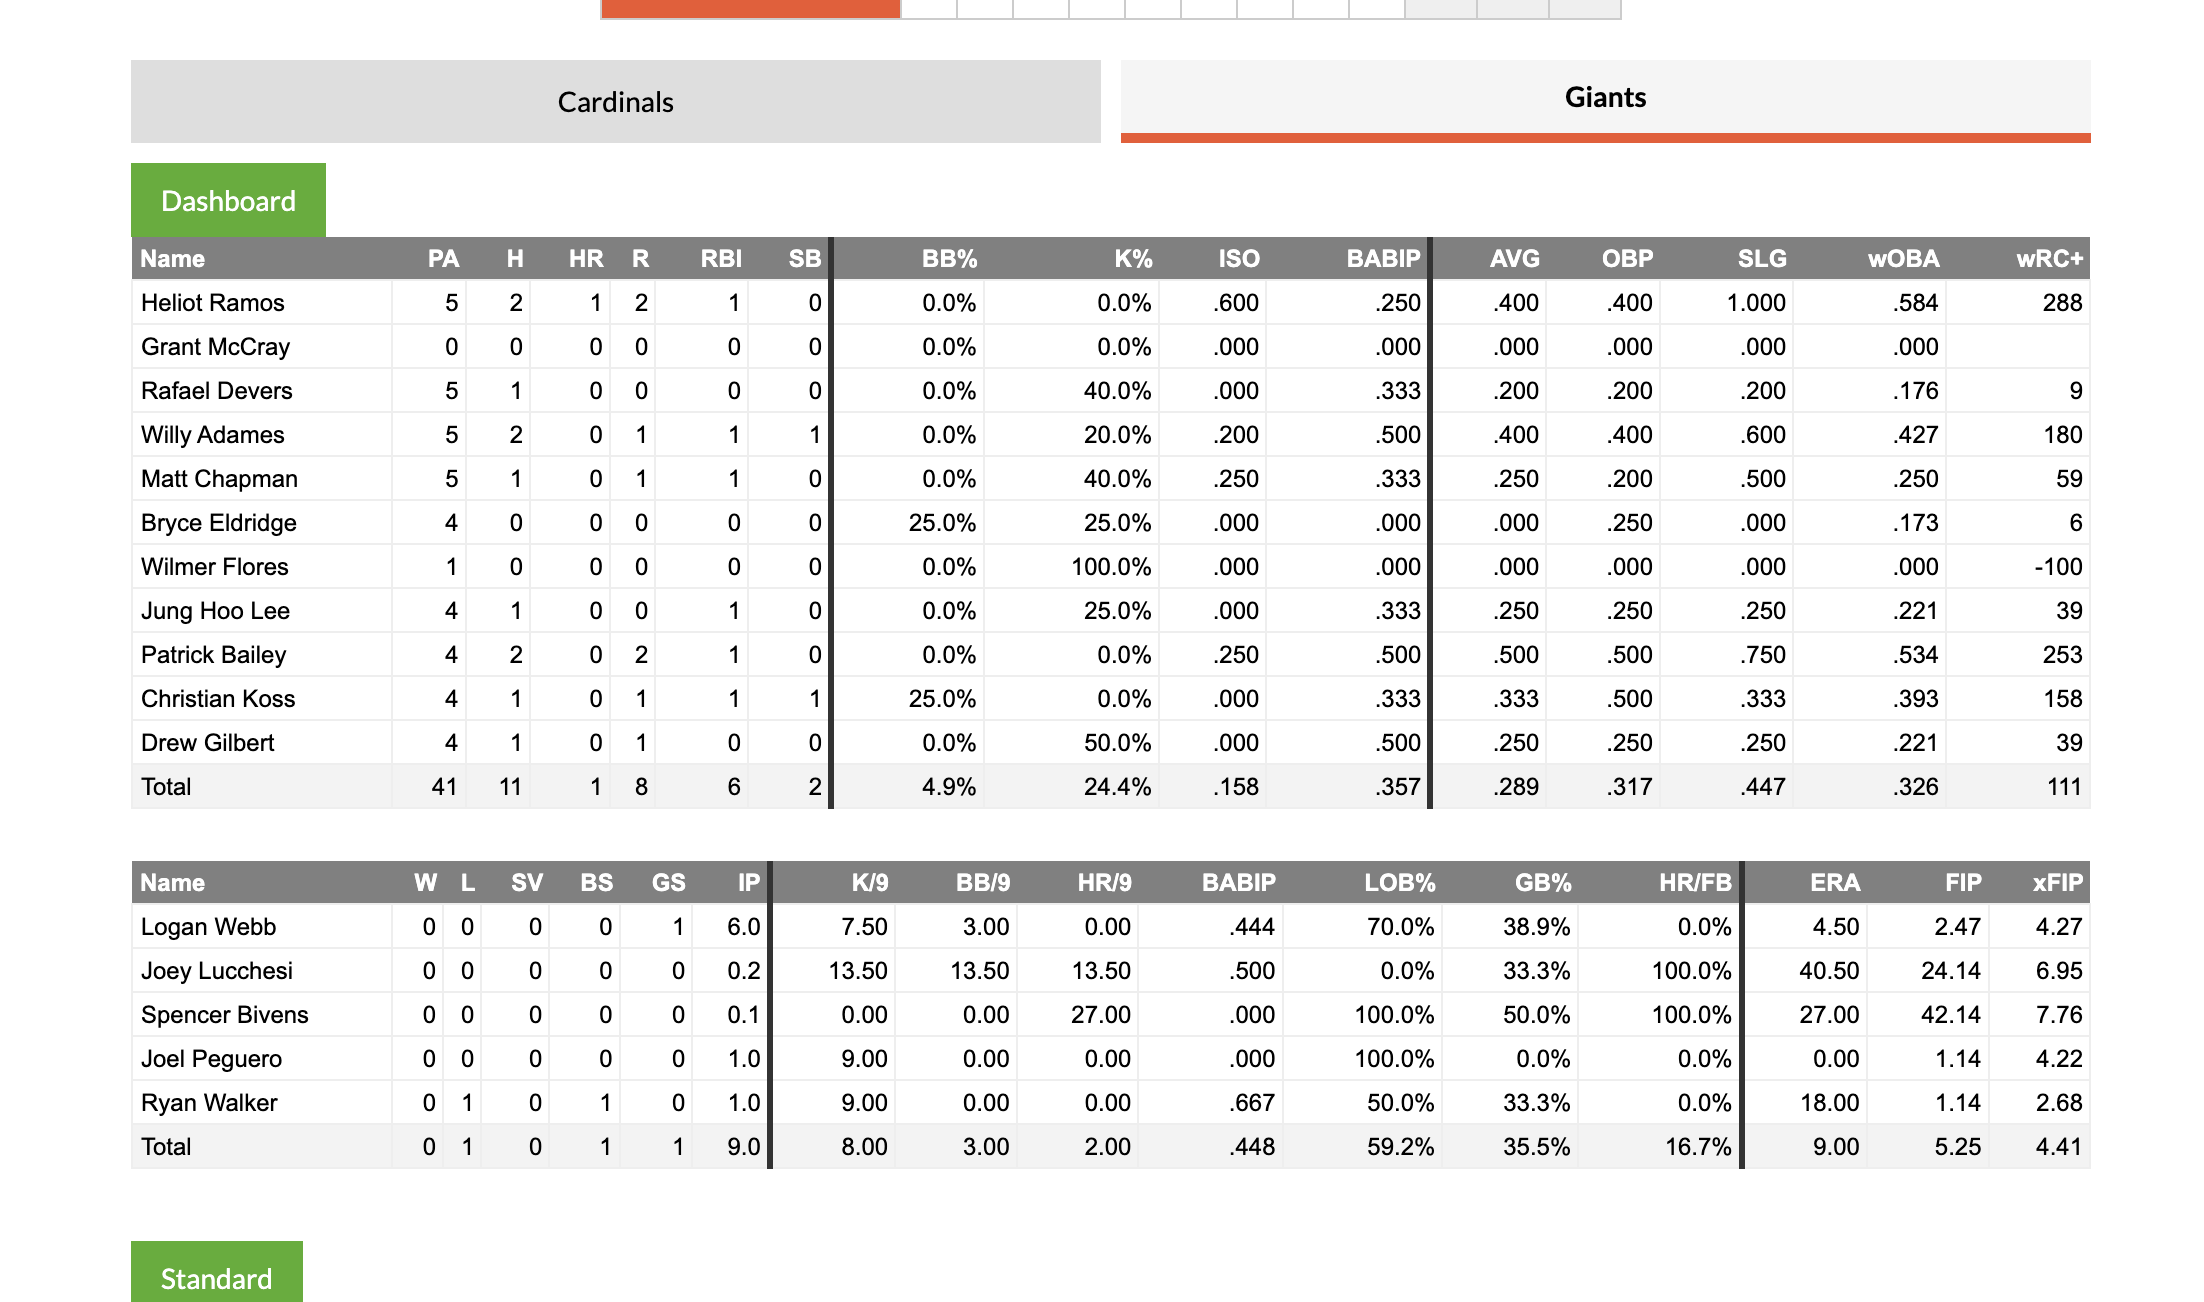
The individual full game stats lines have also been overhauled to look more like our current player page tables:
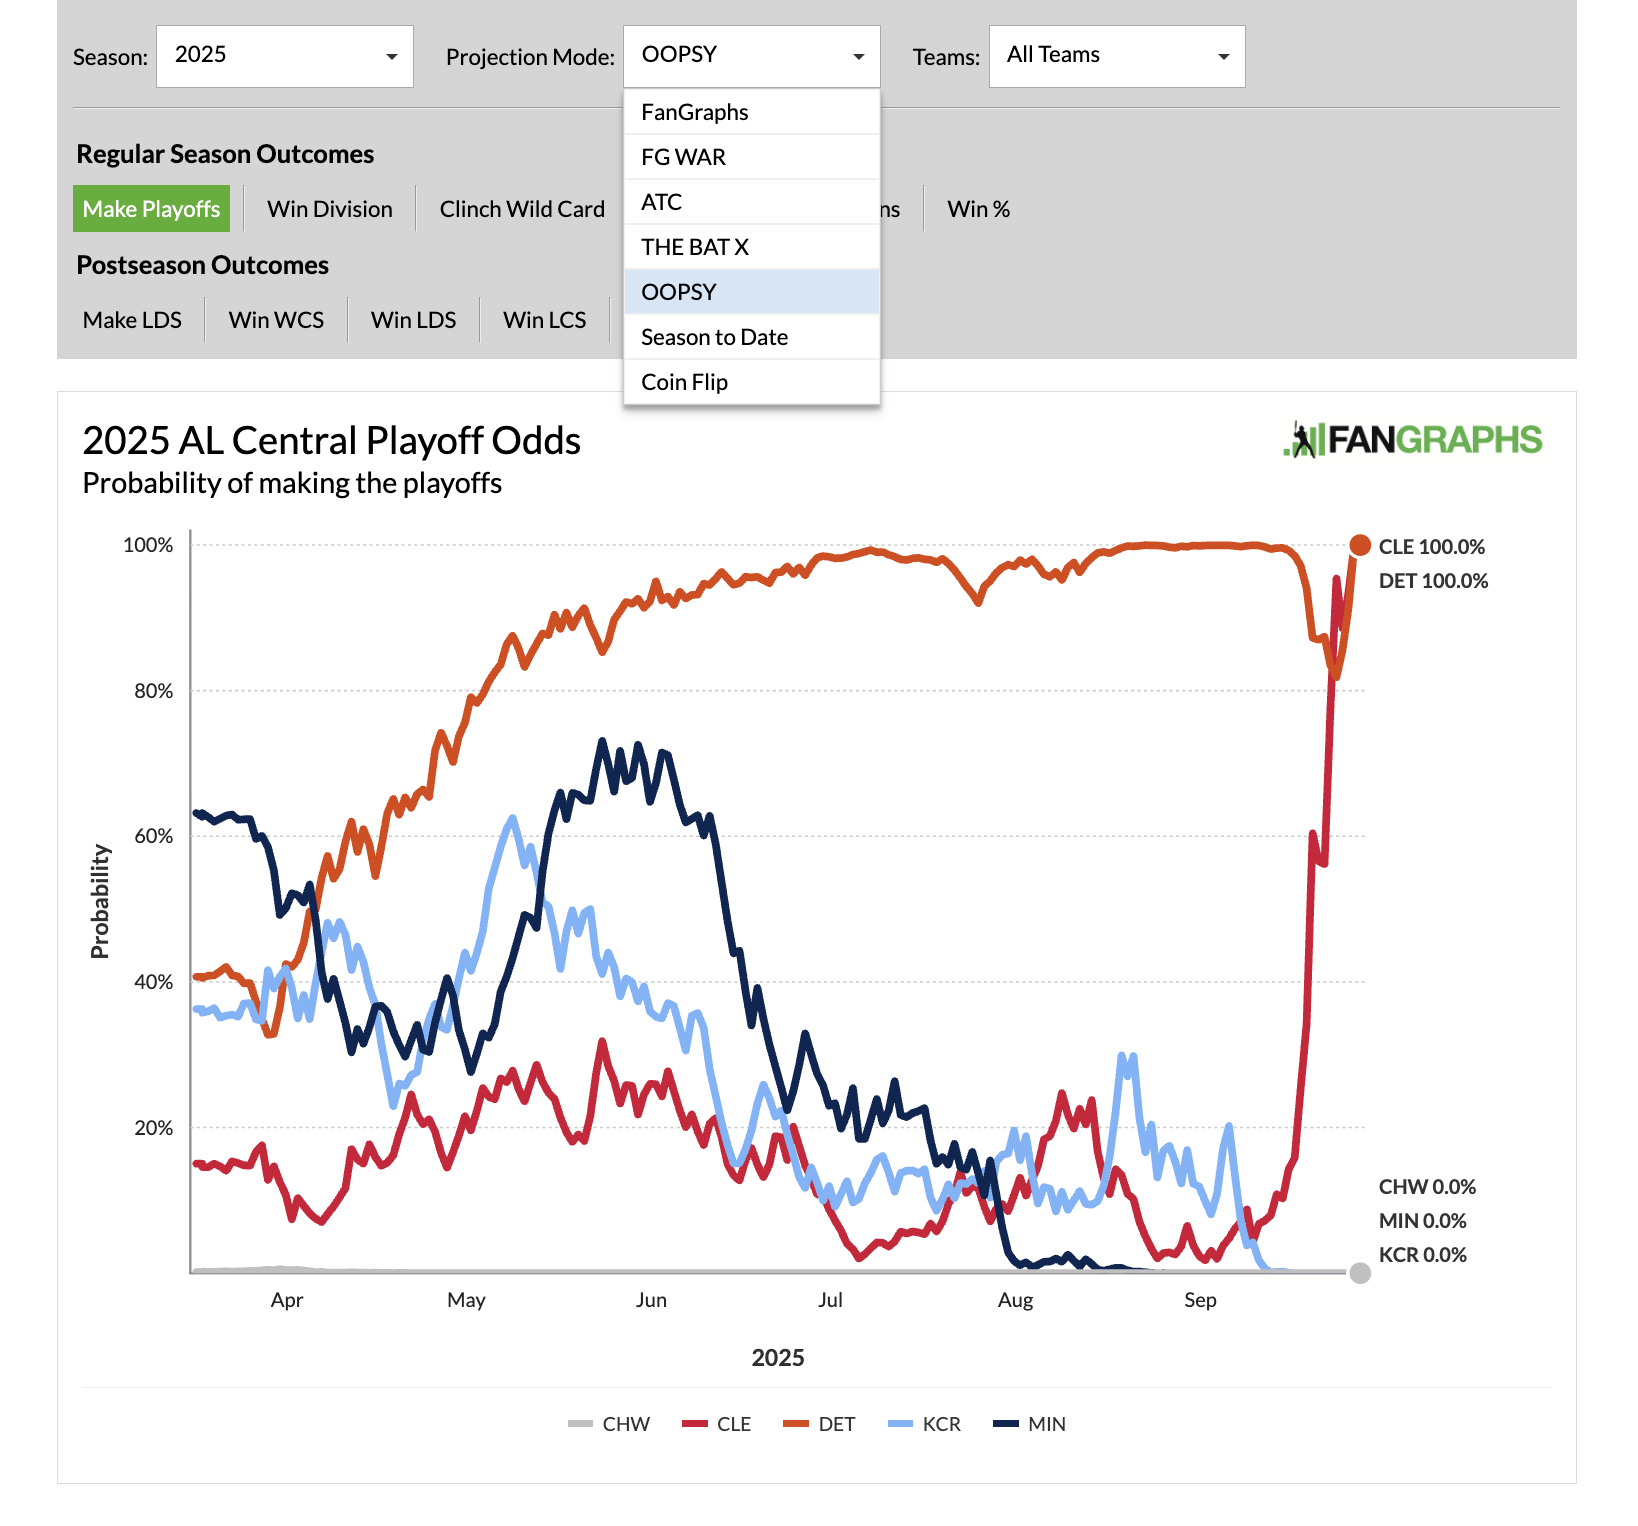
The Playoff Odds Graphs have been updated to include all of the available projection systems we run for the Playoff Odds:
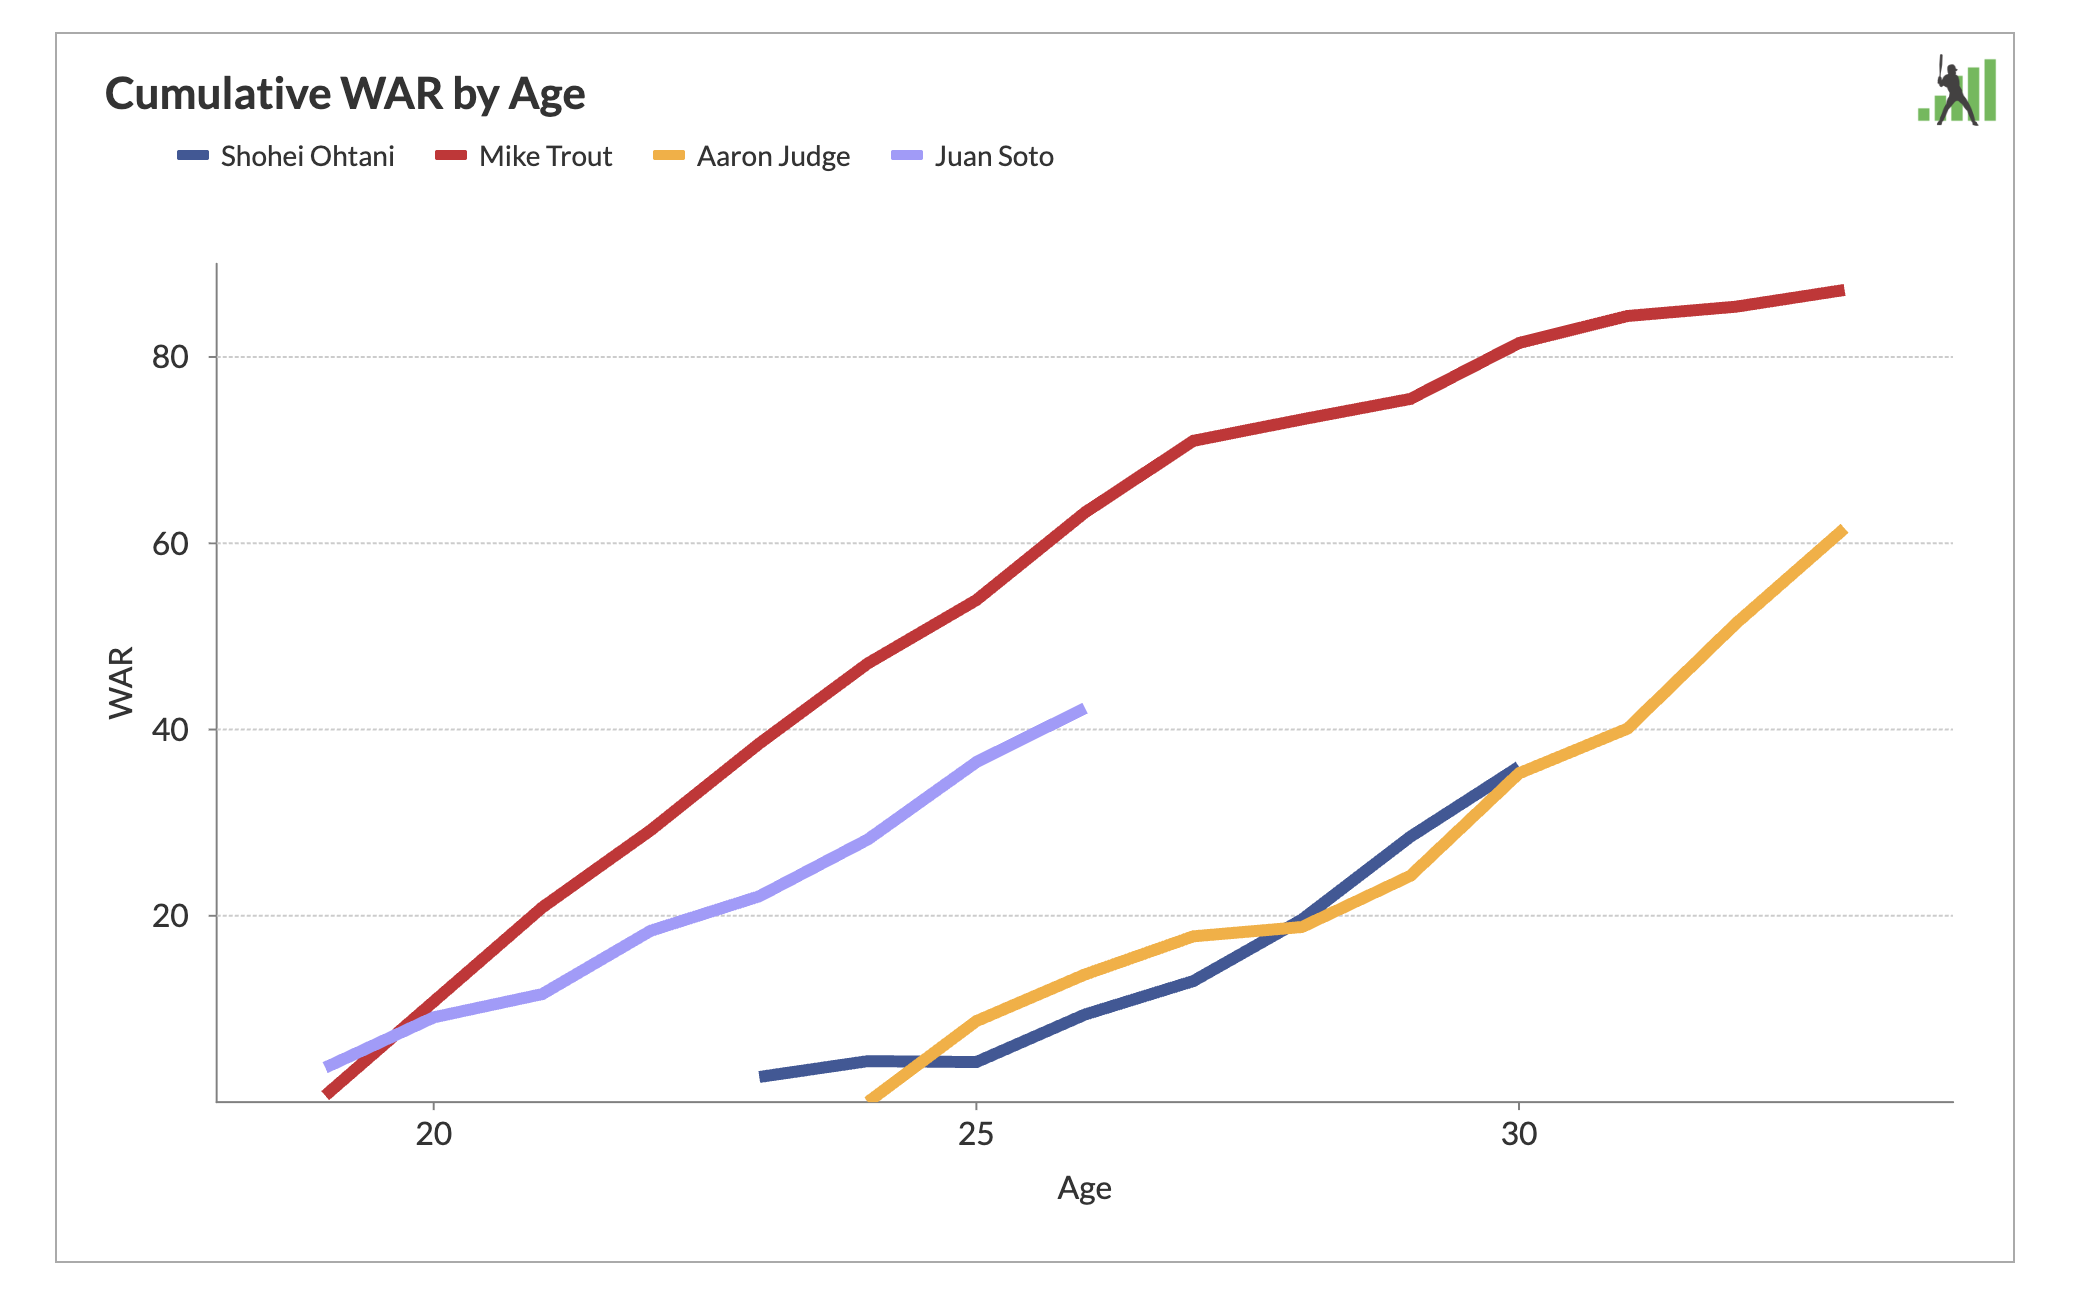
Speaking of graphs, our WAR Graphs tool, which allows you to compare players’ season and career WAR, has a new look:
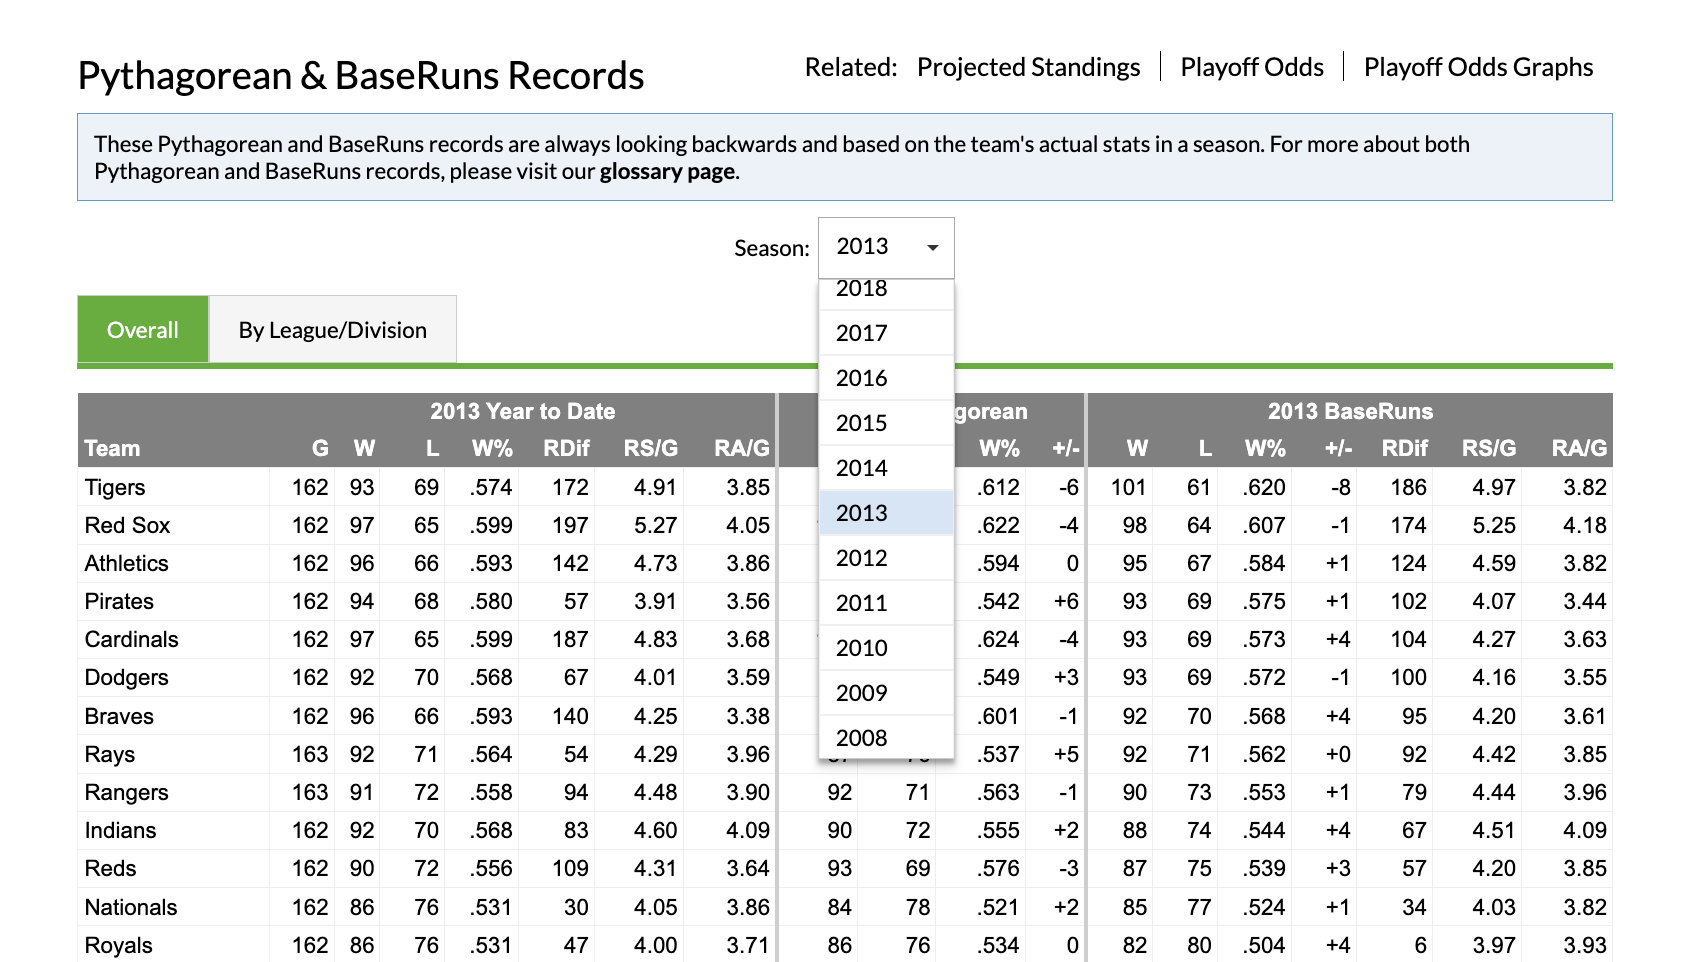
We added the ability to look at previous seasons of Pythagorean and BaseRun Records. Because of stat limitations through the years, we currently only have BaseRun records back to 2002. We also spiffed up the Projected Standings page, though those are still only available for the upcoming or current season:
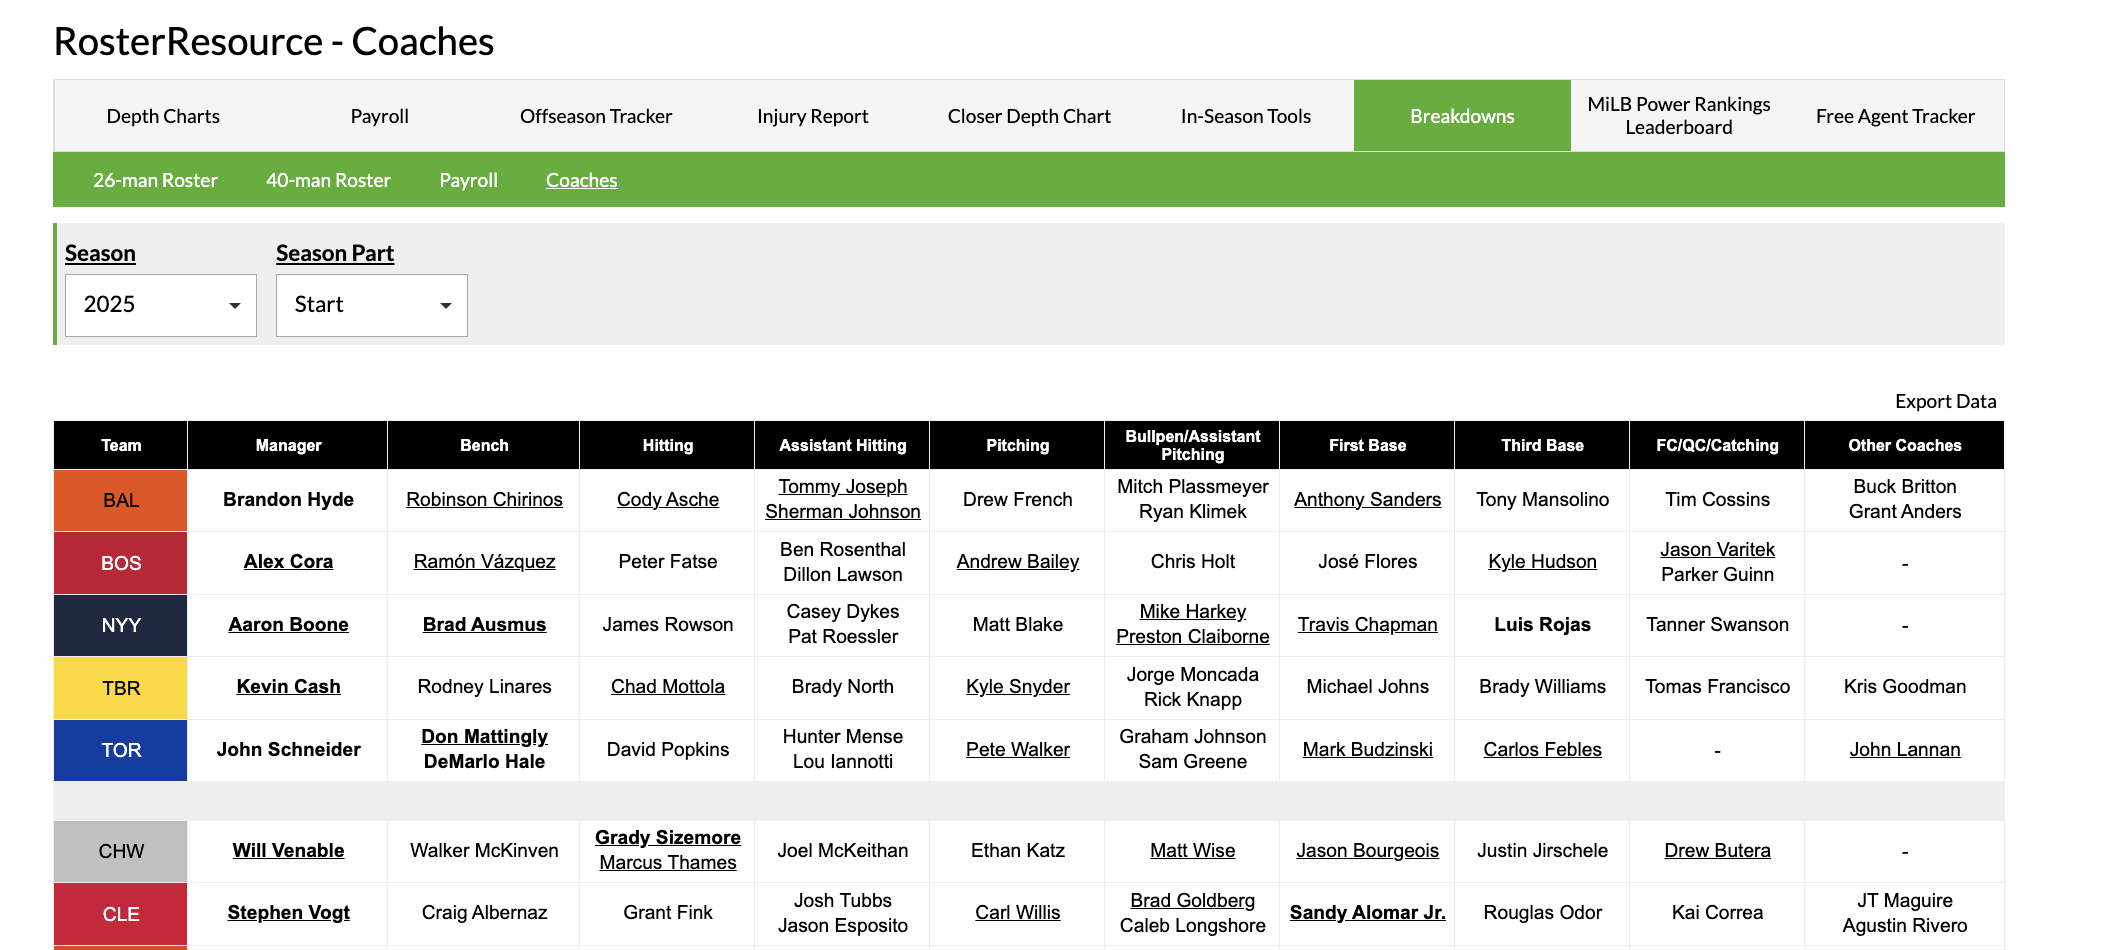
The RosterResource Coaches Breakdown has been updated to include information for 2025 and 2026:
You can filter players by their option status on the Opening Day Tracker, isolating those without minor league options remaining:
Flair
Ever since pitchers and catchers reported, we have given Members the option to have a Florida or Arizona banner at the top of their screen:
We have also given Members the option to hang the WBC Flags below the site’s header:
You can turn these features on and off using the User Menu in the top right corner with your user name in it.
Have questions? Leave them in the comments below, and if you have any suggestions for site features, be sure to let us know. And lastly, a thank you to our Members! Membership is the best way to ensure that we are able to continue to grow and improve the site, and support our staff. We couldn’t do it without you!
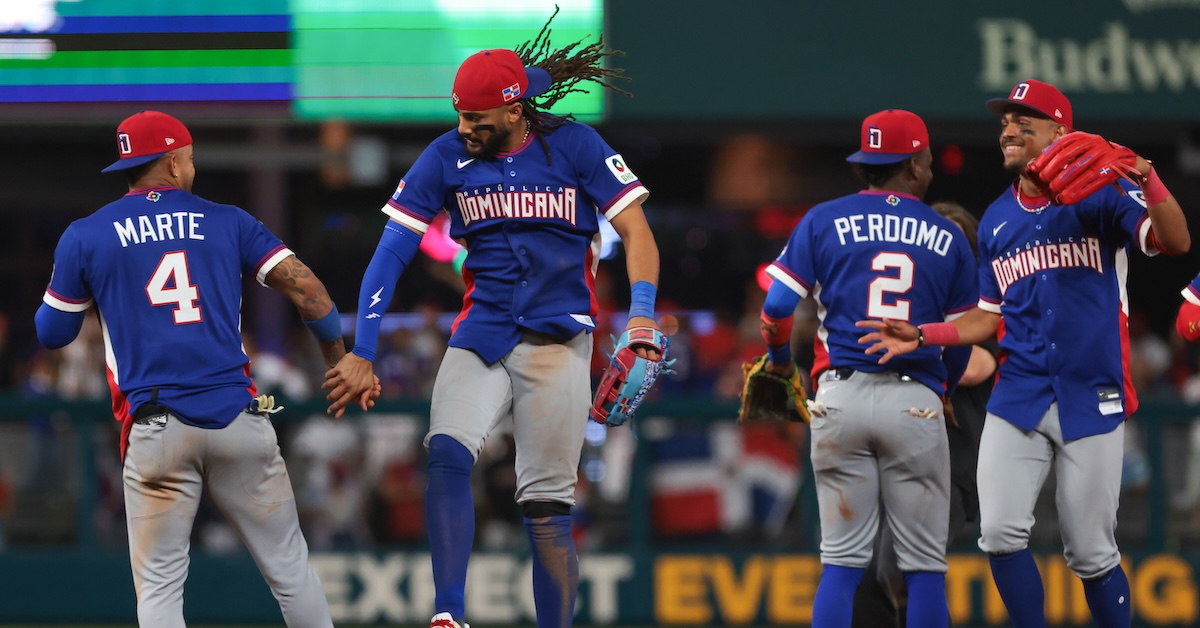
MIAMI — It was the most anticipated, cacophonous World Baseball Classic game of the week, a raucous rivalry featuring the national teams of two baseball-obsessed cultures playing in front of some of the loudest fanbases in professional sports. With air horns blaring, drums pounding, and more than 36,000 people shouting for the entirety of the game’s three-hour run time, the Dominican Republic outslugged and outlasted Venezuela, 7-5, on Wednesday night at loanDepot park.
All that for a game that didn’t matter much. Sure, the winner would finish first in Pool D and not have to face reigning WBC champion Japan in the quarterfinals, but South Korea is also a formidable foe. And yes, the winner would also have a better opportunity to secure one of the two spots in the 2028 Olympics reserved for non-United States teams from the Americas. But no matter the result of Wednesday night’s game, both teams would still have a chance to earn both the WBC title and an Olympic berth.
And yet, from another perspective, the game meant everything, because for the fans of these two countries, baseball means everything. Read the rest of this entry »