Archive for Daily Graphings

FanGraphs Feature Focus: RosterResource Coaches Table

The first feature I created as a FanGraphs developer, duties I added to my existing RosterResource work early last season, was the Coaches Table, which is located in the Breakdowns section of RosterResource. Since I haven’t done nearly a good enough job of publicizing its existence, I’ll atone by making it today’s Feature Focus.

Beyond the uniformed coaches that every team employs these days (manager, bench coach, often multiple hitting and pitching coaches, and base coaches), there are a couple of extra columns in the table that group coaches more broadly. The first is the “FC/QC/Catching” column. Many teams have a field coordinator (FC), quality control coach (QC), and/or catching coach, though not every team does, as some clubs prefer to spread those responsibilities around to existing coaches. The “Other Coaches” column covers every other uniformed coach who lacks a title that fits cleanly in one of the other columns. These are often coaches with generic titles like “Major League coach,” but not exclusively so. Miguel Cairo of the Orioles, for example, serves as the dedicated infield coach, a role usually taken by one of the base coaches in addition to his duties at first or third. Read the rest of this entry »


In Detroit, Every Hitter Is in a Pinch

Junfu Han-USA TODAY NETWORK via Imagn Images

A friend of mine is a Tigers fan, God help him. He’s upset about baseball quite a bit these days, and the other night he was miffed about something specific: With two outs in the ninth inning and the tying run coming to the plate, Detroit manager A.J. Hinch pinch-hit with Jake Rogers.

Whatever else the Tigers’ backup catcher has going for him, he’s not a very good hitter. He’s hitting .155/.239/.276 this season, with a 30.9% strikeout rate. (All stats in this article are current through Tuesday’s games.) That’s a wRC+ of 42. Rogers had about a season’s worth of pretty good offensive production spread from 2021 to 2023 — like, a good Mike Zunino season, with a low-.200s batting average, a bunch of home runs, and a strikeout rate in the 30s — but overall he’s a career .198/.268/.380 hitter. He hasn’t batted .200 in a season in three years.

Sure enough, Rogers struck out on four pitches to end the game.

So yeah, it’s jarring to see that guy not only at the plate with the game on the line, but to come off the bench with the game on the line. Hinch put Rogers there on purpose, which seems like the work of a madman.

Believe it or not, it was probably the right decision. Read the rest of this entry »


One Year Later, the Rafael Devers Blockbuster Doesn’t Look So Great

D. Ross Cameron-Imagn Images

Monday marked the one-year anniversary of the blockbuster trade that sent Rafael Devers from the Red Sox to the Giants in exchange for a four-player package. Neither team marked the occasion by throwing a party; mercifully, both were idle, and so didn’t sink further below .500. The deal hasn’t worked out well for either side, though it’s the Giants with an expensive and apparently declining slugger on the books. While Devers was fairly productive after being dealt last season, so far in 2026, the 29-year-old first baseman has surrounded one very good month (May) with a pair of miserable slumps that are just part of the reason the Giants are buried in the NL West standings.

We’ve told and re-told the story of the drama in Boston that led up to the Devers trade, but the streamlined version is that the signing of third baseman Alex Bregman bumped Devers off his natural position. After that, a lack of communication between the front office and the slugger — whose defense at the hot corner had eroded — exacerbated the team’s attempts to slot him first at designated hitter and then, after Triston Casas was injured, at first base, a position he had never played before and was reluctant to begin learning in-season. On June 15, 2025, the Red Sox sent Devers to the Giants for lefty Kyle Harrison, righties Jose Bello and Jordan Hicks, and outfielder James Tibbs III, with the Giants assuming the roughly $254 million remaining on Devers’ 10-year, $313.5 million contract, which runs though 2033.

The Red Sox were just 36-36 at the time of the trade, the Giants 41-30. Over the remainder of the season, the two teams’ fortunes reversed, with Boston going 53-37 and securing a Wild Card berth, just the team’s second trip to the postseason since winning the World Series in 2018, and San Francisco going 40-51 and missing the playoffs for the eighth time in nine seasons. Each team has changed managers since, with the Giants axing Bob Melvin in favor of Tony Vitello — the rare manager to make the jump directly from the college coaching ranks — last October and the Red Sox firing Alex Cora in late April. Those varying paths have led the two teams to similar spots: the Red Sox are 29-41, last in the AL East, while the Giants are 29-43, two games out of last place in the NL West. (Note that throughout this piece, stats from our site include those from Devers’ two plate appearances in Tuesday night’s suspended game against the Braves, while those from Baseball Savant do not.) Read the rest of this entry »


The Universe Wants Chandler Simpson To Stay on First Base

Pablo Robles-Imagn Images

Chandler Simpson is fast. Being fast is kind of his whole deal. As a minor leaguer in 2024, Simpson stole 104 bases in 110 games. As a rookie in 2025, he stole 44 bases in 109 games. Then he stole 14 in his first 40 games of this season. If you watched Monday night’s nationally televised game between the Rays and the Dodgers, none of this is news to you. Simpson entered as a pinch-runner during a pivotal moment, and his presence instantly altered the gravity of the entire broadcast. ESPN’s cameras never left him, the commentators never stopped talking about him, and the Dodgers were so preoccupied with him that they barely had any focus to spare for the batters who came to the plate while he was on base. But Simpson never stole a base, and that’s likely not news to you either.

Simpson’s last steal came on May 11. That’s 28 games and more than a month ago. Over that time he’s been thrown out four times. On June 4, Marc Topkin of the Tampa Bay Times wrote an excellent article breaking down the circumstances behind the drought. Topkin used his own observations alongside first-hand explanations from Simpson, teammate Cedric Mullins, manager Kevin Cash, and first base/baserunning/outfield coach Corey Dickerson. Topkin noted first that Simpson has had fewer opportunities because he’s slumping at the plate. Since May 20, he’s running a .227 on-base percentage, the fourth-lowest mark among qualified players. Next, Topkin pointed out that Simpson’s downturn has roughly coincided with a downturn in Tampa Bay’s fortunes. The Rays have fallen behind early in games, putting them in situations where it doesn’t make as much sense to risk outs on stolen base attempts. Simpson and the rest of the Rays, though, were less focused on the circumstances and more focused on the intent of the opposition.

“I think the reason he’s in that funk right now is that teams have made a really impressive adjustment against him,” manager Kevin Cash told Topkin. “Every team we see, they were mindful. Now, they’re that much more mindful. We’re seeing pitchers alter their deliveries.”

Asked what opponents are doing to keep him tethered to the base, Simpson answered, “Everything. They’ve been pulling everything out. Slide-step (deliveries), quicker moves, pitchouts, random perfect throws on the money.” Monday night’s game provided an excellent example. Read the rest of this entry »


We Should Account For Inherited Runners Better

Benny Sieu-Imagn Images

On April 21, Grant Anderson inherited a hot mess. With the Brewers ahead 3-0 in the fourth inning, starter Kyle Harrison lost his feel. He walked Riley Greene and Spencer Torkelson in two uncompetitive plate appearances, then gave up a rifled line drive on one of his slowest fastballs of the day, a center-cut cookie to Hao-Yu Lee. Pat Murphy called Anderson in from the bullpen to face the bases loaded with no one out.

Anderson delivered nearly flawlessly. He got Javier Báez to ground into a first-pitch double play, then struck out pinch-hitter Kerry Carpenter to escape the inning with only a single run allowed. That run, of course, went on Harrison’s ledger. Anderson got credit for a scoreless inning, no more or less.

On May 16, Chase Silseth tried to pull off the same trick. José Soriano fought through five strong innings against the Dodgers, but he didn’t have it in the sixth. After an inning-opening groundout, he walked four of the next five batters and hit the fifth, driving in two runs and leaving the bases loaded. Silseth came in to put out the fire – but he might as well have poured kerosene on it. He hit the first batter he faced, then gave up a two-run single immediately after, pushing the score to 6-0. He finally got the last two batters of the inning – which meant that in the game’s official log, he pitched two-thirds of an inning and didn’t allow a run.

These two pitching performances went quite differently. Anderson had a tougher task and performed better. But the two of them each got credit for a clean sheet. This is far from the only problem with the way we calculate ERA, but it’s one that stands out to anyone following. Anderson and Silseth didn’t deserve the same counting statistics there. Likewise, Soriano got tagged for three runs, while Harrison got tagged with only one. But that didn’t reflect what happened to them – both of them lost it and had to be removed from the game because of all the runners they’d allowed. Read the rest of this entry »


FanGraphs Feature Focus: WAR Graphs

Denny Medley-Imagn Images

Today’s Feature Focus covers WAR Graphs, a quite underutilized tool in my opinion. (We’re called FanGraphs after all, and this is a Graph that you can make, as a Fan.) The tool is accessed near the bottom of the Leaders menu, under WAR Tools:

That’ll send you to this landing page, a blank canvas for adding players:

After selecting players, you’ll be welcomed with three graphs: nth Best Season, Cumulative WAR by Age, and WAR by Age. The view defaults to showing all three, but you can toggle at the top:

Let’s dive into each graph. Read the rest of this entry »


Steve Sparks Tackles a Challenging Career Quiz

Milwaukee Journal Sentinel files-Imagn Content Services, LLC

Steve Sparks is a good storyteller, which serves him well in the broadcast booth. Now in his 14th season working alongside Robert Ford, Sparks forms one half of a Houston Astros radio team that ranks among the best in the business. He used to throw knuckleballs for a living. Pitching for five teams from 1995-2004, primarily the Detroit Tigers, the 61-year-old Tulsa, Oklahoma native took the mound 270 times to the tune of a 59-76 won-lost record and a 4.88 ERA. All told, he faced 626 different batters over 1,319 2/3 innings of work.

How well does he remember his more-notable matchups? Following in the footsteps of Geoff Blum, David Cone, Mark Grant, Mark Gubicza, Jeff Montgomery, and Dan Petry — links to those pieces can be found on their player pages — Sparks sat down for the seventh installment of our Challenging Career Quiz.

I began by asking which batter he faced the most times.

“It would probably have to be somebody in the American League Central,” replied Sparks, whom I spoke with at Fenway Park in early May. “I’ll say Frank Thomas.”

His guess was spot on. Sparks faced Thomas 60 times, with “The Big Hurt” going 13-for-49 with three home runs, nine walks, and a pair of plunkings. His memories of the Hall of Famer?

“I had the impression that he couldn’t reach the outside corner,” Sparks told me. “I felt like if I had to go somewhere, throwing a fastball or a cutter, I could go away to Frank Thomas. I found out very quickly that I was wrong. He was so far off the plate that I didn’t think he could reach it. But he could. Read the rest of this entry »

Is Andre Pallante Good? I Still Can’t Tell.

Gregory Fisher-Imagn Images

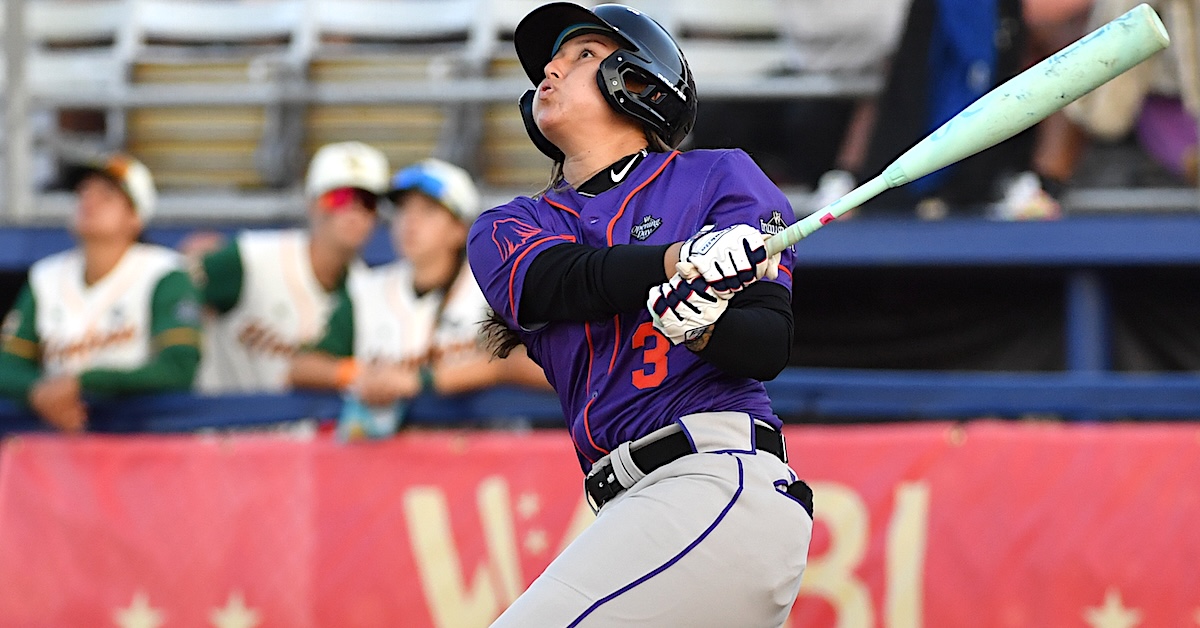
Andre Pallante starts for the Cardinals on Tuesday, and if he beats Michael King and the Padres, he’ll move into a tie for the National League lead in wins.

I know we’re not supposed to care about wins, but it gives me a chance to talk about a pitcher I’ve had a hard time understanding over his five seasons in St. Louis. I should be more specific, because Pallante’s game is pretty straightforward. That I understand just fine. I just can’t figure out if he’s any good or not. Read the rest of this entry »


The Dodgers Rotation Is Back on Top

Mark J. Rebilas-Imagn Images

Shohei Ohtani made his first start on the mound for the Dodgers one year ago today, following a nearly two-year recovery from Tommy John surgery. He threw 28 pitches, exited after the first inning as planned, and flashed great stuff, even if he looked occasionally frustrated with his command. He ramped up slowly from there, from one inning to two to three to eventually six by the fall. He stamped his health with a dominant, 10-strikeout performance in NLCS Game 4 to send the Dodgers to the World Series.

Ohtani has now made 25 starts (of some length) since his return. Not only has he excelled individually over the last year, but his renaissance has run parallel with that of the Dodgers rotation.

Let’s start there: The 2025 Dodgers weren’t a powerhouse. They were great, and I’m sure they’re content with their second consecutive World Series trophy. But they weren’t quite the behemoth we’d seen in the past. They didn’t lock up the NL West until game 159. They finished with their fewest wins since 2018 and “worst” pythag record since 2016. We can see their win rate over 162 games has steadily fallen from its peak of 118 wins in late 2022. Read the rest of this entry »


FanGraphs Power Rankings: June 8–14

We’re coming up on the halfway point of the season, and the playoff picture in both leagues is still as muddy as ever. That should make for an interesting trade deadline, with a bunch of teams seemingly on the cusp of making a run and only a few true sellers.

Our power rankings use a modified Elo rating system. If you’re familiar with chess rankings, you’ll know that Elo is an elegant ranking format that measures teams’ relative strength and is very reactive to recent performance. To avoid overweighting recent results during the season, we weigh each team’s raw Elo rank using our coin flip playoff odds. (Specifically, we regress the playoff odds by 50% and weigh those against the raw Elo ranking, increasing in weight as the season progresses to a maximum of 25%.) The weighted Elo ranks are then displayed as “Power Score” in the tables below. As the best and worst teams sort themselves out between now and October, they’ll filter to the top and bottom of the rankings, while the exercise remains reactive to hot streaks and cold snaps. If you’re looking for a visual representation of the ups and downs of your team throughout the season, look no further than the brand new Power Rankings Board in the FanGraphs Lab.

First up are the full rankings, presented in a sortable table. Below that, I’ve grouped the teams into tiers with comments on a handful of clubs. You’ll notice that the official ordinal rankings don’t always match the tiers — there are times where I take editorial liberties when grouping teams together — but generally, the ordering is consistent. One thing to note: The playoff odds listed in the tables below are our standard Depth Charts odds, not the coin flip odds that are used in the ranking formula. Read the rest of this entry »
