Jordan Wicks is one of the most promising young pitchers in the Chicago Cubs organization. Drafted 21st overall in 2021 by the North Side club out of Kansas State University, the 24-year-old southpaw is coming off of a season that saw him win four of five decisions and log a 4.41 ERA over his first seven big league starts. Moreover, his minor-league ledger included a 7-0 record and a 3.55 ERA between Double-A Tennessee and Triple-A Iowa. Assigned a 50 FV by our own Eric Longenhagen, Wicks is projected to slot comfortably into new Chicago manager Craig Counsell’s rotation in the coming campaign.
The big lefty — he’s listed at 6-foot-3, 220-pounds — has a diverse arsenal, but one offering stands out above the rest. His changeup, which he began throwing as a Little Leaguer in Conway, Arkansas, is not only the best in the system, it could prove to be one of the best in the National League. As he explained at the tail end of last season, the pitch is his “bread-and-butter, and it has been for awhile.”
Asked for more history on his go-to, Wicks told me that it was his “premium off-speed” growing up, and that he “didn’t really throw a curveball or a slider when [he] was younger.” His repertoire now includes both, as well as a cutter and both two- and four-seam fastballs. Pitchability is another of his assets, and he gets high marks for his competitiveness, but again, it’s the diving circle that earned him his first-round pedigree and has him poised to contribute to a big-league rotation. Read the rest of this entry »
Ray Acevedo-USA TODAY Sports
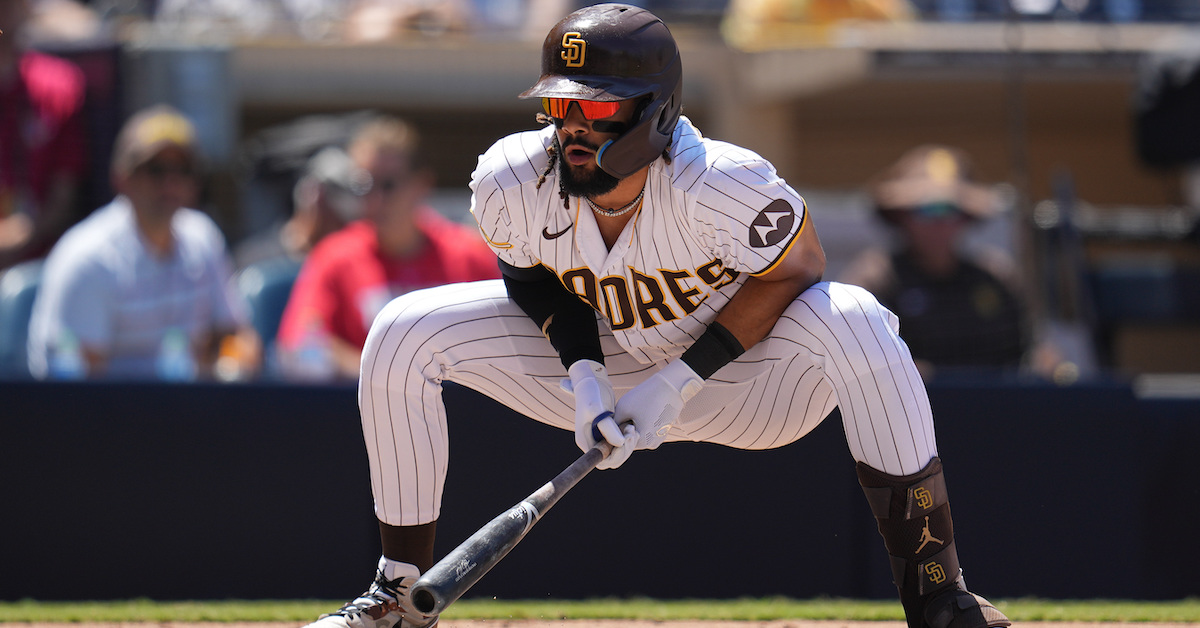
It is not easy to skip a whole year of something and come back with the same level of performance or skill. Baseball is no different, even for the best of ballplayers. Fernando Tatis Jr. missed the entire 2022 season because of wrist injuries and a suspension for using performance enhancing drugs. While he was serving his suspension, he underwent labrum surgery to repair a recurring issue that hampered his ability to consistently stay on the field. He was fully healthy upon his return in 2023, and he remained that way for the entire season.
Yet, despite avoiding injury for the first full season of his career, in 2023 Tatis had his least productive year at the plate. His 113 wRC+ was 41 points below the mark he had recorded over his first three big league seasons. He also set career lows in average (.257), on-base percentage (.322), slugging (.449), ISO (.191) and wOBA (.332). From a data perspective, his quality of contact took a significant hit, though that isn’t all that surprising. Even after athletes return to the field, it takes time for them to regain their explosiveness following serious injuries and surgeries. Ronald Acuña Jr. is a perfect example of that. He tore his ACL in July 2021, underwent season-ending surgery, and missed Atlanta’s first 19 games of 2022. Like Tatis last year, Acuña was mostly healthy for the rest of the season but did not perform up to his standards. Then, of course, last year he won the NL MVP and became the first player ever to hit 40 home runs and steal 70 bases in a season.
Tatis will look to take a similar path, but in order to do so, he’ll have to figure out and address the root causes (mechanics, swing decisions, etc.) of this big drop off. Back in September, Ben Clemens investigated how spray angle on fly balls impacts some of the hardest hitters in the game, Tatis being one of them. One of the key conclusions of Ben’s research is that hitters who pull their fly balls at an extreme rate, such as Isaac Paredes, don’t do more with those batted balls; they just hit them much more frequently, which allows them to outproduce others on fly balls, despite not having the eye-popping power that we’d assume would be the main causal variable.
This is notable for Tatis because, over his first three seasons, he hit the ball with enough power to do damage on fly balls no matter the spray angle. That was not the case last year.
Tatis Fly Ball Performance
Years
Fly Ball%
Fly Balls
wOBA
xwOBA
wOBA-xwOBA
2019-2021
27.4
197
.847
.834
.013
2023
25.1
110
.456
.626
-.170
SOURCE: Baseball Savant
From 2019 through 2021, Tatis’ wOBA on fly balls slightly outpaced his xwOBA, while last year, he greatly underperformed his expected numbers. Much of that can be explained by his pull rate dropping from 30.5% over his first three seasons to 21.8% in 2023. However, that’s not the only variable at play here, because even when he hit straightaway fly balls in those first three years, he had a .764 wOBA. That’s well below his .894 xwOBA, but it was still the third-highest mark among all batters from 2019–21 (min. 150 fly balls). Last season, though, Tatis finished with a .291 wOBA on straightaway fly balls, significantly lower than his .653 xwOBA. Crushing balls to the deepest parts of the park was once a Tatis superpower; in 2023, it was his kryptonite.
To better understand how this happened, let’s look at how Tatis fared in different areas of the strike zone. By breaking down his performance in different zones, we’ll get a better idea of any holes that may have developed in his swing. For all his woes last year, Tatis continued to rake against left-handed pitching (152 wRC+), so I’m going to focus on his splits vs. righties, against whom he had a career low 101 wRC+. The table below shows how Tatis performed against pitches from righties in each third of the zone, first in 2021 and then in 2023.
Zone wOBA/xwOBA vs. RHP
Year
Inner Third
Middle Third
Outer Third
2021
.423/.450
.464/.533
.500/.473
2023
.307/.332
.427/.466
.252/.352
There are drops across the board here, but my goodness, what the heck happened on the outer third? In 2021, Tatis ranked second in right-on-right wOBA on outer third pitches. This year, if you were a righty who could locate on the outer third, Tatis would do the work for you.
What’s the deal? Making contact wasn’t the problem, because he actually whiffed less often against the outer third last year than he did in 2021. The real issue was his quality of contact. On his 67 batted balls against pitches from righties on the outer third in 2021, his xwOBACON was .634. In 2023, it was .305. Ooof.
A change in swing path is typically to blame when a player goes from destroying the outer third to hardly covering it at all. Let’s look at the video to figure out what mechanical flaws altered his swing path. Here are some swings from 2021 against outer third pitches from righties.
Here is a standard heater away with a pretty neutral body angle (sorry Keegan Thompson):
This one is a low and away breaking ball with a pretty aggressive body adjustment to get the barrel under the ball:
And lastly, here is a high heater that needed an upright body adjustment:
Each of these three swings shows how Tatis adjusted his body in different ways to get to his barrel to outer third pitches. The swings are reciprocal, athletic, and vicious. His stability with the ground is consistent no matter the posture of his upper body. Now let’s look at three swings on similar pitches from 2023, starting with another standard middle-away heater:
Here is a swing on a low breaking ball with a body adjustment where Tatis couldn’t quite create the same angle as he did in 2021:
Then here is a can of corn fly ball to center on an up and away heater where Tatis caught it off the end of the barrel:
OK, now for some comparison. Off the rip, it’s clear that Tatis’ stride is working in a different direction. It’s more neutral now than it used to be. Instead of working from a neutral stance into a closed stride, he’s working from an open stance into a neutral stride. The starkest comparison is looking at how he handled Thompson’s heater in 2021 versus the 2023 one we saw from Cristian Javier. Against Javier, it was the exact kind of pitch you’d expect Tatis to drill into the opposite field gap, but his legs didn’t create enough space for him to get his barrel moving in the optimal direction. Instead of a laser opposite field homer, it was a measly liner to left for an easy out.
In 2021, Tatis had a more stable base, which allowed him to create a more drastic angle with his upper body against the low breaking ball. That made the difference between his line drive in the gap from 2021 and last year’s line drive to the shortstop. On both of the high pitches, he had the tall posture he needed to get on plane, but in 2023, he couldn’t get his bat on the proper horizontal angle to make flush contact, causing him to hit the ball off the end of the bat instead of the barrel.
As I always say, we’re looking for reciprocal movements. If he’s still kicking back aggressively but doesn’t have the movement beforehand to make the kick back smooth, then he’s creating asymmetrical movements. The closed stride and smooth kick back was his recipe for success in 2021. The logic here is that when he strides closed, he has a more stable connection to the ground, leading to better positions to get his barrel on plane.
He did not do that last year, and as a result, he created less space for his upper body to cover the outer third effectively, which sapped his production on fly balls. Because he was coming back from surgery, it’s possible that he wasn’t comfortable making the same movements he had in the past, though it’s hard to believe that would be the only reason for losing his mechanics. After all, his surgery was on his shoulder, and this is a lower body problem. That said, even if he knew what was wrong, his shoulder could have limited the amount of extra swings he could take to fix it during the season.
Now that he is healthy, he should be able to do the drills and cage work necessary to correct his mechanics and return to his previous rotational patterns.
For over a century, baseball and the Summer Olympics have made for an uneasy mix at best. Dating back to the days when the Olympics was purely for amateur athletes, the sport has only sporadically been part of the slate, usually as an exhibition or demonstration. Major League Baseball’s refusal to release its players to participate — thereby disrupting its own schedule — led the International Olympic Committee to drop it in 2005, a slight that gave rise to the World Baseball Classic as an alternative. Now a group has begun a push to convince MLB owners to allow big leaguers to participate in the 2028 Summer Olympics in Los Angeles, but to these eyes, it feels rather underwhelming in the shadow of the WBC’s success.
Via The Athletic’s Evan Drellich, at this week’s owners meetings in Orlando, Florida, Casey Wasserman presented a proposal for how such participation could work. Wasserman has feet in both worlds, serving as the CEO of the Wasserman Agency, which represents many of the game’s highest-paid stars, and also as the president of the Los Angeles Olympic Organizing Committee, which was successful in landing the 2028 Games for L.A. According to Drellich, he offered a blueprint for a six-to-eight team tournament that could be played on a condensed schedule of less than a week, one that wouldn’t be much more disruptive than the annual All-Star break.
In fact the timing of the 2028 games — from July 14–30 — is close enough to the usual All-Star break that it could supplant that year’s Midsummer Classic, according to Drellich. By comparison, the last five Summer Olympics have all either crossed into or taken place entirely in August. While that wasn’t the reason MLB didn’t let its players participate, it would have required a second break in the season, one happening just as the races for playoff spots heated up, and sometimes past the trade deadline, making it harder to replace a player lost to injury in the tournament. Read the rest of this entry »
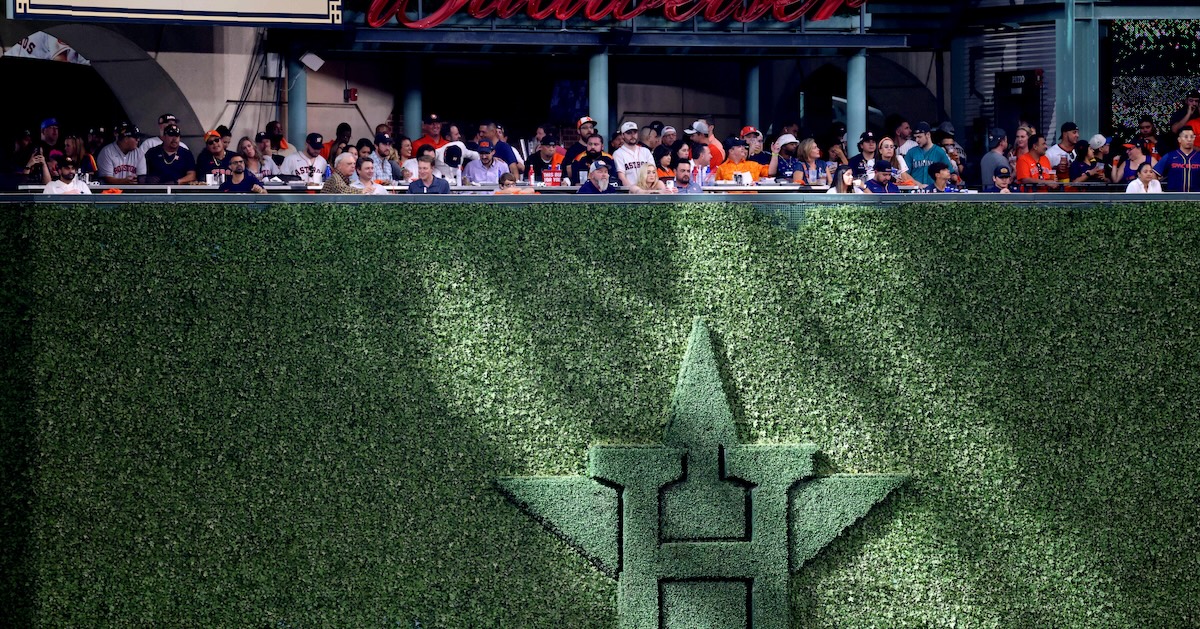
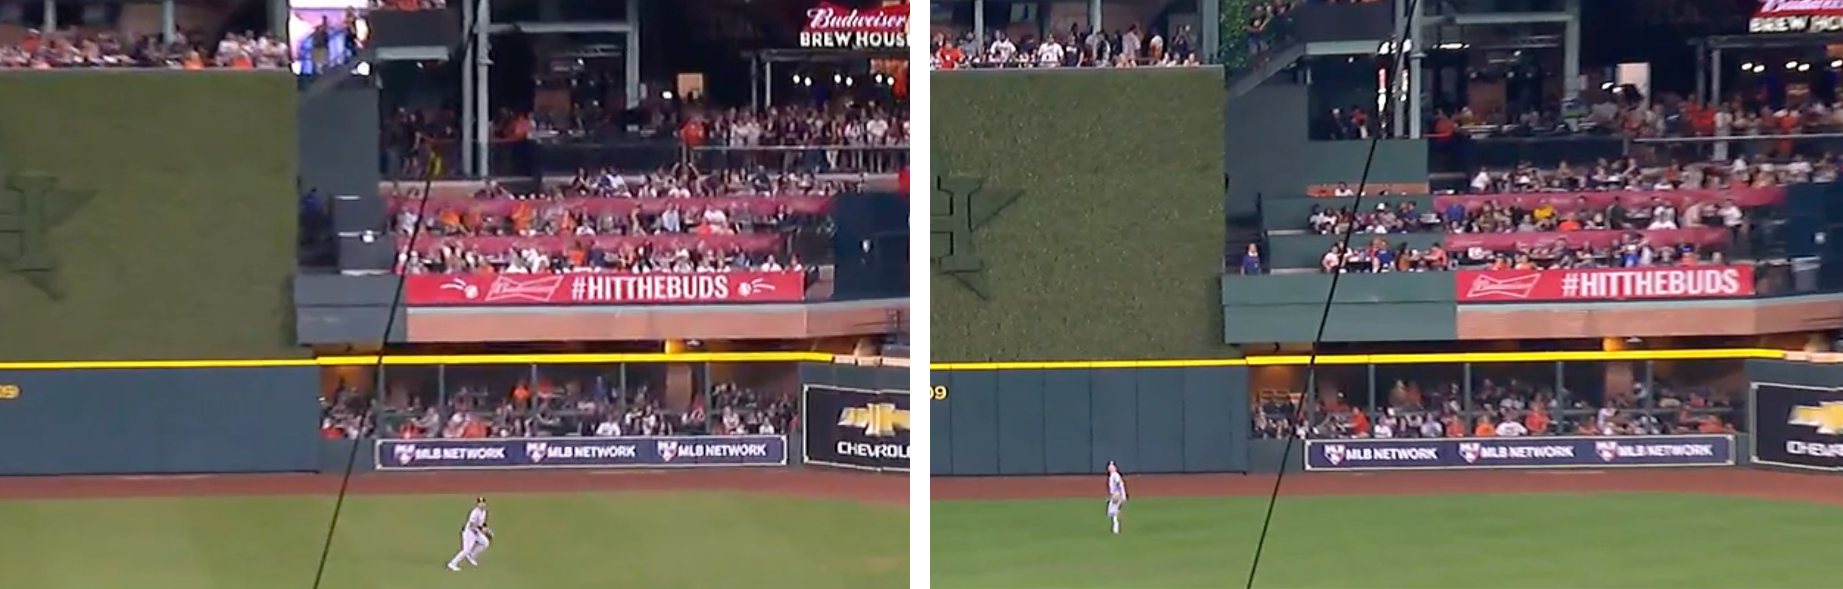
For a while now, I’ve been having fun analyzing how accurate umpires are when calling balls and strikes according to the Statcast strike zone. Honestly, I might be having toomuchfun. It’s just that there are so many variables that might affect the way the umpire sees a pitch. Today we’re looking into the most literal one: the ballpark. Every stadium is different, and that can affect how easy it is to track the baseball. This is a well-established issue, which is why every ballpark has a batter’s eye, a dark background that’s supposed to ensure that the batter is able to see the ball out of the pitcher’s hand. Those backdrops vary quite a bit, from evergreen trees and ivy in Colorado, to a painted wall in Texas, to tinted glass in the Bronx.
When Drew Smylynearly threw a perfect game last April, it helped that it was a day game at Wrigley Field, and his left-handed release point was so wide that the ball appeared to be coming not from the batters eye, but from the bleachers in right-center. Last September, in response to multiple public complaints from players, the Astros effectively extended Minute Maid Park’s batter’s eye several feet farther into right field, awkwardly repainting part of a formerly red section of brick and signage green. “It’s like night and day,” one player told The Athletic after the paint job:
Jeff Curry-USA TODAY Sports
With the Dodgers reporting for pitchers and catchers today, this week seems like a good time to run ZiPS projections for all 30 teams. I covered the American League projections yesterday, so today is all about the National League. Let’s be clear up front: These are not the final preseason projections, but they’re the best expression of how ZiPS sees the NL right now. After all, several marquee free agents remain unsigned and rosters will surely change between now and the start of the 2024 season.
These standings are the result of a million simulations, not results obtained from binomial, or more competently, beta-binomial magic. The methodology isn’t identical to the one we use for our playoff odds, which were released Wednesday, meaning there naturally will be some notable differences in the results.
So how does ZiPS calculate the season? Stored within ZiPS are the first- through 99th-percentile projections for each player. I start by making a generalized depth chart, using our Depth Charts as a jumping off point. Since these are my curated projections, I make changes based on my personal feelings about who will receive playing time as filtered through arbitrary whimsy my logic and reasoning. ZiPS then generates a million versions of each team in Monte Carlo fashion (the computational algorithms, that is — though it would be fun to don a tuxedo and play chemin de fer like James Bond).
After that is done, ZiPS applies another set of algorithms with a generalized distribution of injury risk that changes the baseline plate appearances or innings pitched for each player. ZiPS then automatically and proportionally “fills in” playing time from the next players on the list to get to a full slate of PAs and innings.
The result is a million different rosters for each team and an associated winning percentage for each million of them. After applying the new strength of schedule calculations based on the other 29 teams, I end up with the standings for each of the million seasons. I promise, this is much less complex than it sounds.
The goal of ZiPS is to be less awful than any other way of predicting the future. The future is tantalizingly close but beyond our ken, and if anyone figures out how to deflect the astrophysicist Arthur Eddington’s arrow of time, it’s probably not going to be in the form of baseball projections. So we project probabilities, not certainties.
Over the last decade, ZiPS has averaged 19.6 correct teams when looking at Vegas preseason over/under lines. I’m always tinkering with methodology, but most of the low-hanging fruit in predicting how teams will perform has already been harvested. ZiPS’ misses for teams from year to year are uncorrelated, with an r-squared of one year’s miss to the next of 0.000562. In other words, none of the year-to-year misses for individual franchises has told us anything about future misses for those franchises.
2024 ZiPS Projected Median Standings – National League East
Team
W
L
GB
Pct
Div%
WC%
Playoff%
WS Win%
Atlanta Braves
95
67
—
.586
71.3%
21.4%
92.7%
17.4%
Philadelphia Phillies
85
77
10
.525
13.9%
41.2%
55.0%
3.6%
New York Mets
83
79
12
.512
8.9%
34.4%
43.3%
2.3%
Miami Marlins
81
81
14
.500
5.9%
28.4%
34.3%
1.5%
Washington Nationals
66
96
29
.407
0.0%
0.8%
0.9%
0.0%
That ZiPS likes the Atlanta Braves can hardly be considered a surprise considering they won 104 games last year, all projection systems everywhere love them, and I’ve been warning non-Braves fans that this would be the likely result all winter. What else is there to say? They’re a great team and there’s no scary number two in the division.
The Phillies project just slightly worse than last year, partially due to some aging risk in their prime offensive players, but more likely than not — really, unless they lose either Zack Wheeler or Aaron Nola to injury — they are going to be a playoff team. Catching the Braves isn’t a futile gesture — we’re talking a roughly one-in-seven chance — but they’ll need some help from Atlanta to win the division.
ZiPS doesn’t think the Mets did enough to patch up their rotation, but if their starting pitchers are better than expected, they should contend for a wild card. The Marlins project a little worse than New York, but they have a high variance in their projected outcomes; their pitching is elite, and that could be enough to make a pretty lousy offense almost unimportant — as was the case last year when they snagged a wild card berth.
Last year, the Nationals remained within bullhorn distance of .500 for much of the late summer, but they aren’t good enough to take a big step forward in 2024. Washington has the worst ZiPS projection for any National League team.
2024 ZiPS Projected Median Standings – National League Central
Team
W
L
GB
Pct
Div%
WC%
Playoff%
WS Win%
St. Louis Cardinals
83
79
—
.512
33.2%
15.7%
48.9%
2.9%
Chicago Cubs
81
81
2
.500
23.5%
15.2%
38.6%
1.9%
Milwaukee Brewers
80
82
3
.494
20.5%
14.3%
34.8%
1.5%
Cincinnati Reds
79
83
4
.488
16.0%
12.7%
28.8%
1.1%
Pittsburgh Pirates
75
87
8
.463
6.8%
7.1%
13.9%
0.3%
While it may seem like a relief that ZiPS is hedging enough here that I won’t get blamed too badly, no matter what happens, I also won’t get much credit! Fans have a tendency to overrate teams when things are going well and underrate teams when they’re not, and I think the Cardinals are a good example of this. The additions outside of Sonny Gray don’t send a tingle down your spine, but they did successfully patch up the rotation, which was a gaping wound for most of last season. Paul Goldschmidt, 36, and Nolan Arenado, who turns 33 in April, might not be as good as they once were, but if they age gradually instead of all at once, St. Louis should have the necessary depth in its lineup to score enough runs to compete in such a weak division. ZiPS isn’t alone here.
Shota Imanaga is my favorite signing this winter, but the Cubs are probably still one more starting pitcher away from being the favorite in this division. I’d certainly like more ambitious solutions at first base or catcher. In recent weeks, the Brewers patched some of their roster holes, signing first baseman Rhys Hoskins, starting pitcher Jakob Junis, and backup catcher and DH Gary Sánchez, but they also opened up a larger, newer one when they traded ace right-hander Corbin Burnes for infield prospect Joey Ortiz and left-hander DL Hall. Ortiz should get the chance to play every day, and Hall could be the latest dominant arm fermented by Milwaukee’s reliever brewery, but the Brewers will feel the absence of Burnes in 2024.
There’s a lot to like about the Reds’ future, but they haven’t done much this offseason to address their shortcomings. They have a logjam of guys who get a lot of their value playing third base, but instead of using some of those players as trade pieces to upgrade elsewhere, the Reds are going to shove them all into the lineup at various other positions, such as first base, DH and corner outfield. That isn’t a particularly lucrative plan. Cincinnati’s starting pitching could be very good, but there is a quite a bit of variance with this group due to consistency and/or injury concerns. A few bad “rolls” here and the rotation could become awful quickly.
The Pirates aren’t a depressing team and have some interesting players to watch, like shortstop Oneil Cruz, outfielder Bryan Reynolds, and third baseman Ke’Bryan Hayes. But they do have some holes to fill at other positions, and their starting pitching staff probably peaks at OK. ZiPS is a bigger fan of their bullpen.
2024 ZiPS Projected Median Standings – National League West
Team
W
L
GB
Pct
Div%
WC%
Playoff%
WS Win%
Los Angeles Dodgers
93
69
—
.574
66.2%
21.8%
88.1%
13.9%
Arizona Diamondbacks
84
78
9
.519
16.6%
34.8%
51.4%
3.3%
San Francisco Giants
82
80
11
.506
11.2%
29.9%
41.1%
2.1%
San Diego Padres
79
83
14
.488
5.9%
21.2%
27.1%
1.0%
Colorado Rockies
67
95
26
.414
0.1%
1.0%
1.1%
0.0%
The Dodgers are clearly the best team in the NL West, but they’re not invincible. The team’s pitching plan to have about 15 really talented pitchers and hope nine or so are healthy at any given time could work out tremendously – as it has in recent years – but there’s certainly some risk there. It’s hard to capture in preseason projections, but the Dodgers will likely be aggressive in making trades to remedy flaws that pop up with their pitching staff during the season.
Arizona is a good team, but as is the case with the Rangers, there’s a serious risk of overrating a team because of a World Series appearance. The Diamondbacks were an 84-win team last year and their outlook for 2024 would’ve been about the same if the Brewers had eliminated them in the first round rather than vice-versa. That said, Arizona made several moves this offseason and, as a result, appears to be a better team overall than it was last year (and they were a team I talked up quite a bit).
The Giants are underwhelming, in part because they’ve missed out on most of the big free agents they’ve gone after, but that doesn’t mean they are bad. They are solid enough that they could make a wild card push, and their floor is higher than many think. But they need some more production in their lineup, and behind Logan Webb, there are a lot of moving parts in the rotation.
Replacing Juan Soto is a nearly impossible task, so it’s unsurprising that the Padres are projected to take a step back this season. ZiPS projects both the offense and the pitching to rank somewhere in the 17 to 21 range, depending on playing time assumptions. And while San Diego has repaired its farm system quicker than many (including this writer) expected, that doesn’t exactly help much for 2024.
The Rockies aren’t going to the postseason and will probably be well out of the playoff picture by mid-April. But at least they didn’t do anything this offseason to make their long-term outlook worse, which is kind of an improvement. I’m mildly hopeful that they take the proper lesson from the Nolan Jones trade and make it an organizational priority to acquire every interesting 25-year-old from a team that is unsure what to do with him.
2024 ZiPS Projected Playoff Wins – National League
To Win
10th
20th
30th
40th
50th
60th
70th
80th
90th
NL East
88.7
91.2
93.0
94.6
96.2
97.8
99.5
101.7
104.7
NL Central
82.8
84.9
86.4
87.7
89.0
90.3
91.7
93.4
95.9
NL West
87.2
89.6
91.4
92.9
94.4
96.0
97.7
99.8
102.7
To Win
10th
20th
30th
40th
50th
60th
70th
80th
90th
NL Wild Card 1
86.1
87.6
88.7
89.7
90.7
91.6
92.7
94.0
95.9
NL Wild Card 2
83.3
84.6
85.6
86.5
87.3
88.1
89.0
90.0
91.5
NL Wild Card 3
81.2
82.5
83.4
84.2
84.9
85.7
86.5
87.4
88.7
And here we have the simple chart – which I’ve been including in all of these ZiPS projected standings, except the times I forget – to show what win totals likely will make the playoffs, rather than the highest median win projection.
When Carl Pavano threw the first official pitch at the brand new Target Field on April 12, 2010, there was no Target logo on the mound. Mind you, there were Target logos aplenty all around the ballpark — on the wall behind home plate, just below the press box, up above the bleachers in right and center field, on the signs the fans brought and the hats they wore, and on the video boards on the façade of the upper deck, which often displayed rows of alternating baseballs and Target logos, hundreds of them wrapping around the entire stadium — just not on the pitcher’s mound. Later that year, the interlocking T and C of the Twins logo began appearing in the dirt behind the rubber; the Target logo didn’t start gracing the mound until 2016.
Still, in the early years of 2016 and 2017, the mound was often completely targetless. Even today, there are games where there’s no logo whatsoever — and not just nationally televised games, when the advertising rights can change. Sometimes it’s just the pitcher all alone up there (aside from the rubber, the cleat cleaner, and a couple rosin bags):
I don’t have any good guesses that explain the logo’s occasional absence, but I have so, so many bad guesses. Maybe the grounds crew is hiding the target somewhere else on the field and we’re supposed to be looking for it. Maybe Target leases the space on a per-game basis, and sometimes whoever is in charge of delivering that day’s check gets lost during the half-mile walk from Target Plaza Commons headquarters to Target Field. Maybe — and hear me out on this one — maybe the grounds crew just gets busy sometimes. I don’t know why it’s not always there, but if it’s supposed to be there every game, I hope this paragraph doesn’t get anybody in trouble. Read the rest of this entry »
Orlando Ramirez-USA TODAY Sports
Few positions on the Brewers depth chart are more set than catcher. William Contreras, whom they acquired before last season, was their best player in 2023. He led Milwaukee in hitting and finished third on the team in plate appearances despite shouldering a full-time catching load, which normally limits playing time. Most impressively, he delivered a sensational defensive performance a year after he was one of the worst receivers in baseball. On a team that struggled to generate offense, Contreras was a rare and brightly shining exception.
Naturally, the Brewers just signed the best free agent catcher on the market, give or take DH Mitch Garver. That’d be Gary Sánchez, who is joining the team on a one-year, $7 million contract, as Jon Heyman reported. It sounds bizarre – and it may well be bizarre. But there’s a method to Milwaukee’s madness, so let’s try to figure it out together.
There’s one obvious thing going for the Brewers: They really needed a second catcher. Before they signed Sánchez, the plan was to use Eric Haase, he of the 42 wRC+ in 2023, as their second backstop. That plan was not great, to put it succinctly. Haase probably isn’t that bad offensively, but he’s also not particularly good behind the plate. In his best years in Detroit – he hit a career-high 22 home runs in 2021 and topped out at 1.3 WAR in 351 plate appearances the following season – he wasn’t used as a pure catcher, dabbling in the outfield and at DH and racking up meaningfully negative framing numbers when he did don the tools of ignorance. Read the rest of this entry »
The best pitch in baseball is a well-located four-seam fastball. It is the rhythm guitar of pitching, the rock upon which the church is built. To establish the fastball first is fundamental; to pitch any other way is backwards.
Maybe you don’t need it at all.
In the late 20th century, rock and roll evolved into different popular forms that either de-emphasized the role of the guitar or eliminated it altogether. Some artists went forward and embraced electronic instruments; others went back in time and rediscovered the piano. Of the 603 pitchers who threw at least 250 pitches last year, 49 didn’t throw a single four-seamer. Many of them were quite successful. The anti-four-seamer crowd includes top relievers like Josh Hader, Camilo Doval, and José Alvarado, as well as elite starters like Corbin Burnes and Framber Valdez. Read the rest of this entry »
Reggie Hildred-USA TODAY Sports
With the Dodgers reporting for pitchers and catchers on Friday, this week seems like a good time to do run ZiPS projections for all 30 teams. Let’s be clear up front: These are not the final preseason projections – and an ancient curse I saw suggests that if you quote them as such, ghosts will eat your lymphatic system – but they’re the best expression of how ZiPS sees the league right now. After all, several marquee free agents remain unsigned and rosters will surely change between now and the start of the 2024 season.
These standings are the result of a million simulations, not results obtained from binomial, or more competently, beta-binomial magic. The methodology isn’t identical to the one we use for our playoff odds, which were released yesterday, meaning there naturally will be some notable differences in the results.
So how does ZiPS calculate the season? Stored within ZiPS are the first- through 99th-percentile projections for each player. I start by making a generalized depth chart, using our Depth Charts as a jumping off point. Since these are my curated projections, I make changes based on my personal feelings about who will receive playing time as filtered through arbitrary whimsy my logic and reasoning. ZiPS then generates a million versions of each team in Monte Carlo fashion (the computational algorithms, that is — no one is dressing up in a tuxedo and playing chemin de fer like James Bond).
After that is done, ZiPS applies another set of algorithms with a generalized distribution of injury risk that changes the baseline plate appearances or innings pitched for each player. ZiPS then automatically and proportionally “fills in” playing time from the next players on the list to get to a full slate of PAs and innings.
The result is a million different rosters for each team and an associated winning percentage for each million of them. After applying the new strength of schedule calculations based on the other 29 teams, I end up with the standings for each of the million seasons. I promise, this is much less complex than it sounds.
The goal of ZiPS is to be less awful than any other way of predicting the future. The future is tantalizingly close but beyond our ken, and if anyone figures out how to deflect the astrophysicist Arthur Eddington’s arrow of time, it’s probably not going to be in the form of baseball projections. So we project probabilities, not certainties.
Over the last decade, ZiPS has averaged 19.6 correct teams when looking at Vegas preseason over/under lines. I’m always tinkering with methodology, but most of the low-hanging fruit in predicting how teams will perform has already been harvested. ZiPS’ misses for teams from year to year are uncorrelated, with an r-squared of one year’s miss to the next of 0.000562. In other words, none year-to-year misses for individual franchises has told us anything about future misses for those franchises.
2024 ZiPS Projected Median Standings – American League East
Team
W
L
GB
Pct
Div%
WC%
Playoff%
WS Win%
Baltimore Orioles
90
72
—
.556
36.4%
38.5%
74.9%
8.4%
New York Yankees
88
74
2
.543
25.5%
40.0%
65.6%
5.9%
Toronto Blue Jays
88
74
2
.543
24.5%
39.1%
63.6%
5.6%
Tampa Bay Rays
83
79
7
.512
9.7%
29.9%
39.5%
2.1%
Boston Red Sox
79
83
11
.488
3.9%
18.1%
22.0%
0.8%
I’m from Baltimore, but I would hope last year’s projection miss would disavow anyone of the notion that I weight these team standings toward my personal preferences. The Orioles – and last year’s Orioles – do a bit better in my methodology than others, I suspect because of the weight I deal with depth. In those seasons in which they lose players, especially offensive ones, the team’s depth keeps the falloff from being too dire. Even in simulation no. 452,331, in which the O’s lose both Gunnar Henderson and Adley Rutschmann to season-ending injuries before the first game, the team still finished 84-78!
The Yankees have significant downside given how much of their punch is tied up in a handful of players, but the reports of their death are quite premature. Juan Soto will provide a huge offensive boost this year, even if they don’t re-sign him after the season. They also added two other outfielders, Alex Verdugo and Trent Grisham, who are better than everybody they ran out there last year, with the exception of Aaron Judge.
ZiPS likes Toronto’s rotation and expects the return of Kevin Kiermaier to help, but without Matt Chapman, it sees third base as a major downgrade from last year. The Rays almost always get the most out of their depth, but ZiPS isn’t sure how much production they will get from their DH spot or how they will cobble together their rotation without Tyler Glasnow.
The Red Sox aren’t a dreadful team, but they’re merely OK in a division that has four good-to-great teams. That being said, they’re just good enough that they still have slightly better than a one-in-five chance of making the playoffs.
2024 ZiPS Projected Median Standings – American League Central
Team
W
L
GB
Pct
Div%
WC%
Playoff%
WS Win%
Cleveland Guardians
85
77
—
.525
42.4%
13.6%
56.0%
3.9%
Minnesota Twins
85
77
—
.525
42.1%
13.6%
55.7%
3.8%
Detroit Tigers
77
85
8
.475
10.3%
7.3%
17.7%
0.5%
Kansas City Royals
74
88
11
.457
4.7%
3.9%
8.6%
0.2%
Chicago White Sox
66
96
19
.407
0.4%
0.4%
0.7%
0.0%
ZiPS projects Cleveland to be relatively even with Minnesota, in large part because it likes the rotation trio of Shane Bieber, Triston McKenzie, and Tanner Bibee more than other projection systems do. ZiPS doesn’t see the Guardians as significantly below average at any position — Andrés Giménez remains a ZiPS favorite — and it thinks their bullpen is underrated. The Twins won the division fairly comfortably last year, but remember, they won only 87 games and just lost the AL Cy Young runner-up, Sonny Gray, in free agency. The Jorge Polanco trade came from a surplus of infield talent, but the additions of Anthony DeSclafani and Justin Topa won’t compensate for Gray’s loss to the rotation. If you like Carlos Santana, the team’s “big” offseason signing, I’d recommend you not look at the projection for him.
The projections still see more upside for Detroit’s pitching than its hitting, though after Spencer Torkelson’s surge last summer, ZiPS does expect him to keep improving in his third big league season. The Tigers are good enough that they can make a serious run at .500, but they’ll need some good fortune to get enough offense.
The Royals get credit for being active in free agency this offseason, signing veteran starting pitchers Seth Lugo and Michael Wacha, reliever Will Smith, slugger Hunter Renfroe, and utility man Adam Frazier, among other players. That said, those are the types of moves a team makes when it already has a strong core in place and is ready to contend, and, at least as ZiPS sees it, the Royals aren’t quite there yet. That’s not the worst thing in the world, considering they just signed shortstop Bobby Witt Jr. to the longest, most valuable extension in franchise history.
ZiPS has the White Sox as one of the worst teams in baseball, with little to look forward to outside of Dylan Cease, Luis Robert Jr., and the hope that Yoán Moncada and Eloy Jiménez get back on track. This organization is in a very dangerous position in that, like the Rockies a few years ago, I’m not sure it truly understands where it stands.
2024 ZiPS Projected Median Standings – American League West
Team
W
L
GB
Pct
Div%
WC%
Playoff%
WS Win%
Houston Astros
89
73
—
.549
43.3%
26.5%
69.8%
7.3%
Texas Rangers
86
76
3
.531
28.0%
28.4%
56.4%
4.5%
Seattle Mariners
85
77
4
.525
23.0%
27.4%
50.4%
3.5%
Los Angeles Angels
79
83
10
.488
5.6%
13.2%
18.9%
0.6%
Oakland A’s
63
99
26
.389
0.0%
0.1%
0.1%
0.0%
ZiPS still sees the Astros as the class of the AL West, thanks to the massive concentration of talent in the heart of their lineup. It wasn’t a busy winter for Houston, but the big addition, Josh Hader, gives a boost to the bullpen. The Astros, though, are not unstoppable. They have a lot of viable arms in the rotation, but the upside isn’t what it was three or four years ago, even if Justin Verlander has another strong season left in his arm.
The Rangers are a well-built team, but a lot of their offensive talent is on the wrong side of 30, and last year was probably the best case scenario for a few of their hitters. Their starting pitching is weaker now than it was at the end of 2023. ZiPS did account for the late-season returns of Max Scherzer, Jacob deGrom, and Tyler Mahle to reinforce the rotation, but all those games without them count, too, and as of this writing, Texas has not re-signed or replaced Jordan Montgomery.
ZiPS likes a lot of what the Mariners did this offseason. It projects Jorge Polanco as a moderate plus at second base and Luis Urías to be an effective replacement for Eugenio Suárez. Gregory Santos is in the top tier of projected relievers, though his projection will come down just a tad once a fixed error in the ZiPS database propagates to our player pages.
It will be nice for the Angels to get full seasons from Zach Neto and Nolan Schanuel, and the team has spent its offseason quietly beefing up its bullpen. But losing Shohei Ohtani is going to hurt.
I believe I have talked about all the major league teams in the AL West and surely did not forget anyone.
2024 ZiPS Projected Playoff Wins – American League
To Win
10th
20th
30th
40th
50th
60th
70th
80th
90th
AL East
89.2
91.4
93.0
94.4
95.7
97.1
98.5
100.2
102.7
AL Central
82.7
85.1
86.8
88.3
89.7
91.2
92.8
94.7
97.3
AL West
86.7
89.0
90.6
92.1
93.5
94.9
96.4
98.2
100.8
To Win
10th
20th
30th
40th
50th
60th
70th
80th
90th
AL Wild Card 1
87.3
88.8
89.9
90.9
91.8
92.8
93.9
95.1
97.0
AL Wild Card 2
84.6
86.0
86.9
87.8
88.6
89.5
90.3
91.4
92.9
AL Wild Card 3
82.5
83.8
84.7
85.5
86.2
87.0
87.8
88.8
90.2
One thing that drive me nuts about the discourse of the ZiPS projections is when someone looks at the top median projection and gets very angry with me that some division can be won with 89 or 90 wins. Since most of the tweets on this subject have an aspect for Mature Audiences Only, I’ve translated an example into something suitable for polite company.
Verily, Szymborski, thou art bereft of wit! How dare thee proclaim that a mere tally of 89 victories shall secure the Astros dominion over the AL Wast! Thy discourse betrays a lamentable ignorance, akin to that of a common dullard. Thy prognostications, I dare say, are as worthless as the dregs of a shire-reeve’s larder after Michaelmas!
Yes, the Astros have the best median projection in the AL West at 89 wins, but that doesn’t mean 89 wins will actually win the AL West. This last chart shows the probabilities that X number of wins will take the division or wild card spot in question. So, 89 wins might win the AL West, but only about 20% of the time. The Orioles project to 90 wins, but in the 36.4% of scenarios in which they won the AL East, they averaged 95.3 wins.
Kevin Jairaj-USA TODAY Sports
“Jose Altuve will be an Astro for life,” read the club’s announcement on Tuesday afternoon. Under different circumstances, that could be construed as a threat. But Altuve will be well-remunerated for the remainder of his time in Houston: His new contract extension will run for five years, starting in 2025, and pay him a guaranteed $125 million.
This is the third long-term contract Altuve has signed with the Astros, the club that signed him as a 16-year-old out of Venezuela all the way back in 2007. By the time it’s over, he will have spent some 23 seasons in the organization, 19 of them in the major leagues. The phrasing of the announcement is a little more concrete than any prediction about 2029 ought to be. It’s possible that Altuve will continue playing once his deal expires. But when it does, he’ll be seven months short of his 40th birthday. That seems like as good a time as any to plan on wrapping things up. Read the rest of this entry »