Archive for Daily Graphings

A Series of Fortunate Pitching Decisions

D. Ross Cameron-USA TODAY Sports

Baseball is a game all about decisions. Some are minuscule, micro-level decisions that everyone will forget about after they happen. Should I sit fastball on this pitch? Should I take off for second base? Meanwhile, some are much larger, macro-level decisions felt over the course of one or multiple seasons. Should I try to lift the ball more? Should I change the grip of my slider? Everyday games over the course of a long season let us keep track of these larger trends, but no one could possibly analyze every substitution or pitching change over a 2,430-game regular season. So, instead, I’ll look at just three. In a midweek series last week, the Phillies and Giants put on a clinic of cat-and-mouse strategy and mostly excellent pitching. Let’s take a look at both the small- and large-scale decisions that contributed to this excellence on the mound.

Game 1 was a relatively high-scoring affair in which neither starter shined. There was nothing interesting to report from the Phillies side, as backend starter Taijuan Walker completed six innings but allowed as many runs. Opposite him was the struggling Blake Snell, who, in his typical inefficient fashion, lasted just four innings before being removed. To begin the fifth, manager Bob Melvin turned to rookie Randy Rodríguez, a sensible choice given his consistent multi-inning appearances to provide length to the Giants bullpen. In his first inning, Rodríguez retired the heart of the lineup in order on just 10 pitches, making him the easy choice to come back out for the sixth, due to face a pair of Phillies platoon hitters inserted into the lineup to face Snell.

Phillies Platoon Projections
Name ZiPS OPS vs. LHP ZiPS OPS vs. RHP
Brandon Marsh .653 .743
Cristian Pache .726 .585
Bryson Stott .672 .706
Whit Merrifield .678 .657

Pache and Merrifield really aren’t guys you want hitting against a righty, especially one as nasty as Rodríguez, whose absolute hammer of a slider creates a difficult look for same-handed batters. Despite Marsh and Stott, the regular starters, ready to pinch-hit, Phillies manager Rob Thomson elected to keep them on the bench in a one-run game. His reason was the man standing on a bullpen mound beyond the center field fence: Lefty Erik Miller was warming up for the Giants.

While the Giants could have sent in Miller in response to a pinch-hitter, I still think using Marsh and Stott would’ve been the correct decision for Thomson. First, given Pache and Merrifield’s futility against right-handed pitching, almost any other scenario would have been more favorable. Indeed, the two managed a fly out and groundout against Rodríguez, combining for an xBA of .090. Furthermore, with lefty sluggers Kyle Schwarber and Bryce Harper at the top of the lineup (with a 91 and 72 point gap in projected OPS, respectively, between their splits vs. right-handed and left-handed pitchers), it would’ve been wise for Thomson to force Melvin to burn one of the two lefty relievers in the Giants bullpen, which could’ve led to more favorable matchups later in the game. Because Thomson decided not to make any substitutions, Miller wasn’t needed until the next inning, a scoreless effort in which he allowed just one hit, the popup single in front of home plate that Ben Clemens wrote about in Friday’s Five Things column. Marsh and Stott did eventually hit in the ninth, as did lefty bench bat Kody Clemens, but only after Philadelphia’s deficit had ballooned to four runs.

The fact that Miller only threw one inning in Game 1 became significant the next day, as he was fresh enough to slot in as the opener for bulk man Spencer Howard, a former Phillies top prospect who stalled upon hitting the majors and entered play with a career ERA north of seven. Thomson rolled out the lefty-heavy lineup hoping to feast on Howard’s mediocre fastball shape, so for the second day in a row, Miller faced the Phillies’ top three without allowing any damage. In traditional opener games, Howard would come out next and make his start as normal. Instead, Melvin went a different route, delaying Howard’s entrance in favor of bringing in Taylor Rogers, the only other available lefty he had. It’s not the first time a team has used multiple openers, but it’s certainly unorthodox during the regular season, with few off-days to rest the staff. The left-handed Rogers twin breezed through two scoreless innings, turning the lineup over before handing the ball off. Howard still had to get the job done, but Miller and Rogers lessened his load by nine outs, taking out a lefty-vulnerable lineup that wouldn’t turn to pinch-hitters so early in the game. Howard turned in four scoreless frames, and his team needed every bit of it, as they won 1-0 in extras.

Melvin’s management of his staff made the most of his available, although depleted, personnel. Under ideal circumstances, teams wouldn’t use emergency bulk arms, multiple openers, or an entire staff composed of swingmen, but an open rotation spot due to injury forced the Giants to scrap together innings by any means necessary. While Melvin’s tactical decisions were the best use of his limited arms, the opposite side of this matchup showed a fully operational, elite rotation at its finest. The Phillies currently have the best starting pitching in the league by every measure, and it’s not particularly close.

Best Rotations in Baseball
Team WAR ERA- Innings Per Start
Phillies 8.2 66 5.93
Royals 6.8 77 5.70
Orioles 6.0 82 5.49
Red Sox 6.0 77 5.15
Nationals 5.7 98 5.39
Tigers 5.7 94 5.48
Braves 5.5 91 5.58
Yankees 5.3 71 5.70
Dodgers 5.1 87 5.27
Mariners 4.9 92 5.82

Most of that value comes from four excellent arms, two of which appeared in this series. First, in the second game, it was Zack Wheeler, who has continued his run as baseball’s most consistently excellent starter over the past half-decade. Even with his velocity finally starting to show signs of age, he’s on pace for career bests in ERA (2.32) and xERA (2.60), and his 29.0% strikeout rate is just below the career-high 29.1% mark he posted in 2021. Much of his success has come from an eagerness to change his approach and arsenal over time – first emerging as a Cy Young finalist after embracing the power of the elevated fastball, then adding a new pitch to his arsenal in each of the last two seasons. In 2023, a sweeper became his breaking pitch of choice; this season, like many other pitchers, he’s added a splitter. Wheeler now throws six pitches with regularity, a re-invention of his style from just a few years ago.

In dominating the Giants, Wheeler demonstrated the complementary power of his sinker and new split, with the former earning called strikes at a 29% clip and the latter inducing four whiffs on just 10 uses. The splitter has above-average run just like his two-seamer; it even spins on the same axis after adjusting for seam-shifted wake. It’s almost as if Wheeler precision engineered his splitter to travel on the exact same tunnel as his sinker for the first 40 feet of flight before diverging, making it extremely difficult for batters to tell them apart. The brand-new splitter is already Wheeler’s best secondary offering by run value, and it’s also helped make his sinker considerably more effective, with a 40-point drop in xwOBA compared to last season.

Wheeler put together one of his best starts of the season, striking out nine San Francisco hitters across six scoreless innings, but he couldn’t outdo his opponent’s parade of openers and was saddled with a no-decision. The next afternoon, in the series finale, Cristopher Sánchez enjoyed a Phillies offensive outburst that was absent from the first two games. In last year’s breakout campaign, the lefty Sánchez put up above-average numbers over 19 appearances, but what held him back from excellence was an abysmal showing against right-handed hitters, who ran a slugging percentage that was more than double their that left-handed counterparts. He’s leveled up this year, currently holding a share of the NL lead in FIP. And while he still runs an exaggerated platoon split, he’s been able to limit the power of opposite-handed hitters, as seen on Wednesday against a daunting all-righty Giants lineup.

The calling card of Sánchez’s arsenal is a changeup with few comps in terms of movement, boasting 97th percentile drop and 95th percentile run. This exceptional pitch generated gaudy whiff numbers during his time as a prospect, and has only continued in the big leagues. The problem is that Sánchez’s sinker, which he uses to set up the changeup, gets absolutely hammered, especially by righties. Drastically cutting his sinker usage wouldn’t be the solution, because that would allow batters to sit on his change and make it more hittable. So, rather than shelving the sinker, Sánchez made a change to when he used it.

Cristopher Sánchez Pitch Usage
Sinker Changeup Slider Cutter
1st Pitch of PA 50% 4% 42% 4%
After 32% 47% 11% 10%
SOURCE: Statcast

Sánchez took advantage of the Giants’ passivity on first pitches by throwing juicy sinkers to 12 of the 24 batters he faced; none of them were put into play. In fact, over a third of his sinkers in the game were taken for called strikes, his highest mark of the season. After getting ahead in the count, Sánchez then let the changeups rain down, racking up strikeouts and groundouts. By the end of the start, Sánchez’s sinker — a pitch that had allowed loud contact like no other in the past — surrendered zero barrels and zero extra-base hits. Like Wheeler the day prior, Sánchez turned in six scoreless innings, while the Philadelphia bats knocked around the surprisingly hittable Kyle Harrison. The vulnerability of Sánchez’s sinker likely caps his upside as a mid-rotation guy, but certainly one more than capable of starting playoff games for his contending team.

The Giants won the series, taking two games out of three. They showed they could win even with a starting rotation depleted by injury and underperformance, tilting the odds in their favor with crafty personnel decisions that kept the Phillies’ offense guessing as to who would come out next. (Of course, over the weekend, the Giants were swept by the Yankees in San Francisco, perhaps displaying the limitations of a team with a shaky staff.) On the other side, Philadelphia’s buzzsaw of a rotation was created by decisions as well, albeit ones made on the more macro level. From arsenal tweaks to command improvements, these changes demonstrate why this team is top dog right now in the National League.


Sunday Notes: Matt Vierling Looks Back on His Two-Way Days

Matt Vierling has been swinging a hot bat with the Detroit Tigers. Over his last 11 games, the 27-year-old third baseman/outfielder is 16-for-41 with four doubles, a triple, four home runs, and 13 RBIs. His slash line over the span is .390/.435/.829 bringing his seasonal mark to a solid .292/.324/.509. While by no means an offensive force, he has nonetheless been an integral part of the lineup. Since being acquired by Detroit from Philadelphia prior to last season as part of the five-player Gregory Soto swap. Vierling has the second-most hits (175) on the team, and a respectable 106 wRC+.

Defensive versatility adds to Vierling’s value — his big-league ledger includes games at 3B, 2B, CF, RF, and LF — and there is a chance that another non-DH position could eventually be added to the list. Given the right circumstances, he might even pitch. It would be familiar territory. Vierling thrived on the mound as a prep, then was a two-way player at the University of Notre Dame from 2016-2018.

A Perfect Game showcase in Minneapolis is a standout memory for the St. Louis, Missouri native. Vierling recalls Carson Kelly’s brother, Parker, being one of his teammates, while Ke’Bryan Hayes and Josh Naylor — “I pitched against him if I remember correctly” — were among his notable opponents. Playing well against that type of talent garnered him attention from colleges and professional scouts alike, and while his bat showed promise, it was the arm that stood out the most. Read the rest of this entry »


The Rosin Bag Bag

During most baseball games, there are eight people calling the action. Both the home and away teams have radio and television broadcasts, and most of those crews consist of a play-by-play announcer and a color commentator. If those teams have a Spanish language broadcast, the number is even higher. More often than you might think, something notable happens in the middle of a game and not one of those eight people notes it. Maybe a player will square around to bunt but end up taking the pitch, and that detail just goes unremarked upon by everyone. It’s a small detail, but it’s part of the story of the game. It tells you about the batting team’s strategy and their confidence in the hitter. It informs the defense’s pitch selection and positioning. Maybe the television crews figure you already saw it. Maybe the radio crews need to squeeze in a promo or the color guy’s in the middle of an anecdote about that one time he got to be an extra in Little Big League. There’s only so much time between pitches, and the announcers all have a decision to make on how best to fill it. Either way, if you’re listening on the radio, or if you’re looking away from your television for a moment, you’ll never know it happened at all.

Something happened on Wednesday, in the first game of a doubleheader between the Tigers and Pirates. I found it remarkable, but apparently I was alone. No one else mentioned it. The Pirates were starting Jared Jones and Paul Skenes that day, and I was watching Detroit’s television broadcast. I did so partly because Jason Benetti is a delight, but mostly because when Jones and Skenes are on the mound, it’s fun to hear the opposing announcers react with awe as they watch batter after batter on their own team get taken apart limb from limb. Unfortunately for both Jones and me, the Tigers avoided dismemberment, hanging five earned runs and two unearned runs on Jones en route to a breezy 8-0 victory. On the bright side, Benetti and Kirk Gibson, who was serving as color commentator, decided that for much of the game, the best way to spend their time was by bickering like an old married couple.

Benetti: Do they know you at your local donut shop?

Gibson: No.

Benetti: They know you as the guy who orders all the chocolate fry cakes.

Gibson: I don’t. I’m on the sugar free now, so I’m not doing it now. So nobody knows.

Benetti: Well, everybody knows you’re on the sugar free diet because you keep saying it. Read the rest of this entry »


Broadcaster’s View: Tales From the Minor Leagues

Larry McCormack / The Tennessean-Nashville

Last month a piece titled “Player’s View: Tales From the Minor Leagues” ran here at FanGraphs. Comprising a collection of current and former major leaguers relating stories from their time on the farm, it was equal parts entertaining and informative of life below the big league level. What you’re reading now is a followup, albeit with a notable twist. The storytellers here are all broadcasters: two who picked up a microphone after their playing days were over, and three more who never played professionally. As was the case with the earlier piece, many of the stories will leave you laughing, if not shaking your head.

———

Jeff Levering, Milwaukee Brewers broadcaster:

“There are a lot of great stories. One I’ll always remember is from when I was [broadcasting] with Springfield, in Double-A. We played a night game in Little Rock and needed to get to Tulsa for a game the next day. There was a torrential downpour — the worst rain I’ve seen in my life — and I was in charge of getting the movies for the bus. Our manager at the time was Pop Warner, who is now the third base coach for the St. Louis Cardinals, and he was staunch about no comedies. It was all horror movies, all the time, and the gorier the better — for him. Anyway, most of the guys were asleep in the back, but some of us were watching and it’s getting to be one of the scariest parts of the movie. This was in the middle of a torrential downpour in rural Arkansas.

“Up ahead we see a pair of headlights, but the headlights are sideways in the middle of the road. Our driver doesn’t see it until the last moment and we missed this car, which had spun out in the middle of the road, by a foot — no less than a foot. We ended up going into the left lane and down into the embankment, and right back up. That woke everybody up. From that point on everyone was awake. It was a really bad accident that could have happened but didn’t happen, and it was the middle of the night. Again, we were in the middle of Arkansas. No one would have found us until the next day. Read the rest of this entry »


Waiting for Victor Robles

Scott Taetsch-USA TODAY Sports

It’s the double-R that makes it tricky. In the name Victor Robles, all of the emphasis is front-loaded. Victor is spondaic and Robles is trochaic, which means three stressed syllables in a row followed by that one last unstressed syllable: VIC-TOR RO-bles. It’s a shout followed by a whisper, which doesn’t exactly roll off the tongue. But even if you cheat a little bit and turn the first name into a trochee — VIC-tor RO-bles, sing-songy like Mickey Mantle or Dr Pepper — you still can’t get it to flow because you need to pause between those two Rs, lest the two names get pressed together into one breathless pileup of syllables: victorrobles. No matter what you try, that emphatic start grinds to a halt.

After more than 10 years and nearly as many false starts, the center fielder’s time with the Washington Nationals has come to a complete stop. The team designated Robles for assignment on Monday, eight days after his 27th birthday. They now have a week to trade, waive, outright, or release him. Robles, who is in his eighth season as a big leaguer, would almost certainly opt for free agency rather than accept an outright assignment to the minors. Despite his struggles, he seems likely to garner another opportunity. To Washington fans who had been dreaming on him since 2015, Robles often seemed tantalizingly close to finally breaking out. Over the course of his career, Robles has a combined .725 OPS in his first 10 games of a season and a combined .576 OPS in his last 10. He has a career 93 wRC+ in March and April; May is the only other month when he’s within 10 points of that mark. Many of those hot starts were also marred by early-season injuries: a hyper-extended elbow in April 2018, a sprained ankle in May 2021, back spasms in May 2023, a strained hamstring this April. He just never found a way to keep it going. Read the rest of this entry »


Snellinger and the Jungle of Doom

Kamil Krzaczynski-USA TODAY Sports; Cary Edmondson-USA TODAY Sports

On the one hand, free agency is an important right that grants players the power to choose their employer and negotiate a fair salary. On the other hand, job hunting is super, mega stressful. I don’t say this to imply anyone should try to avoid free agency, but rather to acknowledge that some things are objectively good and still leave you so nervous about making the wrong choice that you impulse purchase one of those patron saint figurines from a display near the register at a convenience store, then bury it in your front yard for good luck while sipping on a cherry coke slushy, even though you’re not particularly religious, and looking back with the clarity of hindsight, you’re pretty sure that figurine was an angelic depiction of Dale Earnhardt Sr.

Anyway, players don’t need to rely on Nascar voodoo to make career choices. A more logical system is possible. Specifically, a system to help players evaluate which teams tend to facilitate a player’s best on-field performance. In a previous piece, I compared the performance of players acquired by the Angels to that of players acquired by the Dodgers in the name of comparing how Shohei Ohtani’s stint with the Angels might have gone if the Angels were secretly run by the Dodgers. But why stop there, when we can compare all 30 teams and give free agents a feel for which clubs are most likely to offer a boost to their performance and which ones are baseball purgatory?

But first, let’s run through the methodology. In back-to-back seasons, it’s reasonable to expect a player’s performance to be roughly the same aside from the usual variation within a player’s true talent range and a mild adjustment for aging (insert caveats on injuries and other extenuating circumstances here). So if a player changes teams and goes on to post notably different numbers, it’s reasonable to credit a decent chunk of the change in output to the new work environment. Therefore, comparing player performance in adjacent seasons with different teams and aggregating at the team level provides a metric for evaluating how well a team maximizes the ability of its major league acquisitions. Read the rest of this entry »


The Day Negro Leagues Statistics Met the Major League Record Books

Georgie Silvarole/New York State Team

Wednesday was a big day in the world of baseball statistics, albeit a more complicated one than initially met the eye. Major League Baseball announced that the statistics from seven professional Negro Leagues that operated between 1920 and 1948 have been officially incorporated into its database, the culmination of a process that began in late 2020, when MLB first recognized those circuits as major leagues. As a result, several longstanding seasonal and career records have officially changed hands; most prominently, Josh Gibson is now the single-season and all-time leader in batting average, slugging percentage, and OPS, supplanting Ty Cobb and Babe Ruth in the career categories. The grassroots effort to gather and audit the Negro Leagues data that made this possible has been laudable, even heroic. But while we can never do enough to acknowledge the greatness of Gibson and his peers — along with the pain and injustice that they faced both within and outside baseball — MLB’s announcement and the dissemination of the news did strike a few sour notes, just as in 2020.

To be clear, this is not a quibble with the concept of compiling these statistics — the result of decades of diligent, painstaking research that has included the manual entry of thousands of box scores into spreadsheets and databases — which illustrate the extent to which legendary players such as Gibson and less renowned ones such as Charlie “Chino” Smith rightfully belong alongside the Cobbs and Ruths of baseball history. The efforts of expert researchers such as Larry Lester and the Seamheads group to set the record straight, and to validate the careers of some 2,300 Negro Leagues players as major league, are tremendously important; in listening to Lester and MLB official historian John Thorn describing this work on Wednesday’s Effectively Wild podcast, one can hear their pride and joy with regard to this occasion. Instead, this is an issue of semantics and nuance, because words and language matter. The wrong ones can obscure the important distinctions in play, particularly when it comes to MLB’s culpability in creating and reinforcing the conditions that made the Negro Leagues necessary. Read the rest of this entry »


Robert Gasser Is Making the Josh Hader Trade Look Better for the Brewers

Mark Hoffman/Milwaukee Journal Sentinel-USA TODAY NETWORK

Robert Gasser was flying mostly below radar as a prospect when he was first featured here at FanGraphs in July 2022. Pitching in the Midwest League one year after being drafted 71st overall out of the University of Houston, he was putting up solid but by no means eye-catching numbers with San Diego’s High-A affiliate. Earlier in the season he’d been assigned a 40 FV and a no. 14 ranking on our 2022 Padres Top Prospects list.

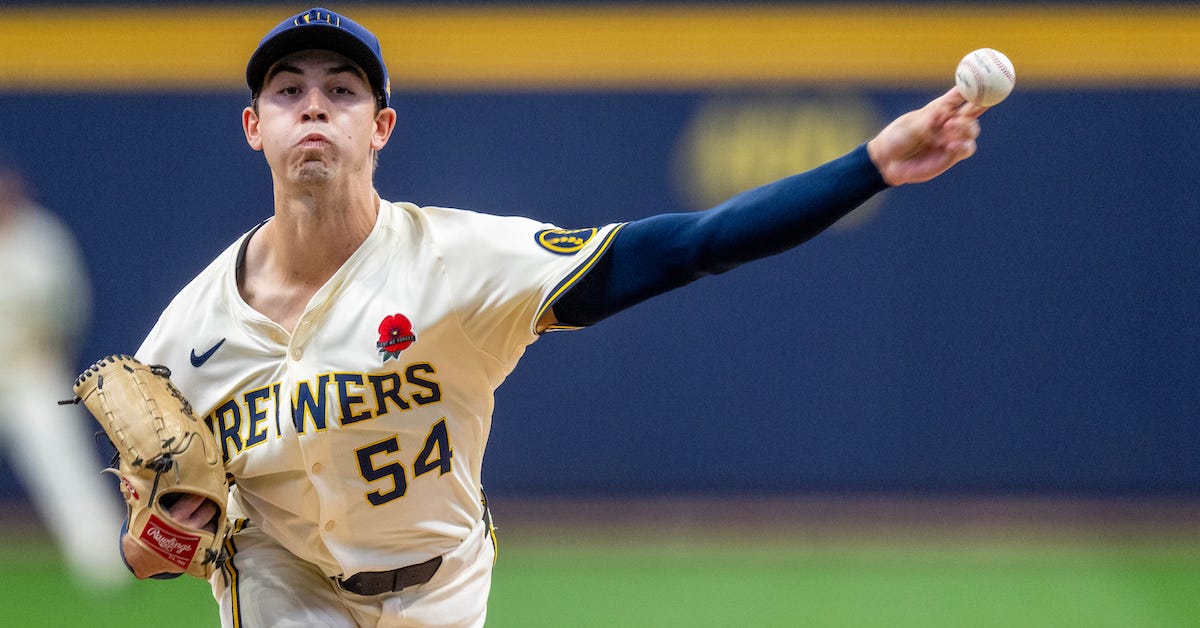
Shortly after that first piece about Gasser was published, the Padres dealt him to the Brewers as part of the Josh Hader trade, which at the time was widely panned by Milwaukee fans. While the consternation was understandable, the criticism is increasingly abating. Nearly two years later, Gasser is four starts into his MLB career and boasts a 1.98 ERA and a 2.52 FIP over 23 innings. In three of his outings he’s gone at least five frames and surrendered one run or fewer.

How has he gone from a low-profile prospect to a pitcher getting good results at baseball’s highest level? There has been no magic bullet, Gasser said, and he hasn’t made any especially notable adjustments since we first spoke in 2022. Read the rest of this entry »


William the Strike Zone Conqueror

Peter Aiken-USA TODAY Sports

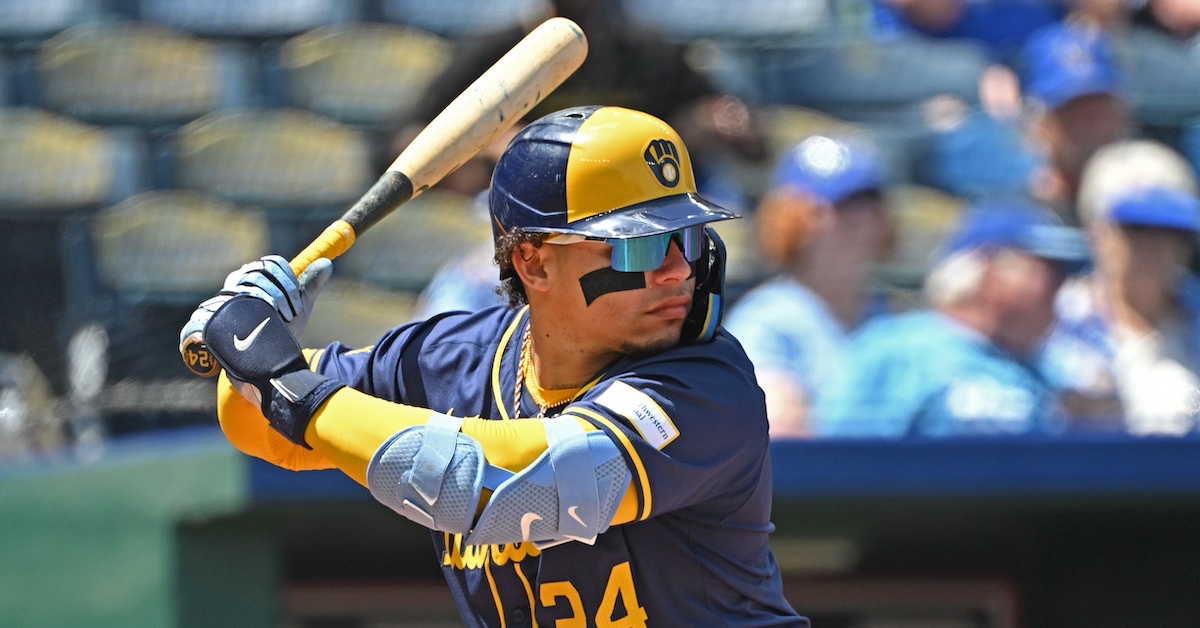
William Contreras stopped being an unheralded star a while ago. He was merely “the backup catcher” in Atlanta, but he smashed last year as the undisputed starter in Milwaukee and he’s backing it up with another spectacular season. He’s the face of one of Statcast’s new bat speed metrics. He’s a shoo-in All-Star and one of the betting favorites to win NL MVP. So this isn’t a “hey, have you heard he’s good?” article, because of course you have. The real question is, what has he changed this year?

Contreras’ standout skill is his thunderous raw power. He cracked 20 homers in just 376 plate appearances during his breakout 2022 and is one of the hardest swingers in the game. As you might expect, he has swing-and-miss issues, with his 13.4% swinging strike rate the price he pays for trying to crush everything he swings at. But that’s ok. His hard-hit rate, barrel rate, maximum exit velocities, and HR/FB rate are all gaudy.

Here’s the thing, though: While power might be his most obvious carrying tool, Contreras has quietly developed into much more than just a one-note power hitter. You can’t see it in the surface numbers – he’s walking about as much as he always has and striking out as frequently as he did last year – but he’s completely revamped his approach at the plate, and it’s downright sterling these days. In fact, maybe we should be talking less about how Contreras compares to Juan Soto in squared up contact, and more about how he compares to Soto in strike zone mastery. Read the rest of this entry »


The ZiPS Two-Month Standings Update

Cary Edmondson-USA TODAY Sports

It may still feel like the 2024 season just got started, but Major League Baseball passed the one-third mark this past week. This is usually a good time for a full, fresh run of the ZiPS projected standings, and I think it’s especially so now after Ronald Acuña Jr.’s season-ending injury, which will have a serious impact on the NL East race.

The ZiPS projected standings use a different methodology than our Depth Chart standings, beyond only using ZiPS rather than a ZiPS/Steamer mix. Stored within ZiPS are the first- through 99th-percentile projections for each player. I start by making a generalized depth chart, using our Depth Charts as a jumping off point. I then make my own changes, and the final results are correlated with, but far from identical, to Jason Martinez’s projected PAs and IPs. It varies from player to player, but the biggest systemic difference is that my “average” projected playing time for individual players reflects a larger chance of significant injury. I feel this methodology helps better express a team’s depth, something crucial as the season goes on and IL attendance grows. It has the disadvantage, though, of being quite workload intensive, meaning it’s not something that can just be auto-run every morning.

The one change in methodology from past standings is that the average playing time for the projected players is month-based. For example, ZiPS sees no innings for Jacob deGrom at all in June or July, with most of the innings (I have the average at 15) coming in September. So each time, rather than having one distribution of expected team strength for the season, ZiPS now has six distributions for each team based on the calendar month. While the resulting changes are quite small, the sad truth is that baseball projections are mature enough after a couple decades that all improvements are tiny. It’s not just the low-hanging fruit that’s gone; you now have to climb a rickety ladder held by an inebriated friend to get the ones way up there.

Let’s get into the projections before we reach a Tolkien-movie level of narrator exposition. It should go without saying, because it rarely seems to end up that way, but take this as a reminder that 0.0% is not literally 0.0%, but until mathematical elimination, a number that rounds to 0.0%.

ZiPS Projected Standings – NL East (5/29)
Team W L GB Pct Div% WC% Playoff% WS Win% 80th 20th
Philadelphia Phillies 94 68 .580 64.6% 28.5% 93.1% 9.2% 100.4 88.5
Atlanta Braves 90 72 4 .556 33.1% 46.8% 79.9% 7.2% 96.6 83.9
New York Mets 78 84 16 .481 2.1% 17.2% 19.4% 1.1% 84.3 71.9
Washington Nationals 71 91 23 .438 0.2% 3.3% 3.5% 0.0% 77.5 65.2
Miami Marlins 67 95 27 .414 0.0% 0.6% 0.6% 0.0% 73.0 61.0

The Phillies have seen their projections sink a bit after losing four of five games to the Rockies and Giants, but the Acuña injury is a disaster for the Braves. ZiPS sees Philadelphia and Atlanta as basically equals now, but with a five-game lead, attrition benefits Philadelphia, not Atlanta. The Mets remain as mediocre as their preseason projections said, but the Acuña injury let them claw back almost a full percentage point of divisional probability over the last week, despite their dreadful recent stretch. The Nats have played much better than their expected doormat status, but they’re not certainly not inside the house yet, and ZiPS sees their relevance on the edge of the wild card race slipping away. The Marlins’ 6-24 start to the season all but officially eliminated them from the divisional race, but after playing roughly .500 ball this month, it’s at least plausible, though incredibly unlikely, that they could make a run for the third wild card spot.

ZiPS Projected Standings – NL Central (5/29)
Team W L GB Pct Div% WC% Playoff% WS Win% 80th 20th
Milwaukee Brewers 84 78 .519 36.8% 17.0% 53.8% 2.3% 90.4 78.3
Chicago Cubs 83 79 1 .512 29.0% 16.9% 45.9% 2.6% 89.1 77.0
St. Louis Cardinals 81 81 3 .500 19.2% 15.1% 34.3% 1.6% 87.1 75.0
Cincinnati Reds 78 84 6 .481 10.0% 10.3% 20.3% 0.9% 84.1 71.7
Pittsburgh Pirates 75 87 9 .463 5.0% 6.2% 11.3% 0.3% 81.4 69.5

Jackson Chourio has struggled, but Milwaukee has received solid offense contributions from almost every other position. Who had Joey Ortiz likely finishing 2024 with more WAR than Jackson Holliday? I can’t say ZiPS or I did, either. (Well, unless I lie.) ZiPS doesn’t expect Robert Gasser to maintain that microscopic ERA, but it does think he’ll get a pretty good jump from what is now a surprisingly low strikeout rate. Right now, the Brewers are the slight favorite to win the Central, but every team in the division still maintains more than a scrap of a chance. I personally think the Cubs will be the most aggressive at the deadline, but that’s a little out of ZiPS’s wheelhouse.

ZiPS Projected Standings – NL West (5/29)
Team W L GB Pct Div% WC% Playoff% WS Win% 80th 20th
Los Angeles Dodgers 95 67 .586 73.1% 21.3% 94.4% 16.1% 101.4 89.4
San Diego Padres 85 77 10 .525 11.6% 43.4% 55.0% 3.8% 91.2 79.1
San Francisco Giants 84 78 11 .519 9.6% 40.0% 49.6% 2.9% 90.3 78.0
Arizona Diamondbacks 82 80 13 .506 5.8% 33.1% 38.9% 2.6% 88.3 76.2
Colorado Rockies 64 98 31 .395 0.0% 0.1% 0.1% 0.0% 70.2 58.7

There were scenarios in which the Dodgers were topped in the NL West, but it doesn’t look like any of them are coming to pass. Outside of Bobby Miller’s shoulder injury, the rotation has held together quite well, and we’re getting closer to Clayton Kershaw’s possible return. The Padres and Giants have seen their divisional odds get longer since March, but their win projections remain about where they were initially expected, and both teams are serious wild card contenders. The 50th-percentile win projection for the last NL wild card berth is 85.4, a number well within the realm of possibility for both teams. So could the Diamondbacks, but their odds of getting there are a little less likely because, as of now, they’re three games behind San Diego and San Francisco. The Rockies are stubbornly hanging onto that last decimal point, though ZiPS think they’re the worst team in the National League.

ZiPS Projected Standings – AL East (5/29)
Team W L GB Pct Div% WC% Playoff% WS Win% 80th 20th
Baltimore Orioles 95 67 .586 47.7% 43.8% 91.5% 12.0% 101.4 89.1
New York Yankees 95 67 .586 47.2% 44.2% 91.4% 10.3% 101.4 89.2
Toronto Blue Jays 83 79 12 .512 3.0% 29.7% 32.7% 2.1% 88.6 76.5
Tampa Bay Rays 79 83 16 .488 1.2% 16.7% 17.9% 0.7% 85.3 73.3
Boston Red Sox 79 83 16 .488 0.9% 15.2% 16.1% 0.4% 84.9 72.7

Contrary to the preseason, the playoff picture in the AL East has cleared up considerably in two months. What was projected to possibly be a race between all five clubs, with even the Red Sox having a decent shot, has largely become a two-team competition between the Orioles and Yankees. ZiPS likes the Yankees slightly better in an “everybody stays healthy” projection, but with the injury risks all built in, ZiPS gives the Orioles the subtle nod due to their superior depth. ZiPS still believes the Blue Jays could contend for a wild card spot, because the offense can’t be this mediocre moving forward, but after struggling for two months, Toronto has basically been lapped by Baltimore and New York. ZiPS remains skeptical that the Red Sox will keep up their current win pace (at least their Pythagorean one), but the system thinks the rotation’s success is legitimate. It’s weird seeing the Rays with the worst bullpen WAR in baseball; I almost typed the Devil Rays when looking at that chart.

ZiPS Projected Standings – AL Central (5/29)
Team W L GB Pct Div% WC% Playoff% WS Win% 80th 20th
Cleveland Guardians 93 69 .574 58.7% 27.7% 86.3% 7.9% 99.2 87.1
Minnesota Twins 88 74 5 .543 22.8% 38.6% 61.4% 4.8% 93.8 81.4
Kansas City Royals 86 76 7 .531 15.7% 37.1% 52.8% 2.1% 92.0 80.1
Detroit Tigers 80 82 13 .494 2.9% 14.6% 17.4% 0.6% 85.2 73.1
Chicago White Sox 56 106 37 .346 0.0% 0.0% 0.0% 0.0% 62.1 50.1

ZiPS was the Cleveland believer of the projection systems coming into the season, but not even it could’ve expected the Guardians to win two-thirds of their games. I’m not going get mad at my computer for not realizing that David Fry would play like the second coming of Ted Williams. But if the Guardians are bound for some regression, the AL Central is not exactly full of teams that could overrun them. ZiPS remains extremely skeptical of the Royals, but they’ve banked enough wins that they’re not going to disappear from the race anytime soon. The computer now thinks the AL Central will have 1.2 wild card spots (on average), a big jump from 0.5. After an abomination of a start to the season, the White Sox have played just well enough that they still have a 20% chance of avoiding 100 losses. That’s something, I guess.

ZiPS Projected Standings – AL West (5/29)
Team W L GB Pct Div% WC% Playoff% WS Win% 80th 20th
Seattle Mariners 85 77 .525 48.6% 10.3% 58.9% 3.8% 91.3 79.5
Texas Rangers 82 80 3 .506 27.3% 10.9% 38.2% 2.4% 88.2 76.1
Houston Astros 81 81 4 .500 21.5% 9.5% 31.0% 2.1% 87.0 74.6
Los Angeles Angels 72 90 13 .444 2.4% 1.6% 4.0% 0.1% 78.1 65.9
Oakland A’s 65 97 20 .401 0.1% 0.1% 0.2% 0.0% 70.5 58.5

The Astros must play under a fortunate star because this has to be their best-case scenario considering their abysmal start to the season. With the Rangers treading water and playing some lousy baseball of late, the Mariners doing the usual Mariners .540 thing, and the Angels looking like a lost cause, nobody ran away with the division while the Astros sputtered. The Logan Roy of the AL West, Houston’s future may have some serious questions, but the team has weathered what was likely its worst stretch of pitcher injuries. The lack of a frontrunner in the West has kept Oakland theoretically in the mix, but the team lacks depth to remain single-digit games back from first place for much longer, and its owner is probably far too apathetic about his club’s short-term fate to make any big additions at the deadline. At least Mason Miller is a lot of fun.

As usual, I’m including the ZiPS playoff matrix, which shows the percentile results for the win total of each playoff spot’s eventual victor. For example, while the Orioles and Yankees are both projected to win 95 games, ZiPS projects that the average eventual result for the team that wins the AL East will be 99.3 wins.

ZiPS Playoff Matrix (5/29)
To Win 10th 20th 30th 40th 50th 60th 70th 80th 90th
AL East 92.3 94.6 96.4 97.9 99.3 100.8 102.4 104.2 106.7
AL Central 89.0 91.3 92.8 94.3 95.6 97.0 98.5 100.3 102.8
AL West 82.6 84.7 86.3 87.7 89.0 90.3 91.8 93.4 95.8
To Win 10th 20th 30th 40th 50th 60th 70th 80th 90th
AL Wild Card 1 88.8 90.4 91.6 92.6 93.6 94.7 95.9 97.3 99.4
AL Wild Card 2 85.5 86.8 87.8 88.7 89.5 90.3 91.2 92.3 93.8
AL Wild Card 3 83.1 84.3 85.2 86.1 86.8 87.6 88.4 89.3 90.7
To Win 10th 20th 30th 40th 50th 60th 70th 80th 90th
NL East 89.4 91.9 93.7 95.3 96.8 98.3 99.9 101.7 104.3
NL Central 83.4 85.4 86.9 88.2 89.4 90.6 92.0 93.5 95.8
NL West 89.6 91.9 93.5 95.1 96.5 98.0 99.7 101.6 104.4
To Win 10th 20th 30th 40th 50th 60th 70th 80th 90th
NL Wild Card 1 87.1 88.6 89.8 90.8 91.8 92.8 93.9 95.2 97.2
NL Wild Card 2 84.0 85.3 86.3 87.2 88.0 88.8 89.7 90.7 92.2
NL Wild Card 3 81.7 82.9 83.9 84.7 85.4 86.1 87.0 87.9 89.2

In order to not have to reference the preseason projections, I’m also including a sortable table of how the playoff/divisional/World Series probabilities have changed since the preseason projections.

ZiPS Preseason vs. 5/29
Team Div% Pre Diff Playoff% Pre Diff WS Win% Pre Diff
Philadelphia Phillies 64.6% 17.9% 46.7% 93.1% 51.2% 41.9% 9.2% 3.7% 5.5%
Kansas City Royals 15.7% 5.9% 9.8% 52.8% 12.5% 40.3% 2.1% 0.2% 1.9%
New York Yankees 47.2% 24.1% 23.1% 91.4% 59.3% 32.1% 10.3% 5.2% 5.1%
Cleveland Guardians 58.7% 38.4% 20.3% 86.3% 55.1% 31.2% 7.9% 3.9% 4.0%
Milwaukee Brewers 36.8% 14.7% 22.1% 53.8% 27.3% 26.5% 2.3% 1.0% 1.3%
Baltimore Orioles 47.7% 37.2% 10.5% 91.5% 72.1% 19.4% 12.0% 8.8% 3.2%
Los Angeles Dodgers 73.1% 49.3% 23.8% 94.4% 79.0% 15.4% 16.1% 11.9% 4.2%
San Diego Padres 11.6% 12.7% -1.1% 55.0% 41.2% 13.8% 3.8% 2.3% 1.5%
Seattle Mariners 48.6% 27.4% 21.2% 58.9% 54.7% 4.2% 3.8% 4.3% -0.5%
Minnesota Twins 22.8% 41.8% -19.0% 61.4% 57.5% 3.9% 4.8% 4.5% 0.3%
Chicago Cubs 29.0% 27.9% 1.1% 45.9% 43.5% 2.4% 2.6% 2.5% 0.1%
Washington Nationals 0.2% 0.3% -0.1% 3.5% 2.3% 1.2% 0.0% 0.0% 0.0%
San Francisco Giants 9.6% 17.2% -7.6% 49.6% 49.4% 0.2% 2.9% 3.4% -0.5%
Oakland A’s 0.1% 0.2% -0.1% 0.2% 1.1% -0.9% 0.0% 0.0% 0.0%
Chicago White Sox 0.0% 0.6% -0.6% 0.0% 1.5% -1.5% 0.0% 0.0% 0.0%
Colorado Rockies 0.0% 0.2% -0.2% 0.1% 2.1% -2.0% 0.0% 0.0% 0.0%
Atlanta Braves 33.1% 62.6% -29.5% 79.9% 84.0% -4.1% 7.2% 15.2% -8.0%
Boston Red Sox 0.9% 4.4% -3.5% 16.1% 22.0% -5.9% 0.4% 0.7% -0.3%
Pittsburgh Pirates 5.0% 8.9% -3.9% 11.3% 17.9% -6.6% 0.3% 0.5% -0.2%
Detroit Tigers 2.9% 13.2% -10.3% 17.4% 24.8% -7.4% 0.6% 0.8% -0.2%
St. Louis Cardinals 19.2% 27.8% -8.6% 34.3% 43.8% -9.5% 1.6% 2.6% -1.0%
Cincinnati Reds 10.0% 20.8% -10.8% 20.3% 35.1% -14.8% 0.9% 1.6% -0.7%
Arizona Diamondbacks 5.8% 20.5% -14.7% 38.9% 55.5% -16.6% 2.6% 4.4% -1.8%
Texas Rangers 27.3% 28.4% -1.1% 38.2% 55.5% -17.3% 2.4% 4.5% -2.1%
Los Angeles Angels 2.4% 6.9% -4.5% 4.0% 21.6% -17.6% 0.1% 0.7% -0.6%
New York Mets 2.1% 12.9% -10.8% 19.4% 41.1% -21.7% 1.1% 2.3% -1.2%
Tampa Bay Rays 1.2% 11.9% -10.7% 17.9% 41.1% -23.2% 0.7% 2.3% -1.6%
Toronto Blue Jays 3.0% 22.4% -19.4% 32.7% 58.3% -25.6% 2.1% 5.0% -2.9%
Miami Marlins 0.0% 6.3% -6.3% 0.6% 26.6% -26.0% 0.0% 2.3% -2.3%
Houston Astros 21.5% 37.0% -15.5% 31.0% 63.2% -32.2% 2.1% 6.3% -4.2%