Free agency has been ongoing for two weeks now, but for the most part, the big dominoes are yet to fall. While teams certainly have their sights set on the likes of Shohei Ohtani and Cody Bellinger, the early offseason has been defined by smaller moves and signings made around the non-tender and Rule 5 protection deadlines.
The players being exchanged aren’t the most notable members of their respective rosters, yet they’ll still impact the quality of their teams in the upcoming season. We’ll be knocking out many of the more intriguing pitchers who have changed hands in this two-part series. Read the rest of this entry »
You’ve already heard it from me. You’ve already heard it from a lot of people. You’re going to keep hearing it all offseason. This is a tough year for teams that want to add offensive firepower in free agency. Unless you’re really into Cody Bellinger or Matt Chapman, it’s Shohei Ohtani or bust, and according to my math, there are 30 teams and only one Ohtani.
That’s a bleak reality, but it paints with too broad of a brush. That description makes it sound like every team who needs a hitter to play anywhere is in equally dire straits. That’s not true, though. If you’re looking for a third baseman or a righty power bat with questionable defensive value, you have options. If you want to sign an intriguing young corner outfielder who might pay dividends a few years down the road, Jung-hoo Lee is a solid choice. But if you’re looking for a catcher – sorry, pal, nothing to see here.
Every year is a bad year for free agent catchers. In the last five years, three catchers have hit the open market after a 3-plus WAR season or its 2020 equivalent: J.T. Realmuto, James McCann, and Willson Contreras. Realmuto was a perennial All-Star when he re-upped with the Phillies, and Contreras has been a valuable offensive contributor for quite some time, but McCann only barely qualifies; he put together a nice season over 111 plate appearances in 2020. If you’re looking for a star catcher, free agency is the wrong place to set your sights. Read the rest of this entry »
My September 10 Sunday Notes column included Chris Antonetti addressing his team’s 2023 offensive struggles. According to Cleveland’s President of Baseball Operations, “The problem isn’t power, the problem is that we need to score more runs.” While I don’t necessarily disagree with the exec’s opinion, it is nonetheless true that the Guardians hit the fewest home runs of any team and finished fourth from the bottom in runs scored. Moreover, they finished 76-86 after going 92-70 in 2022.
I revisited the issue, at least in part, during this month’s GM meetings. I asked Antonetti’s second in command, Mike Chernoff, if the club needs to reassess some of its philosophies going forward.
“If you rewind the clock one year, we felt like we massively outperformed industry expectations,” Cleveland’s General Manager told me “We won 92 games with the youngest team in baseball. This year, we again had the youngest team in baseball. We hit a few unfortunate and untimely injuries with some of our starting pitching, but at the same time we transitioned three young starters in [Gavin] Williams, [Tanner] Bibee, and [Logan] Allen to the major-league team. We just didn’t perform as well offensively. So we don’t feel like wholesale changes are necessary. We feel like we have a really strong foundation off of which to continue building, but we also don’t have a lot of room for error as a small-market team.”
Industry expectations are one thing, in-house projection systems are another. With that in mind, I asked Chernoff if the 2022 Guardians outperformed their own projections, and if the 2023 club underperformed them. Read the rest of this entry »
Late Thursday night, after the final horn had sounded on the last West Coast NHL game, new White Sox general manager Chris Getz consummated his first trade in his new role, sending sinker-balling lefty reliever Aaron Bummer to Atlanta for a five-player variety pack of “second division” players and reclamation projects. The new White Sox are headlined by 26-year-old 2019 All-Star righty Michael Soroka, 28-year-old infielder Nicky Lopez, and 25-year-old lefty starter Jared Shuster, all of whom can be reasonably expected to impact the 2024 squad. Chicago also acquired 25-year-old infielder Braden Shewmake, who is also on the 40-man roster, and 2023 undrafted free agent starter Riley Gowens, who is more of a developmental project from the University of Illinois. Read the rest of this entry »
In the offseason, there’s no live major league baseball to watch. I’m a lazy consumer, so I don’t watch much LIDOM action; I catch bits and pieces here and there, but for the most part, the winter is when I recharge my baseball batteries and do a little film study.
I can hear what you’re saying: film study? I don’t play, and I don’t coach. I can’t develop some secret sauce that will help me win next year by grinding in the film room in December. For me, though, it’s just fun. Other than the fact that I’m nothing like Roger Federer, I completely identify with what he said about studying tape: “I used to do a lot of video analysis early on, but more for pleasure and looking at my own technique.”
Fine, I’m not watching my own technique, but I do like rewatching games from this year for my own enjoyment. I’m not so much trying to fix something for 2024 as trying to look back at 2023 and smile. Oh, you’d like an example? I’m glad you asked. Here’s the video I’ve been watching most recently: three delightfully ridiculous umpiring calls. Read the rest of this entry »
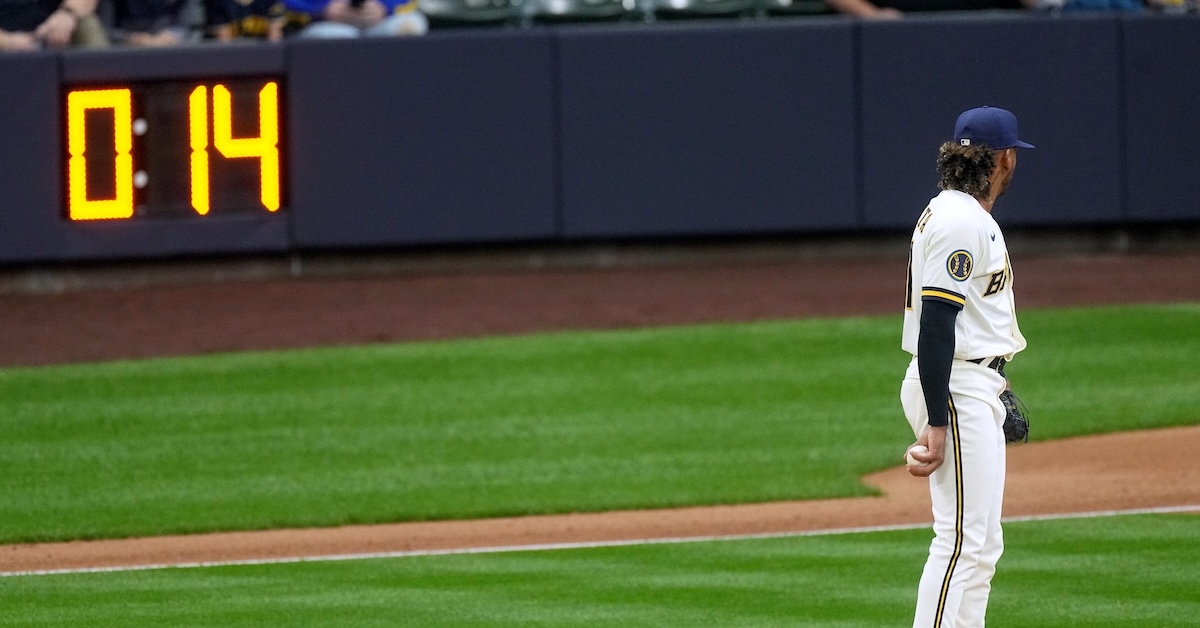
On Wednesday, the estimable and exquisitely coiffed Jeff Passan reported that MLB is considering a small change to the pitch clock for 2024. In its first year, the pitch clock counted down from 20 seconds with runners on base; MLB wants to bring that number down to 18 seconds. The proposal also includes a reduction in mound visits from five per team to four. MLB’s competition committee will deliberate over these proposals and then — considering more than half of the body is appointed by the league — most likely rubber-stamp them.
As for the headline change? It’s two seconds. It’s nothing. Two Mississippi. The Astros’ pitching staff alone has two Mississippi guys. (Okay, two Mississippi State guys.) MLB has already made the single biggest change it’s ever going to make to the timing of the game by instituting the pitch clock in the first place. How much can two seconds possibly matter? Read the rest of this entry »
This week’s 40-man roster deadline was less eventful than usual (we only had one trade on deadline day), but as always, a number of young players became big leaguers in a certain sense, and teams had no choice but to indicate what they think of lots of fringe prospects who they either did or did not choose to roster. This day of clerical activity is the culmination of the efforts of the players themselves, the people in player development who have helped turn them into big leaguers, and the scouting and decision-making portions of each org that put their stamp of approval on the prospects. Is any one move here as impactful as signing a Yoshinobu Yamamoto or a Matt Chapman? No, but when your favorite team experiences a rash of injuries in June, whether or not they have the depth to scrap and compete is often dictated by the people and processes that surround this day. I’m more focused on analyzing roster depth, fit and flexibility in this space than on scouting players (especially when they’re star prospects you already know well). I’ll have a separate post on the National League. Read the rest of this entry »
Maybe you’ve heard, but the Diamondbacks bunted a lot this postseason. I’m underselling it, of course — you definitely heard it. Maybe you saw Michael Baumann’s blow-by-blow recap of all the bunts. Maybe you read about Evan Longoria’s freelancing. Maybe you read Patrick Dubuque’s breakdown of teams trying to copy Arizona. Just yesterday, Russell Carleton actually went through all the math of which bunts are getting more popular league-wide in a typically excellent article. Maybe you read any of the countlessothertakes on it. But I have a different view. I think the Diamondbacks are being misrepresented. I think that it was more a case of a few opportunistic bunters than a team policy, and that their bunts didn’t alter the course of their offensive destiny much at all.
You’ve surely heard, in all that recounting, that the Diamondbacks led the majors in sacrifice bunts this year. It’s true! They also bunted a lot – either 68 or 69 times, depending on which bunt classification database you want to use. Corbin Carroll and Geraldo Perdomo combined to bunt 36 times this regular season. Perdomo was second in the majors in bunt attempts; Carroll was in the top 15. Read the rest of this entry »
Brooks Raley has been an effective reliever since returning to MLB in 2020 after five seasons as a starter with the KBO’s Lotte Giants. He’s been especially good for the past two. Taking the mound for the Tampa Bay Rays in 2021 and for the New York Mets this past season, the 35-year-old left-hander has logged a combined 2.74 ERA and a 3.21 FIP over 126 relief appearances. Moreover, he’s allowed just 81 hits and fanned 122 batters in 108.1 innings. Working primarily in a setup role, he’s been credited with a pair of wins and nine saves.
Raley is also a bona fide pitching nerd. That wasn’t the case when he got cups of coffee with the Chicago Cubs in 2012 and ’13, but then came a career-altering adoption of analytics when he was overseas. Looking to optimize his talents, the Texas A&M University product schooled himself on how his pitches played best, and what he could add, subtract or tweak in order to attack hitters more effectively. The result was a successful return to the big leagues, and not only has he put up a good FIP and a solid SIERA, but he also knows exactly what those acronyms mean.
Raley discussed his analytics-influenced evolution as a pitcher when the Mets visited Fenway Park this summer.
———
David Laurila: You played five years in Korea. What was that experience like?
Brooks Raley: “I loved it. I learned a lot. We’re talking analytics, and I went over there not very polished. I was a starter but didn’t have a changeup or a cutter, so I started watching YouTube videos of all the different shapes, spin rates, tilts, extension — all that stuff. For a little bit, I tried to throw like Chris Sale. I kind of leaned over and tried to create some different angles and see what kind of shapes I could get. I really got into that side of the sport. I found my cutter, found my arm slot, and then the sinker got better. My slider also got better. That all happened when I was in Korea. It’s how I got back [to MLB].”
Laurila: Why hadn’t you gotten into analytics and begun making changes prior to going to the KBO?
Raley: “I wouldn’t change anything about my career, but coming across analytics and what defines your strengths better… when I was coming through the minors, it was ‘sinkers down and away are safe’ and ‘ground balls over strikeouts.’ But I actually and naturally pitch better inside. That’s to both sides. To righties, I throw the cutter and the slider and have the changeup and sinker to keep them honest. To lefties, I’ve got the running sinker. It’s been inconsistent this year, I can’t really figure that out, but it’s been between 14 to 19 horizontal and probably anywhere from eight to two vertical. It’s kind of a unique pitch because it spins 2,400 [RPMs] or so. It’s got some life and late dart to it.
“I always struggled with changeups before I went over there, because I’d always try to throw the 10 miles an hour off [from the fastball]. Now I throw a Viulcan change, so I don’t really kill spin but I put it on the horizontal axis. I get around 19 and I’m either on the line or under the line. Basically, I found some unique shapes to really broaden my left and right, because I can throw a slider at 22 inches of horizontal and a changeup at 20 [in the opposite direction].” Read the rest of this entry »
Earlier today, the Philadelphia Phillies and Milwaukee Brewers made a swap ahead of this year’s 40-man roster deadline, the last day teams have to either add eligible minor league players to their 40-man roster or expose them to December’s Rule 5 Draft. In this trade, the Brewers acquired 26-year-old second baseman Oliver Dunn and added him to their 40-man roster, while the Phillies received two prospects in return, 21-year-old infielder Robert Moore and 20-year-old outfielder Hendry Mendez.
Let’s start with Milwaukee’s end of this, as we’re most likely to see 2024 big league impact from Dunn, who is coming off an Arizona Fall League stint in which he won the league’s Breakout Prospect award. Dunn, whose brother Ross is in the Twins system, was a Yankees 2019 11th round pick out of Utah. He hit .196 coming out of the lost 2020 season, and spent a significant portion of both 2021 and 2022 on the IL dealing with multiple injuries, including a fractured jaw, an abdomen strain, and a hamstring strain.
The Phillies drafted him in the minor league phase of the 2022 Rule 5 Draft and Dunn had a huge power breakout in 2023 at Double-A Reading, where he hit .271/.396/.506 and slugged 21 homers, more than he had hit throughout his entire career entering 2023. Reading is a hitter’s haven and Dunn was in his age-25 season, so there are good reasons to be skeptical of his sudden change in output, but his underlying power metrics also took a leap, with his average and peak exit velocities (92 mph and 112 mph, respectively) cresting above the big league average. This isn’t gigantic, impact power, but it’s meaningful pop for a second baseman. Dunn swings and misses quite a bit, especially within the strike zone (you can see him struggling with velo up and away from him, a Fall League theme for Dunn, in the video below), but he’s a dangerous all-fields hitter because of his power and ability to catch some fastballs deep in the hitting zone and punish them the other way. Read the rest of this entry »