In a race for a playoff spot, every edge matters. Yet all too often, for reasons that extend beyond a player’s statistics, managers and general managers fail to make the moves that could improve their teams, allowing meager production to fester at the risk of smothering a club’s postseason hopes. In Baseball Prospectus’ 2007 book, It Ain’t Over ‘Til It’s Over, I compiled a historical All-Star squad of ignominy, identifying players at each position whose performances had dragged their teams down in tight races: the Replacement-Level Killers. I’ve revisited the concept numerous times at multiple outlets and have adapted it at FanGraphs in an expanded format since 2018.
When it comes to defining replacement-level play, we needn’t hew too closely to exactitude. Any team that’s gotten less than 0.6 WAR from a position to this point — prorating to 1.0 over a full season — is generally in the ballpark, though my final lists also incorporate our Depth Charts rest-of-season projections, which may nose them over the line. Sometimes, acceptable or even above-average defense (which may depend upon which metric one uses) coupled with total ineptitude on offense is enough to flag a team. Sometimes a club may be well ahead of replacement level but has lost a key contributor to injury; sometimes the reverse is true, but the team hasn’t yet climbed above that first-cut threshold. As with Supreme Court Justice Potter Stewart’s definition of hardcore pornography, I know replacement level when I see it. Read the rest of this entry »
Break out your biggest, dumbest hats, friends. It’s time for the Derby. The 2026 Home Run Derby is at 8:00 PM Eastern tonight at Citizens Bank Park in Philadelphia. It will be streaming on Netflix, which means that in just a few hours, my parents (and probably your parents too) will discover that they have no way of watching it. If the streaming service’s official trailer for the event is any indicator, the action will be pixelated electric. There’s no Statcast broadcast this year, but the Derby will apparently be a crossover event with Hot Ones, the show where celebrities answer questions while eating chicken wings. If you tune in too late for the dingers, you can console yourself by watching Will Ferrell get very sweaty.
Every year’s preview contains a section in which we bemoan the absence of some of the game’s biggest stars, and though it would be great to see Shohei Ohtani, Aaron Judge, or Yordan Alvarez, we honestly can’t complain about this field at all. It’s fantastic. It’s got three of the top four home run hitters this season, and six of the top 20. It’s got hometown favorites. It’s got one surefire Hall of Famer. It’s got a mix of first-timers and previous winners and runners-up. It’s got a mix of young players and established stars. It’s got participants from four countries. Most of all, it’s filled from top to bottom with jaw-dropping, light-tower, into-the-next-county power.
Every single participant has plus bat speed and a huge hard-hit rate. We don’t have any filler. Nobody feels like a last-minute replacement, and nobody made it just because of a fluky first half or because they can combine average power with a high pulled-fly ball rate. Every single participant can mash, and none of them would be a surprise winner. Moreover, although practitioners of this brutalist version of baseball can sometimes struggle toward the end of the competition, when they’re tuckered out from all those daddy hacks, that may be less of an issue thanks to this year’s new format, which we’ll get to in a moment.
The ballpark should also help. Citizens Bank Park is a notoriously cozy venue that enables home run hitting. Statcast’s park factors rate it the fifth-friendliest home run park in baseball. However, that number isn’t exactly balanced. It plays roughly average for righties, while for lefties, it’s second only to Coors Field. The five lefties in the field should have the advantage.
The Rules
This year’s format change is drastic. After using a timer-based system since 2015, the league is going to a swing-based format. That’s actually different from the pre-timer format. In the past, players got a certain number of outs, which is to say non-homers, in each round. This year, it’s about swings. Each player gets 20 swings in the first round, and 15 in the second round and the final. However, the last swing of each round works like the old out system. You can’t end a round on a home run, so as long as you keep hitting homers, the round can go all night long.
This is a clever wrinkle, because it means that no matter how far behind he is, each player technically has a chance until he makes that final out. No longer will we watch players fall behind and know that, even with two minutes still on the clock, all their efforts will be futile. It’s also an annoying wrinkle, though, because that final ball has officially been branded the “T-Mobile Magenta Ball.” I’m not sure the enjoyment derived from giggling about the fact that this sounds like an embarrassing medical affliction will be worth the stultifying quantity of cellphone advertising that’s about to slam into our skulls.
As in the two previous Derbies, the first round will function as pool play. The four hitters with the most homers in the first round will enter a bracket, seeded by their first-round totals. Any ties in the first round will be decided by the length of each player’s longest home run. In the semifinals and final, the tiebreaker will be a three-swing swing-off.
The format contains one more odd wrinkle. In previous years, the order of the first-round pool play was determined by how many home runs each player hit in the first half. This year, the rules say the hitters “will hit in an order determined by the Commissioner’s Office.” I have no idea what would constitute an optimized order to the commissioner. However, I’m sure that somebody out there will disapprove of that order, so I hope they appreciate the gift of having a reason to complain about Rob Manfred before the Derby even starts.
The format change involves some tradeoffs. We lose the immediacy and adrenaline rush of a ticking clock. However, we gain the ability to enjoy each home run. No longer will we need a split screen or a camera that careens wildly from the infield to the outfield in order to see where the previous ball landed without missing the current swing. The big situations will get a moment to breathe, as will the big sluggers.
The new format is also a bit more fair. In previous Derbies, the pitcher wasn’t allowed throw the next ball until the previous one landed, but some teams – I’m looking at you, 2018 Bryce Harper and 2018 Bryce Harper’s dad – simply flouted that rule and gained a huge advantage. That will be off the table. We’ll also be free of gimmicky distance-based bonus rounds. Another effect of the new format is that a bad pitcher might be less of a handicap. Without a time limit, there’s no downside to taking a couple extra pitches and offering only at the tenderest of meatballs.
As for why the league changed the format again, why it’s constantly changing the format, I can’t really tell you. I’m excited about this new version. I think it’ll be more watchable than the timed version. But honestly, whatever problem the league has with the Home Run Derby, I think the format is rarely the culprit. The Derby always starts to drag halfway through because it runs for three hours, and that’s simply too long. Even the best, most exciting Derby is not a Christopher Nolan movie. It’s a one-note symphony, a fireworks display, and fireworks displays rarely last more than half an hour because eventually all those bangs and zooms start to blend together and get monotonous.
In order to stretch a Home Run Derby out for three hours, you need a bracket, multiple rounds, rest periods, convoluted bonus systems, indecipherable graphics, interviews with celebrities you wish you’d never heard of, and a full hour of commercials. You spend the whole time waiting for the good part, and because the contestants get physically tired, the good part can sometimes be a letdown. If the goal is to make the Home Run Derby as exciting as it can be, then the solution is to bring it down to a brisk 90 minutes. That probably won’t happen, because it means less advertising money, but changing the format is never going to solve that particular problem.
Alright, you’ve waited long enough. Let’s get to the large home-run-hitting men!
No matter what criteria you’re using to assess the Derby participants, Schwarber has to be a favorite. He’ll be in front of a raucous home crowd, and he has a history of showing up in big moments. At 33, he’s on the best two-year stretch of his entire career. He leads baseball with 32 home runs. As a matter of fact, since his debut in 2015, his 372 homers are second only to Aaron Judge’s 385 (and as Judge will be on the IL for at least another month, probably longer, Schwarber may just pass him). Schwarber has Derby experience, finishing second behind Harper in 2018 and going out in the first round in 2022. Maybe even more relevant considering this year’s format, he absolutely blew the roof off last year’s All-Star Game by laying waste to the swing-off.
Schwarber’s average launch angle of 21.8 degrees is the highest of the field by a mile and the sixth-highest among all qualified players. His 19.3% barrel rate ranks second in the field and fifth in baseball. Not only does it help that he is a lefty at Citizens Bank, but he is a pull machine. His average attack direction – the horizontal angle of his bat at the moment of impact – is 10 degrees toward the pull side, one of the most extreme marks in the game, and 16.9% of his batted balls are pulled fly balls, the highest mark in the group by a lot. At 25%, Schwarber also has the third-lowest chase rate in the field, and as players can take pitches to their hearts’ content waiting for the right one, that could end up being a difference-maker. But these are just numbers, and the argument for Schwarber is more visceral than that.
Ben Rice
Ben Rice debuted in 2024, and he’s done nothing but crush dingers ever since. He hit 26 last year, and he already has 29 this year. That’s the third most in baseball and the second most among Derby contestants. Still, if there is an underdog in this group, it’s probably Rice. The Big Grain (as everyone will soon by calling him) has the slowest bat speed of the field by quite a bit. He just doesn’t have the top-end power of the rest of the field. His average home run is the shortest of the bunch, and he’s benefited from Yankee Stadium’s shorter right-field dimensions. However, you know who had the shortest average homer in last year’s Derby? Winner Cal Raleigh. Additionally, as a lefty in Citizens Bank Park, Rice will have a similar advantage to the one he has at Yankee Stadium, and despite his relative shortcomings, he’s certainly not a weakling.
Rice ranks third among the group in barrel rate and home runs per fly ball. He leads all of baseball with a .320 isolated slugging percentage. He’s also coming into the Derby on a tear. Over his final 12 games of the first half, Rice batted .349 with a 259 wRC+ and seven home runs.
My biggest concern is that Rice is having his dad pitch to him. Now, Rice’s dad did pitch in college and has been throwing him BP for his entire life, and Rice also has the second-lowest chase rate of the field, but still, I think I’d rather have Dino Ebel.
Junior Caminero
If you’re simply looking for the most powerful player in the Derby, Caminero is your guy. His 28 home runs rank fourth in the majors. He has the fastest bat speed and the longest swing of any qualified player. He leads the Derby Field in 90th-percentile exit velocity, max exit velocity, fast-swing rate, and blast rate. The one thing he struggles at is getting the ball in the air. With a swing path tilt of just 24 degrees and an attack angle of just eight degrees, Caminero possesses one of the flattest swings in all of baseball. He’s got the second-lowest fly ball rate of the group, and his average fly ball travels the shortest. Hard-hit line drives are fantastic in baseball, but they can be killers in the Derby.
Still, Caminero has to be a favorite. He finished second in last year’s Derby, and the fact that he’s back certainly indicates that he’s in it to win it. He’s running it back with Rays major league field coordinator Tomas Francisco pitching to him again. Moreover, Caminero can hit absolutely anything out of the park. Here’s a side-by-side pitch chart of the home runs Caminero and Caglianone have hit. Caglianone has a sweet spot. He needs the ball middle up. But Caminero doesn’t care at all where you throw the ball.
Of course, this effect might matter just a little bit less in an untimed Derby, because batters can take as many pitches as they’d like, waiting for one that’s right in their sweet spot. But nobody’s perfect at this. Every pitch looks juicy in the Derby. And for Caminero, every pitch really will be.
Caminero is also coming into the Derby red-hot. Over his last 19 games, he’s batting .292 with a 227 wRC+, an .861 slugging percentage, and 13 home runs. Yeah, 13 homers in 19 games is pretty good.
Jordan Walker
The argument for Walker is the same as the argument for last year’s winner, Cal Raleigh: This is just his year. After big prospect hype and even bigger struggles in his first few seasons in the majors, Walker is finally putting it all together. He’s coming into the break with a 143 wRC+ and 22 home runs. He’s finally figured out how to lift the ball enough to take advantage all the power his 6-foot-6 frame can generate. Walker ranks second in the field in a bunch of big categories: bat speed, average exit velocity, 90th-percentile exit velocity, max exit velocity, and fast-swing rate. He’s also yet another participant coming into the Derby on a tear. Over his last 12 games, he’s running a 208 wRC+ with four homers and a .707 slugging percentage. He’s got his normal BP pitcher, St. Louis bullpen catcher Kleininger Teran, throwing to him. However, Walker’s launch angle is still the question.
Just 5% of Walker’s batted balls have been pulled fly balls, and even if you also add line drives in there to look for pulled-air percentage, he’s still at the bottom of the field at 15%. He just struggles to get the ball in the air, and it’s hard to win a Derby that way. But it’s not impossible. Just ask Juan Soto and Vladimir Guerrero Jr. If Walker does win it all, it will be an unforgettable laser show. Also, he has been practicing:
Munetaka Murakami
The final addition to the field was an exciting one. Murakami hit at least 28 home runs in all six of his first full NPB seasons. Injuries shortened his 2025 campaign to just 56 games, but he managed to launch an astonishing 22 dingers during that stretch. Over a 162-game season, that would be a 63-homer pace. Even though injury has shortened his 2026 campaign too, he’s still on pace for 34.
Murakami is also jumping straight off the IL and into the Derby, so don’t let his relatively low total of 20 home runs fool you. He reached that figure despite missing 35 games with a hamstring strain, and only returned to the White Sox lineup on Friday. And don’t overlook him based on the fact that his top-end power is in the middle of this particular pack. He always hits the ball hard. He leads the field in hard-hit rate, average exit velocity, barrel rate, home runs per plate appearance, and home runs per fly ball. All he does is find a way to put the ball over the wall.
Here’s an example. Home run derbies are all about pulling the ball in the air, because the wall is shortest down the line. But Murakami doesn’t care about that. He’s great at hitting home runs even to the deepest part of the ballpark. Center field is where home runs go to die, but he’s tied with Nick Kurtz for the major league lead with nine home runs to straightaway center. That’s 41% of his homers going to the deepest part of the park, the highest mark in baseball (minimum 15 straightaway fly balls). Caminero is the only other member of the field above 30%.
The two concerns about Murakami before this season were that he might not be able to handle velocity, and that he definitely couldn’t hit breaking stuff. Neither of those will matter at all here. And the swing-based format might help him most of all. Murakami has the lowest chase rate in the field, and not by a small margin. He’s great at waiting for his pitch. He is made for home run derbies, and maybe for this format in particular.
Willson Contreras
I don’t really have a way to look this up, but I suspect Contreras is the first player ever to participate in the Derby in the middle of a suspension. He’s currently four games into a five-game suspension for his role in a June 30 benches-clearing brawl. For a few reasons – he was responding to racially inflammatory language, he was not in the best place emotionally due to the devastation in his home of Venezuela – Contreras came off as at least something of a sympathetic figure, even though he removed his helmet and threw it in the melee with the same motion as a Tim Tebow jump-pass. I’m about as pacifist as they come, but even I must admit there’s something poetic about watching a man use a piece of protective equipment as a weapon. Sure, you can beat your swords into plowshares, but that doesn’t have to stop you from launching those plowshares right at somebody’s noggin, now does it?
At 419 feet, Contreras has the longest average home run of anybody in the Derby. Wait, sorry, that’s his brother William Contreras. It’s a talented family is all I’m saying. In fact, Willson actually asked his brother to pitch to him in the Derby, which would have been so much fun. Unfortunately, William declined. Instead, Boston’s interim bench coach José David Flores will be stepping in. It won’t be as fun a story, but it’s definitely a wiser choice, as Flores throws BP to Contreras all the time.
Contreras possesses the game’s third-highest pull rate at 54.7%. The lack of red cells in the table above may make him look like something of an underdog, but I actually think he’s an interesting dark horse candidate. Being right-handed doesn’t help, and he’s definitely not the most powerful swinger of the bunch, but he doesn’t have any blue cells either. He’s toward the top in pull rate and pulled-fly ball rate. He also sounds genuinely excited to participate, and he has a sound strategy, telling reporters, “I think Philadelphia is a good stadium to hit. The ball carries a lot, and the key for me in the Home Run Derby is not trying to do too much or trying to hit it a long way. I already have a plan on what to do.”
Earlier, I mentioned that Caminero can hit any pitch out of the ballpark regardless of where it’s located. Contreras is similarly indiscriminate, but with regard to pitch type. Left-handed hitters Harper, Caglianone, Murakami, and Rice are fastball mashers. Each of them has hit at least 45% of his homers on four-seam fastballs. Fellow righties Caminero and Walker, along with the lefty Schwarber, are around 30%. Contreras is all the way down at 15%. This might not help him all that much when all he’s getting is batting-practice fastballs, but it does speak to an ability to send any pitch he sees over the fence.
Bryce Harper
Harper enters the fray coming off a very weird week. The announcement that he was entering the Derby came mere hours after the Philadelphia Inquirer reported that he had recorded a video message for FanDuel to a debt-ridden gambling addict who had lost $1.5 million to the company. However, the next day, Front Office Sports reported that the video had simply been ordered through Cameo, where anyone can buy a personalized video from Bryce Harper for $899. Harper definitely should have gotten suspicious when, according to FOS, the video was purchased by a FanDuel employee who also provided Harper with the script, but the story is not nearly as unsavory as it originally seemed. Why is Bryce Harper, who will make roughly $900 dollars for each 1.5 pitches thrown in a Phillies game this year, on Cameo at all? That’s a good question, but one for another day. The question for today is whether this bizarre situation will give Harper extra motivation to win back some love by mashing baseballs. God knows high-level athletes have used lesser slights to fuel themselves.
Harper is a hometown favorite and the only previous winner in the field. He also has perhaps the best pitcher in the field. Although he won the 2018 event with his father pitching to him, this time he selected Dodgers third base coach Dino Ebel. Ebel is as renowned as a BP pitcher can be, which is why he’s pitched in the Derby four times, including 2024, when he and Teoscar Hernández won the whole thing. Ebel also pitched to Schwarber during last year’s All-Star Game swing-off.
The 33 year-old Harper is running his lowest exit velocity and hard-hit rate of the decade, and at this point, his ferocious uppercut is far from the most powerful in the field. He’s got the lowest hard-hit rate, average exit velocity, barrel rate, home run per fly ball rate, and he’s second worst in bat speed, home run distance, and pulled-air rate. I don’t think anyone would be shocked to see Harper rise to the occasion and channel his precocious past, but at this point, the numbers say he probably shouldn’t be the favorite.
Jac Caglianone
At first blush, Caglianone might look like the odd man out here. He’s the low man by quite a bit in terms of home runs. His 15 homers put him a 12-way tie for 49th in baseball. His 4.3% home run rate per plate appearance is the lowest of the field. His dad is pitching to him. But Caglianone is a gargantuan slugger who was built for the Derby. He has the third-highest hard-hit rate among qualified players and the second highest in the field. He’s just one year removed from a rookie campaign in which he bashed 19 home runs over just 62 games, a 47-homer pace. And luckily, he doesn’t have to do any throwing. Perhaps you’ll recall that Statcast created a metric called blasts when they introduced bat-tracking data. The loose definition is a ball that is squared up with a bat speed above 82 mph. This season, 23.5% of his batted balls have been blasts, third highest in the field and ninth highest in baseball.
I showed you the pitch chart of Caglianone’s home runs earlier, with all of them coming belt high and up. It’s the opposite of what you’d expect from lefty sluggers, who typically drop their bat head on the ball and finish with their hands high. There’s nothing wrong with tomahawking high pitches like Caglianone does, but it tends to lead to a lot more line drives and topspin. Just 5.6% of Caglianone’s batted balls have been pulled fly balls, the second-lowest mark in the field. It also means that Caglianone needs to pick his pitches carefully, and that might be tough, as he has the highest chase rate among the eight contestants. He also has the fewest home runs per plate appearance in the group. However, on the flip side, he has the longest average homer at 414 feet. Now, some of this may come from playing at Kauffman Stadium, but it also speaks to the fact that when Caglianone gets ahold of the ball, it can go an awfully long way.
Who’s going to win?
Look, we never really know who’s going to win. We do the best we can with the information we have, but there’s so much randomness involved. That said, it’s Kyle Schwarber. After last year, I just can’t pick against Schwarber.
I had the pleasure of attending the 2026 Futures Game yesterday in Philadelphia. Good weather, a big crowd, and great rosters — this game was especially loaded with pitching, which isn’t always the case — made for a fun event.
The nature of the game makes it an imperfect place to evaluate talent. It’s a showcase environment where big tools stand out more than refined skills, and, particularly in a seven-inning game, there’s precious little time for players to show off their range of abilities. Below you’ll find thoughts and reflections on the day, which also included batting practice and pregame defensive work. Inevitably, given the volume of players, some of these write-ups are fairly short, more of a weather report than anything else. In other cases, players moved the needle for me, or at least inspired things for us to monitor over the rest of the season. If you want the full monty on these guys, all of them have full scouting reports on our team-specific lists. We’ve also opted to tuck this recap into our draft coverage navigation widget. If you missed our recap of Day 1, or any of our other coverage, be sure to check it out. Read the rest of this entry »
Tarik Skubal started a spring training game I attended back in March — I believe it was in Dunedin — and something he said following the outing caught my attention. Speaking to a small group of reporters, the Detroit Tigers southpaw said “Ding was really creative back there today. I loved the pitch mix. I felt like he was using every weapon we needed.”
I asked Skubal if he could elaborate.
“I don’t know to explain it other than the flow was great,” he replied. “Mixing spin in counts where we typically don’t throw spin, then going to back to spin to get to the changeup. I felt like he was in control today. He was pressing the right buttons and I was synced up. It’s part of the sport where things happen subconsciously.”
Ding is, of course, All-Star catcher Dillon Dingler. Four months after Skubal spoke those words, I had an opportunity to ask the backstop how he would describe creativity within the framework of game-calling — not just when the Tigers ace is on the mound, but for the staff as a whole.
“You’re not going to try to recreate the wheel,” replied Dingler, whose diligent game prep is well-chronicled. “You’re going to stick with strengths, so it’s about finding different avenues to get to those strengths. That could be spinning in certain counts, spinning early, not showing the fastball until later. Then, once they’re on the fastball you can go changeup or to something else. There are a bunch of different avenues to get to the final result. Read the rest of this entry »
Season-level baseball stats are the tried and true. They’re at the bottom of your screen every time a player steps into the box to bat or onto the mound to pitch, and they’re on the leaderboards that BBWAA members peruse when deciding whom to vote for at the end of each year. But splits are what really keep the engine going. They add context. They fill in dead air on the broadcast. They clarify trends and build narratives. When you think “splits” you probably think of platoon splits or monthly splits, all of which are great and on our Splits Leaderboards. But today I wanted to get even more granular, move off the main Splits Leaderboard page, and jump into Pitch-Type Splits.
There’s far more you’re able to do on this page than I could possibly cover in a reasonably sized post, so these highlights will just be a taste to whet your appetite. Read the rest of this entry »
I’ve been thinking a lot about the All-Star rosters this week. They’re not bad, but they’re weird, and missing many of the biggest names in the sport. That’s fine. There’s been heavy turnover atop the WAR leaderboards this year, as Ben Clemens pointed out last month, and that’s given us plenty of fresh storylines — many of which will be deservedly celebrated at the annual halftime show next week.
Still, this feels like it must matter in some way beyond an exhibition. And so I scoured the rosters, looking for a narrative to drive. One thing I noticed is, of the top 25 batters projected by FanGraphs Depth Charts, 17 did not make an All-Star team. Of those, eight are in competitive races out west.
Indeed, the stars have dimmed in the West. How these players perform after the break could determine the shape of the season still to come. Read the rest of this entry »
Dylan Cease came within three outs of making history on Wednesday. Only one Blue Jays pitcher has successfully thrown a no-hitter: Dave Stieb on September 2, 1990. Many others have come close since then, but none of them has finished the job. You can add Cease’s name to that list. He held the Giants hitless for eight innings before allowing a single to the first batter in the ninth. His final line: 8+ innings, one hit, three walks, and 11 strikeouts.
The game started off with a bang — Kazuma Okamoto’s grand slam in the top of the first inning gave the Blue Jays a 5-0 lead before Cease even took the mound. Once he did, it was evident he had his best stuff going. He retired the first 14 batters in order, at one point striking out five in a row. A walk to Willy Adames with two outs in the fifth broke up the perfect game, and then Cease issued another walk in each of the next two innings. This no-hit bid even had its signature defensive play, when Daulton Varsho tracked down a deep fly ball off the bat of Bryce Eldridge in the eighth inning, slamming into the wall in left-center field after making the catch. Ultimately, Cease’s effort fell short. Heliot Ramos saw two pitches from the right-hander in the ninth inning before lining the third up the middle for a single.
That Cease was in a position to complete the feat was a bit of a surprise in the first place. He had thrown a career-high 115 pitches through eight innings, and with teams doing everything they can to protect their pitchers these days, there were real questions about whether Cease would be allowed to pitch the ninth. After the game, Blue Jays manager John Schneiderexplained his thinking: “I’m a fan of baseball. If a guy has a chance to throw a no-hitter, you let him do it, and I think you make the adjustments after that. Dylan, he’s done it before, and he’s really durable. He’s in the category where you can be pretty aggressive with it. It’s not very often you get to see that, so if I can let a player have that opportunity, I’m going to do it every single time.”
Cease joins a long line of Blue Jays pitchers who have thrown near-no-hitters.
Roy Halladay, Dustin McGowan, Brandon Morrow, and Bowden Francis all had no-hit bids ended in the ninth inning since Stieb’s feat 36 years ago. By game score, Cease’s effort falls in the middle of the pack, less impressive because he didn’t complete nine innings, but better than Francis’ two outings two years ago. Of course, Cease already has a no-hitter to his name, throwing one in 2024 with the Padres. The Blue Jays still have the second-longest no-hitter drought in baseball, ahead of only the Guardians.
As a quick aside, a true no-hitter feels like it could become an increasingly rare feat in the near future. The last no-hitter thrown by a single pitcher was Blake Snell’s back on August 2, 2024, and there were none in 2025. Two combined no-hitters have been completed since Snell’s — one by the Cubs on September 4, 2024 and one most recently by the Astros on May 25, 2026 — but the solo effort now requires both dominance and efficiency. Ballclubs are much more wary of overworking their starting pitchers, so to complete nine innings, they need to keep their pitch counts under control to go the distance. Cease’s durability has been a hallmark throughout his career, and that made Schneider’s decision to let him keep going despite a career-high pitch count justifiable.
Cease’s dominant outing dropped his season ERA to 2.56 and FIP to 2.20, and pushed his WAR up to 3.7, a hair ahead of Cam Schlittler’s mark for the AL lead among qualified pitchers. For most of the first half of the season, the young Yankees starter has been the frontrunner to win the AL Cy Young award. With Tarik Skubal, Garrett Crochet, and Max Fried all dealing with various injuries, the field has been sapped of most of the preseason favorites.
While Schlittler still holds the advantage in the more traditional categories like wins and ERA, Cease leads the AL in strikeouts, FIP (among starters), and WAR — and that’s despite pitching two fewer games than Schlittler. A minor hamstring injury in late May sent Cease to the IL for just the second time in his major league career. Joe Ryan and Parker Messick are also making solid cases, and the traditionalists are bound to love Sonny Gray’s win count and low ERA. Still, it feels like, barring any big surprises, the Cy Young race will come down to Schlittler or Cease.
Getting a Cy Young-caliber season out of Cease immediately after signing him to a massive seven-year, $210 million contract is a triumph for the Blue Jays. One of the preeminent strikeout artists over the last five years, he’s pushed his strikeout rate up to 36.9% this year, a career high. His walk rate is also up slightly — he’s never had great command at any point in his career — but it’s higher than it’s been since 2020. Still, all those additional strikeouts have helped him navigate whatever traffic those free passes put on the basepaths.
While Cease technically has a six-pitch repertoire, he’s mostly known for his riding fastball and hard slider. Those two pitches made up more than 80% of his pitch mix over the previous five seasons. This year, he’s throwing those two pitches about two-thirds of the time. To make up the difference, he’s committed to throwing his changeup a lot more often to keep left-handed batters at bay. He had thrown a form of his changeup back when he debuted with the White Sox in 2019, but it quickly fell out of favor. He had used it almost like a trick pitch over the last few seasons, never throwing it more than 100 times in any given season since 2021.
He found a new changeup grip this offseason and decided to re-incorporate it into his arsenal to give him a reliable third pitch to keep batters off his fastball-slider combo.
The revamped changeup has worked wonderfully so far. He’s thrown it almost exclusively to lefties, but they simply can’t hit it. The pitch has a 60% whiff rate, the highest of any pitch thrown at least 100 times this season. If batters do make contact, it’s usually weakly hit in the air; opposing batters have only managed a .185 batting average and a .215 wOBA against it.
When you think of effective changeups, you might picture Devin Williams’s airbender, dropping and fading away from opposite-handed batters. Or perhaps Edward Cabrera’s power changeup, modeled after Félix Hernández’s cambio. Based on Harry Pavlidis’ research into what makes a changeup effective, we know that a large velocity differential is beneficial for inducing swings and misses. But he also found that changeups that have a wide separation in movement profiles from the pitcher’s fastball can also be effective, particularly at generating groundball contact. Cease’s changeup is unlike any other in baseball.
The velocity differential between his fastball and his changeup is the second highest in the majors, but the pitch’s movement profile is what makes it stand out. It doesn’t fall off the table like you might expect, and it doesn’t fade away from lefty batters either. It’s a straight change. I calculated z-scores for those three characteristics — velocity differential, induced vertical break, and horizontal movement — and summed them as a rough approximation of how unique a pitcher’s changeup is compared to league average. Cease’s has the highest combined score by far.
By this crude method, Cease’s changeup is the most unique offspeed pitch in baseball. It moves a lot like a fastball, except it comes in 14 miles per hour slower. No wonder opposing batters can’t touch it.
This odd movement profile is tied to Cease’s release. He’s a natural supinator — when he releases the ball, his hand is behind it, imparting more backspin on the pitch. Supinators have a very difficult time throwing pitches with the arm-side movement that you would expect a traditional changeup to have. Cease’s change possesses a significant amount of backspin — that’s the reason why it doesn’t tumble as much as you’d think — and its spin profile closely mirrors that of his fastball. Because his offspeed looks a lot like his fastball out of the hand, the effectiveness of his heater has improved, as well. His four-seamer is running a 30.7% whiff rate, a career high for that pitch.
While he may not have made history on Wednesday, Cease is in the middle of what is shaping up to be a career year. He was just named to his first All-Star roster, and he’s pitched his way into the AL Cy Young race. In his first season in Toronto, he’s made the right adjustments to thrive.
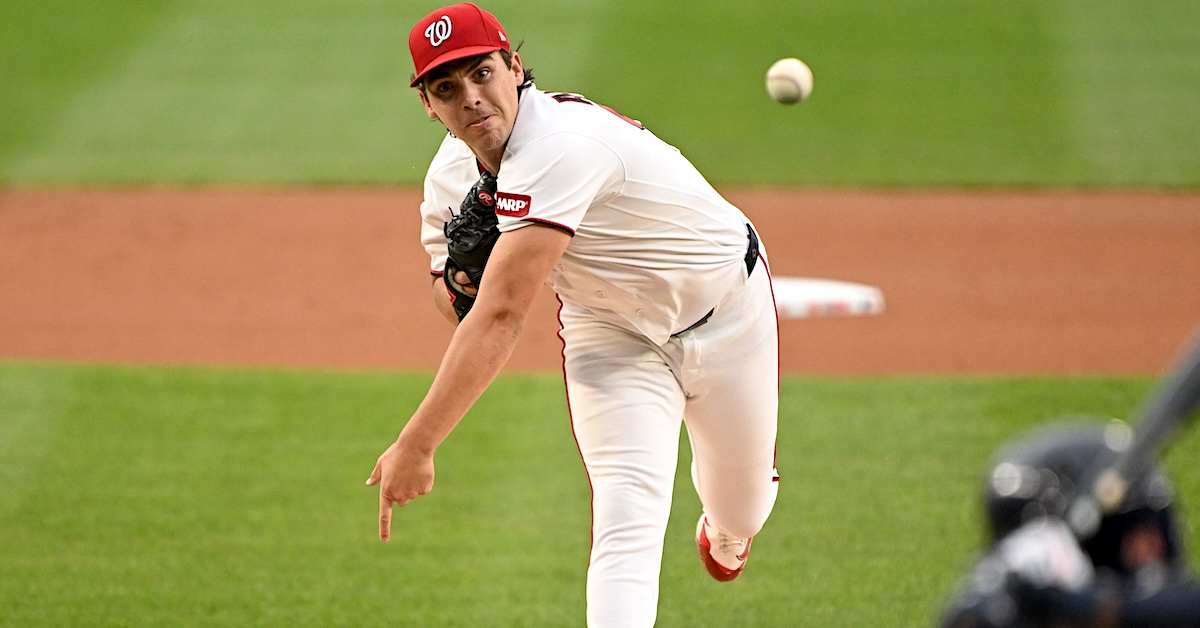
Tuesday night’s outing wasn’t anything to write home about — four hits and five runs allowed over 5 2/3 innings in a 6-3 Washington Nationals loss to the Houston Astros — but Andrew Alvarez is having a good season. Across 12 appearances, including six as a starter, the 27-year-old southpaw from Los Alamitos, California has tossed 47 frames with a 3.64 ERA, a 2.97 FIP, and a 25.4% strikeout rate. Pitching in his first full big league season, he has been one of the few bright spots on a staff that is statistically among the worst in the majors.
Velocity isn’t his carrying tool. At 92.3 mph, Alvarez’s fastball ranks in just the 18th percentile for velocity. What the 2021 12th-round pick out of Cal Poly brings to the table is a five-pitch arsenal that leans heavily on a somewhat atypical breaking ball combination. In terms of usage, his mix has been 29.8% four-seamers, 28.7% curveballs, 24.7% gyro sliders, 13.9% sinkers, and 2.9% changeups.
The left-hander’s self-identity as a pitcher pretty much mirrors his profile.
“The Nationals have certainly helped me grow my game and understand who I am,” Alvarez told me prior to a recent game. “I’m not someone who is going to overpower you with stuff, but rather keep you off balance, get some weak contact and a little bit of chase here and there, a little bit of swing-and-miss. For me, it’s more about moving the ball around, changing speeds and locations, and [getting] a lot of groundballs”
Alvarez’s 57.1% groundball rate is tied for sixth highest among hurlers with at least 40 frames on the season. Moreover, his chase rate (57th percentile) and whiff rate (65th percentile) are both comfortably above league average.
And again, Alvarez’s breaking ball combination is atypical, as well as his primary attack plan against most hitters. Read the rest of this entry »
The emergence of Statcast (and similar types of tracking data) over the last decade-plus has revolutionized many parts of baseball analysis. A big category that didn’t really exist prior was the notion of “expected” stats. Up until then, numbers were all tallies of results, and proto-expected metrics, like Bill James’ Component ERA, were derived from the classical array of stats. But tracking data opened up new opportunities in this area, allowing us to more closely look at home runs and strikeouts, and see the underlying processes and skills that made those results. While the past is always the past, expected stats are useful when talking about the future.
As someone who made the odd decision to work with baseball projections for half his life, I have a vested interest in finding the best use of this kind of information when predicting the future. Like the Statcast estimates (preceded with an x, as in xBA, xSLG, etc.), ZiPS has its own version, very creatively using a z instead. zStats do have some correlation with xStats, but not a perfect one, as ZiPS uses things like spray data, sprint speed, and plate discipline metrics in its estimates.
It’s important to remember these aren’t predictions in themselves. ZiPS certainly doesn’t just look at a pitcher’s zSO from the last year and say, “Cool, brah, we’ll just go with that.” But the data contextualize how events come to pass and are more stable than the actual stats are for individual players. That allows the model to shade the projections in one direction or the other. Sometimes that’s extremely important, such as in the case of homers allowed for pitchers. Of the fielding-neutral stats, homers are easily the most volatile, and home run estimators for pitchers are much more predictive of future homers than are actual homers allowed. Also, the longer a player “underachieves” or “overachieves” in a specific stat, the more ZiPS believes the actual performance rather than the expected one. Call this the Rule of Isaac Paredes, in honor of a player who constantly stymies zHR. In some ways, we’re projecting how cruel regression toward the mean will be.
More information on accuracy and construction can be found here.
Every July, we release our annual Trade Value Series highlighting the top 50 players in baseball, taking contract status and performance into account. For the past five years, I’ve been in charge of that exercise, with liberal amounts of help from the rest of the FanGraphs staff and some contacts on the team side. Last year, we added a new evaluator: You.
Today, we’re excited to announce the return of our crowdsourced trade value tool, which can be found here. Let’s review how it works, just in case you didn’t spend last year’s All-Star break furiously clicking through it when you should have been working. The tool, created by Keaton Arneson, and developed by Keaton and Sean Dolinar, aggregates simple “Which of these two players do you prefer?” questions to create a composite ranking. Using the tool is simple. When you pull it up, you’ll be presented with two players and asked to choose which one you think has a higher value in trade:
Ah, but what does “higher value” mean? Sometimes the simplest questions are the toughest. Having a higher value in trade isn’t the same as being better, or being younger, or having a more team-friendly contract. It might be some combination of those things, of course, and of other factors as well. In the real world, players have differing levels of value to teams based on a host of considerations, from how well they plug a hole left by a recently injured star to where the team finds itself in the playoff race. A promising prospect might mean more to a rebuilding club, just as a proven difference maker might move the needle for a team with October ambitions. We can’t tell you how to weigh these factors, which is part of the fun of constructing a trade value list in the first place. What we can do is provide some data that we consider useful in making such determinations and let you decide how to apply it. Read the rest of this entry »