One of this winter’s top free agents crossed himself off the list over the weekend, as Edwin Díaz signed a five-year, $102 million contract to remain the Mets’ closer. Díaz was absolutely dominant this season, striking out nearly two batters an inning, resulting in a FIP under 1.00, and avoiding any of the walk or home run flurries that occasionally have marred his résumé. While I’m not particularly a fan of the save stat or the conclusions drawn as a result, him only blowing three saves in 2022 accurately reflects his dominance; he only allowed multiple runs in a single appearance all year, and all three of his blown saves occurred with one-run leads. The deal comes with a $12 million signing bonus, a team option at $20 million for a sixth season, a no-trade provision, and an opt-out after 2025.
Star closer Edwin Díaz and the New York Mets are in agreement on a five-year, $102 million contract, pending physical, sources familiar with the deal tell ESPN. There’s an opt-out and a full no-trade clause, plus a sixth-year option. The best closer in baseball stays in New York.
Generally speaking, when a pitcher has a microscopic ERA, there’s some measure of luck involved; nobody’s long-term baseline expectation is an ERA of 1.31. So it naturally amuses me that Díaz arguably underperformed his peripherals this season. How often does a pitcher with an ERA that excellent actually have a FIP nearly half a run lower? Not very.
Going back to the start of 1901, there have been only 35 player-seasons in which a pitcher had an ERA under 2.00 and had a FIP lower than their ERA (out of 796 possible player-seasons). Only Gagne and Kimbrel had lower ERAs in seasons during which they failed to match their FIP; the average FIP for a pitcher with an ERA between 1.01 and 1.51 is 2.30. Read the rest of this entry »
It’s time to conclude the series on position player arm strength with the most impressive of them all: catchers. It was a joy covering infielders and outfielders, but it’s time for backstops to have the spotlight. They might now throw quite as hard as their position player counterparts, but let’s keep in mind that they do what they do out of a squat with no room for error. They can’t bobble, hesitate, or mess up their footwork and need to receive the ball and deliver it to second base in less than two seconds.
Let’s set some ground rules for the next iteration of this exercise. Baseball Savant sets their default minimum number of attempts to qualify on the pop time leaderboard at five, so we’ll stick with that. There’s thorough research that explains arm strength as the main component in pop time; because of this, I put strong value into it. Exchange speed still matters, but in this case, it’s more interesting to see how a player moves his body to take advantage of his arm strength.
Anyway, after sorting through the top of the leaderboard, I searched for clips of plays where the catcher especially needed his arm or just made so perfect of a throw that I couldn’t resist talking about it.
Christian Bethancourt (no. 1 overall, 88.3 mph)
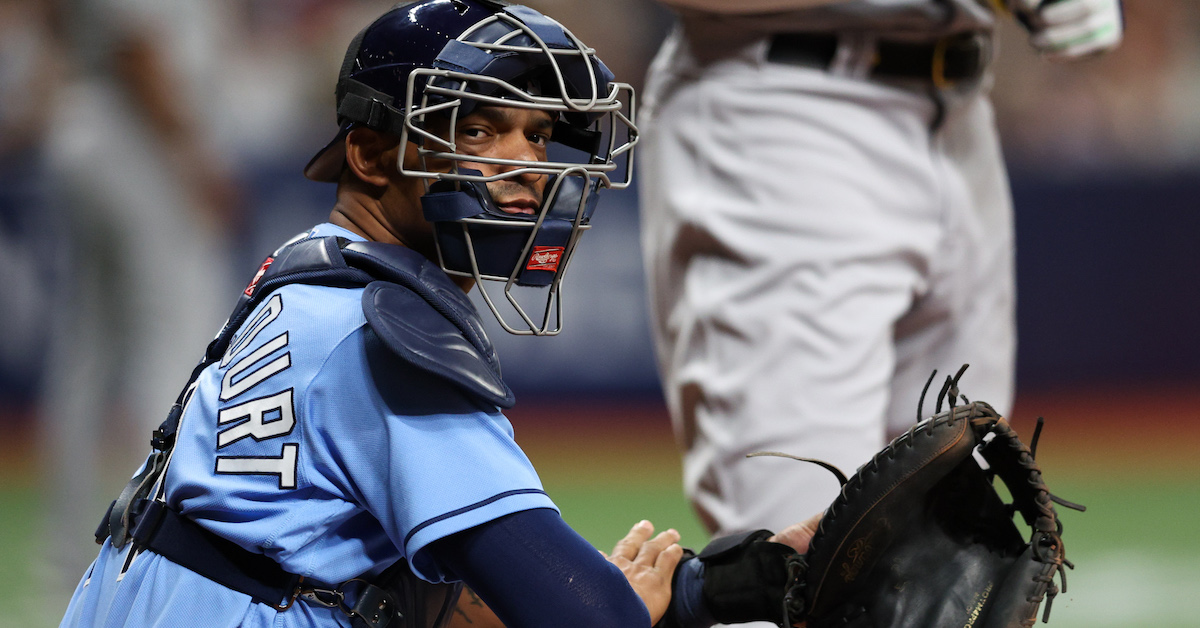
There is a new king on top of the catcher arm strength throne, and his name is Christian Bethancourt. That’s not too shocking; he threw in the mid-90s off the mound.
One thing about this particular caught stealing that I find very cool: we get to see how big of a jump Will Brennan got off Corey Kluber. With that jump and a 78-mph sweeper to handle, Bethancourt had no business making this play. The difference is how he perfectly cheats with a slight quarter turn of his torso as he’s waiting for the pitch to come in. It’s usually difficult to do this move in the heat of the game, but he knew it was the only chance he had to catch the runner.
Typically a catcher would let the ball travel further than this, but Bethancourt’s loopy, pitcher-like arm swing means his low transfer is the most efficient for his body and mechanics. After the smooth transfer, he placed a seed right on top of the bag for Wander Franco. Impeccable mechanics with no room for error. Read the rest of this entry »
Welcome to the offseason. As is customary, the end of the playoffs means the release of FanGraphs’ annual top 50 free agent rankings. In recent years, we’ve rotated through the writers principally responsible for the list – first Dave Cameron, then Kiley McDaniel, Craig Edwards, and, more recently, me. I’m back this year and I’ve brought help: the FanGraphs staff contributed mightily to this piece.
Below, I’ve provided contract estimates and rankings of the winter’s top free agents, along with market-focused breakdowns for the top 25 players. That could be a quick discussion of where a player might sign, what a team might look for, or even just statistical analysis masquerading as market analysis – I’m an analyst at heart and never stray far from my roots. Meanwhile, a combination of Michael Baumann, Justin Choi, Jay Jaffe, David Laurila, Eric Longenhagen, Dan Szymborski, and Jon Tayler supplied player-focused breakdowns, which are designed to provide some context for each player at this moment in his career. Special thanks to David Appelman, Sean Dolinar, Jason Martinez, and Meg Rowley for their help behind the scenes.
The players are ranked in the order in which I prefer them. That’s often the same as ranking them in contract order, but not always. In some cases, I prefer a player I expect will get less money over one who stands to make more. I’ll generally make note of that in the accompanying comment, but just to reiterate, this list isn’t exclusively sorted by descending average annual value or anything like that. All of the dollar amounts are estimated guarantees. Plenty of contracts will include team options or player incentives, but those aren’t included in these estimates. Player opt outs are similarly not included. All of the projections are Steamer 2023 projections, but use our Depth Chart playing time allocations. The lone exception is Kodai Senga, whose projection comes courtesy of ZiPS. The listed ages indicate the age-season the player is about to play. Read the rest of this entry »
Denzel Clarke isn’t one of the highest-profile prospects in the Oakland Athletics organization. A 2021 fourth-round pick out of Cal State Northridge, the 22-year-old outfielder is No. 17 in our most recent ranking of the system. But he is one of the most intriguing — and most exciting. Gifted with elite athleticism, Clarke made a number of highlight-reel catches this summer, and he also legged out a pair of inside-the-park home runs. In a season split between Low-A Stockton and High-A Lansing, he put up a 123 wRC+ while going deep 15 times and stealing 30 bases in 33 attempts.
His baseball background is modest compared to that of most of his peers. A native of Ontario, Canada, Clarke began playing at age 10, and it wasn’t until he was 16 that he began taking the game seriously. It was then that his travel-ball coach with the Toronto Mets told him he had a shot at doing something special if he devoted his attention to the diamond. Prior to that, he was multi-sport to the max.
“I played everything,” explained Clarke, who is currently with the Arizona Fall League’s Mesa Solar Sox. “In school, it was track and field — that runs in the family (Clarke’s mother competed in the 1984 Summer Olympics) —volleyball, basketball, badminton. I love racquet sports, so I played some tennis. I touched on pretty much everything except football and hockey. My mom was very precautionary with concussions, so those are the two I avoided.” Read the rest of this entry »
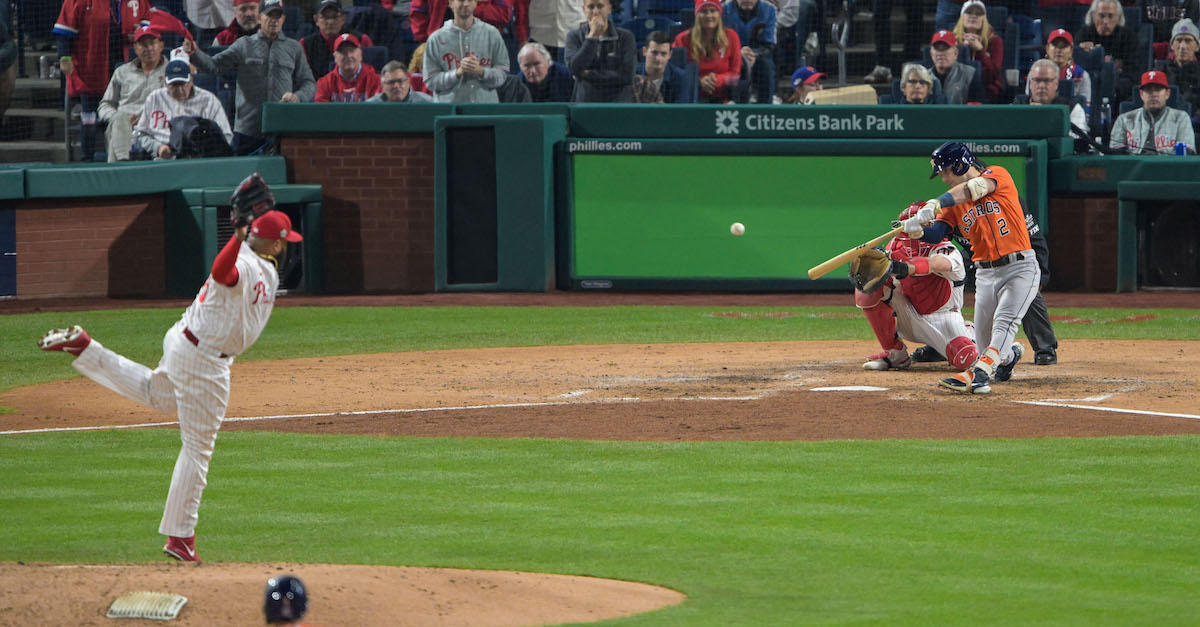
The field of hitters in the World Series is loaded. Both sides feature old and new stars who can tear the cover off the baseball. Perhaps unsurprisingly, Bryce Harper has been the most productive of all of them, with a .514 wOBA to this point. You have to go all the way down to the low .400s to find the next players on that list, but if you do, you see Jeremy Peña (.427 wOBA) and Alex Bregman (.407 wOBA). Peña has had the best stretch of his short career in these playoffs, delivering two-strike hit after two-strike hit. But the Astros third baseman, who has been penciled in right behind Peña and Yordan Alvarez, has also been fantastic.
There’s a reason Bregman is sitting fourth in the lineup behind three stars. His knack for not chasing breaking balls and getting to high velocity makes him an ideal hitter to follow Peña and Alvarez. Peña’s weakness is chasing sliders off the plate, while teams have consistently challenged Alvarez with high heat. But that approach has to change when facing Bregman, making it tough for any reliever to get through this stretch of the lineup unscathed. Interestingly, while Bregman’s chase rate hadn’t faltered at all, his ability to get to high velocity has only come around in the last month after a rough regular season, when Bregman posted a .242 wOBA against pitches thrown 96 mph or higher. To be honest, that surprised me. I know he doesn’t have crazy bat speed or hit the ball harder than most, but to the naked eye, he has one of the quickest triggers in the game.
When I say trigger, I’m referring to the time it takes Bregman to start his downswing and get to impact. If we were able to get our hands on his bat sensor data, I’d be very willing to bet this is where Bregman stands out amongst his peers. That skill makes him a great candidate to routinely beat high velocity. That’s a subjective thing to say without concrete data, but perhaps I can provide some video evidence. Let’s look to Game 3 of the ALCS:
Before this fastball, Bregman saw five upper-90s four-seamers from Gerrit Cole. If a very good hitter sees the same pitch six times in a row, I don’t doubt they’ll be able to make an adjustment like Bregman did here, even against Cole’s plus fastball. He had fouled off two heaters in this at-bat, and looked slightly late. Those swings, likely combined with the knowledge that Bregman had struggled with high velocity this year, was enough for Cole to stick to his guns and continue with the high heat. Unfortunately for him, Bregman adjusted by choking up and shortening his swing even further as he drilled this 100 mph fastball on the black right back up the middle at 105.7 mph.
By this time, Bregman had already laced a few liners off triple-digit fastballs. He had a hit in all three of his appearances against Andrés Muñoz in the ALDS, with the hits against fastballs coming in Games 2 and 3. Here they are:
Two fastballs over 101 mph, both of which were barreled over 105 mph to give Bregman a single and double, respectively. Both came on 0-0 counts, so I’m inclined to think Bregman was sitting on this pitch. He took Muñoz yard in Game 1 on a hanging slider, so he probably anticipated that the Mariners reliever wouldn’t go back to the pitch. Of course, even when you sit on a 101 mph fastball, you still have to barrel it. That’s a tough task for any hitter and Bregman made it look quite easy.
And it’s not as if Bregman was cheating his load or leg kick for those pitches against Cole and Muñoz. It looks natural for him to get his bat on plane and in the hitting zone very quickly. Given that, you might ask why Bregman was so bad against high velocity this year. As I said before, he had a .242 wOBA against these pitches, and it’s not like his .298 xwOBA was much better. Of the 23 home runs he hit in 2022, not a single one came on a fastball thrown 96 mph or higher. His swing type should enable him to hit these pitches well, but sometimes the eye test doesn’t align with a hitter’s outcomes. Still, by the looks of it, his performance in 2022 may have just been a blip. The following table shows Bregman’s performance against fastballs 96 mph and higher throughout his career:
Alex Bregman Against 96 mph and Above
Year
Total >= 96 mph
Total Pitches
Hits
wOBA
xwOBA
2017
69
2,302
8
.381
.360
2018
210
2,821
8
.244
.370
2019
198
2,915
12
.440
.427
2020
69
736
4
.532
.422
2021
104
1,593
8
.322
.359
2022
129
2,521
10
.242
.298
Total
929
12,888
50
.327
.363
SOURCE: Baseball Savant
The gap between his wOBA and xwOBA can probably be explained by a combination of bad BABIP luck and spray angle, but nonetheless, a career .363 xwOBA on this group of pitches is impressive. Focusing on just launch angle and exit velocity might miss out on some context, but it’s still a good representation of Bregman’s ability to hit these pitches hard in the air. If you exclude 2022 from the totals, Bregman’s wOBA/xwOBA split is .356/.385. Now, excluding 2022 isn’t exactly fair; this season did indeed happen! But I wanted to show you what Bregman had done before his struggles this year.
Even relative to the rest of the league, Bregman was a great hitter against high velocity. His .363 xwOBA against the pitch group since 2017 ranks him 26th in the league among hitters who have seen at least 750 of these fastballs. This was a proven skill that suddenly fell off hard in 2022 despite it being Bregman’s healthiest season in terms of games played since 2019. Sometimes a hitter’s mechanics get out of whack, and they just suddenly can’t handle a pitch they never had an issue with before. When that happens, it makes sense for high velocity to be the first thing a pitcher goes to. After all, fast things are hard to hit! After churning through swings from various months, I realized Bregman’s stride was slightly more open than it was in the playoffs. Here are two representative swings on inner-third pitches. The first is from June and the second is from September:
Unfortunately for Bregman, even such a small difference in stride direction made a huge difference in his batted ball quality. If you re-watch the swings from the playoffs, you can see Bregman staying near neutral to slightly closed. In the two swings above, Bregman’s stride leads to his front hip leaking out early. As a result, he flared a fly ball and chopped a groundball. The front foot rotation tells you where his direction is heading in both pitches. He is losing his center of balance while trying to throw his hands at the high velocity. His swing is so short that he is still able to get to it, but the slight mechanical difference distorts his bat path enough to ruin his contact quality. Now that we know this, we can better understand why Bregman has been so fantastic in the postseason from a mechanical perspective, but do the batted ball statistics match? Yes, they do indeed.
His .518/.468 wOBA/xwOBA split gives us additional context to the quality of contact Bregman made. There is a gap between the two, but it doesn’t really matter in this case. A .468 xwOBA is still a very, very high mark. He is on the short list of hitters who seem especially well equipped to deal with the high velocity playoff pitchers bring to the mound. The swings I showed you against Cole and Muñoz are good examples of that, but I’d like to take you through an at-bat from Game 4 of the World Series when Bregman faced José Alvarado. Bregman looked overmatched to start, but he eventually came out on top even though he was down 0-2 in the count. The bases were loaded with no outs. Alvarado came in to limit the damage. Here’s how it started:
On the 0-0 count, Bregman took this 101 mph sinker, which ran back over the front door. Coming from Alvarado’s arm slot, this pitch is a doozy. Good decision to take. Down 0-1, he had to be aggressive to try and drive a runner in:
Bregman was definitely swinging for a 101 mph sinker again. He didn’t recognize the spin, and the pitch broke under his barrel. He checked in with the umpire to see if the pitch was in the zone to reinforce his understanding of where it ends up after it breaks. Heading into the 0-2 count, Bregman had to cover the diving cutter and the turbo sinker:
This pitch was slightly higher than the previous one and allowed Bregman to get a little more of barrel on it. Realistically, you can’t cover every zone against Alvarado with the sweet spot of your barrel, as he has two pitches that break in opposite directions. This is the very best you can do if you’re simultaneously trying to beat 101. By the looks of it, Bregman had no problem doing so in the next pitch:
That pitch was meant to run over the front door like the first one, but Alvarado committed the biggest sin when it comes to front-door sinkers: He let it run over the middle of the plate and right into Bregman’s ideal bat path up and away. Bregman was doing his best to cover the high velocity while down in the count, and he did. In Game 1 of the series, he had a very uncomfortable at-bat against Alvarado and wasn’t able to cover the sinker or cutter. He knew he had to make a slight tweak to get a different result. Swings like this are why he leads all players in the postseason in hits (six) and wOBA (.518) against heaters 96 mph and above.
Don’t get me wrong, a .518 wOBA against the best fastballs isn’t sustainable. Not even Aaron Judge posted a wOBA like that while hitting every fastball to the moon this season. However, the combination of Bregman’s swing and career-long skill of hitting high velocity makes him significantly more capable of producing hot streaks like this one than the vast majority of players in the league. Here I’ll remind you that over the course of a season or a career, a player doesn’t perform to their average mark the entire way. There are hot and cold streaks wrapped in there that bring them to their true average. Bregman is having one of those hot streaks, and it couldn’t come at a better time.
As his team takes a crucial 3-2 lead heading back to Houston, don’t be surprised if Zack Wheeler and the rest of the Phillies’ pitching staff avoid heaters against Bregman. The Phillies have no room for error, which means they must avoid Astros hitters’ strengths. Right now, Bregman’s swing mechanics are locked in to beat these pitches and the Crawford Boxes are lurking in left field, just waiting for him to yank one out like he did against Luis Severino in the ALCS.
As FanGraphs’ own Jay Jaffe noted last week in his piece on the dominance of relief pitching this postseason, the average time to play nine innings is down by 15 minutes in the playoffs after dropping by an average of seven minutes in the regular season. As Jay wrote, there are a handful of factors likely contributing to shorter game times in 2022, ranging from reliever usage and rule changes such as the three batter minimum, to technological adjustments like PitchCom, to changes in gameplay and dwindling offensive production. Regardless of the reason, it’s a shift that warrants exploration. League leadership has spent the betterpart of the lastdecade focused on reducing the length of its games; the commissioner talked about improving baseball’s pace of play on his very first day of the job. While games are still longer than three hours on average this season, the seven-minute dip after a record-long average game in 2021 marks the most precipitous single-year drop in the Divisional Era, and that sounds like it should be music to the ears of Rob Manfred and Co.
MLB Average Time of Game
Year
Regular Season
Postseason
2016
3:00
3:29
2017
3:05
3:40
2018
3:00
3:40
2019
3:05
3:40
2020
3:07
3:38
2021
3:10
3:44
2022
3:03
3:29
SOURCE: Baseball-Reference
Per 9.0 innings
But the league’s objective with respect to time of game is more nuanced than just shaving off minutes at any expense. Yes, Major League Baseball is interested in games moving faster, which has led to rule changes like the upcoming pitch clock in 2023 and the existing three batter minimum for relievers. Teams used 3.30 relievers per game in the regular season in 2022, down from 3.43 in ’21, and fewer pitching changes mean less wasted time. But it is also interested in maintaining some level of offensive action – hence the introduction of the designated hitter in the National League this year, and bans on the shift set to come along with the pitch clock next year. Some improvements in time of game can come at the expense of offensive action, and vice versa, and titrating the levels of each that make for the best product is a delicate balance. In 2022, we did see offense trend down to concerning levels, but with a closer look, there is also some reason for optimism with regards to finding this balance. Read the rest of this entry »
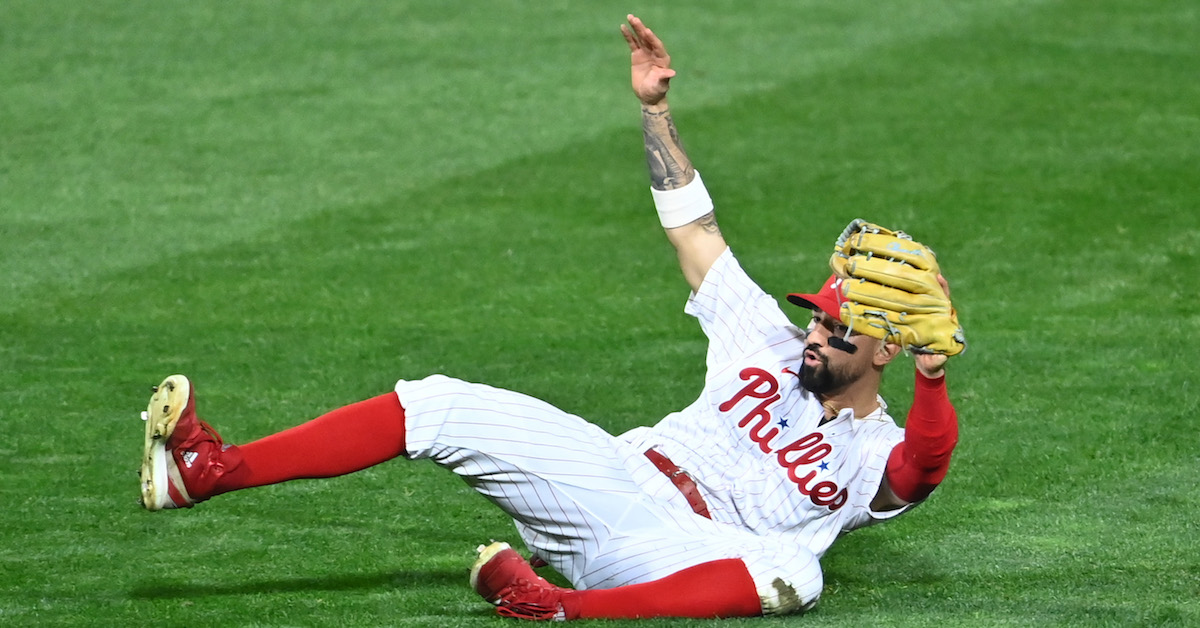
If you’ve been watching the playoffs, you’ve likely heard at least one broadcaster call Houston right fielder Kyle Tucker underrated. In Game 1 of the World Series, Tucker did his best to remedy the situation, blasting home runs in his first two at-bats. On Monday, MLB announced that after two years as a Gold Glove finalist, Tucker had finally won the award. Still, he’s not the right fielder everyone’s talking about:
Nick Castellanos stole Tucker’s thunder not once but twice, saving Game 1 with a sliding catch, and making a nearly identical play on the first pitch of Game 3. As if that wasn’t enough, the World Series’ third-most talked about play in right field didn’t belong to Tucker either:
Two weeks ago, Rawlings and MLB announced this year’s Gold Glove finalists. The inclusion of Juan Soto, who posted the worst OAA among qualified outfielders but ran a 145 wRC+, prompted me to examine the link between Gold Glove finalists and offense. I found that Soto’s selection was likely due to the halo effect, a cognitive bias which may have led voters to extend a positive overall impression of him to his fielding.
Fast forward to this week, when Rawlings and MLB announced this year’s Gold Glove winners. While Soto was not among the 20 victors, the 16 non-pitcher, non-utility winners out-hit the other 32 finalists 115 to 107 in wRC+. Last year, the winners out-hit the other finalists 114 to 107 (I excluded this year’s utility finalists/winners to make the comparison). In my previous article on Gold Gloves, I also found that finalists out-hit other qualified fielders 109 to 103 in wRC+ last year and 110 to 102 this year. Read the rest of this entry »
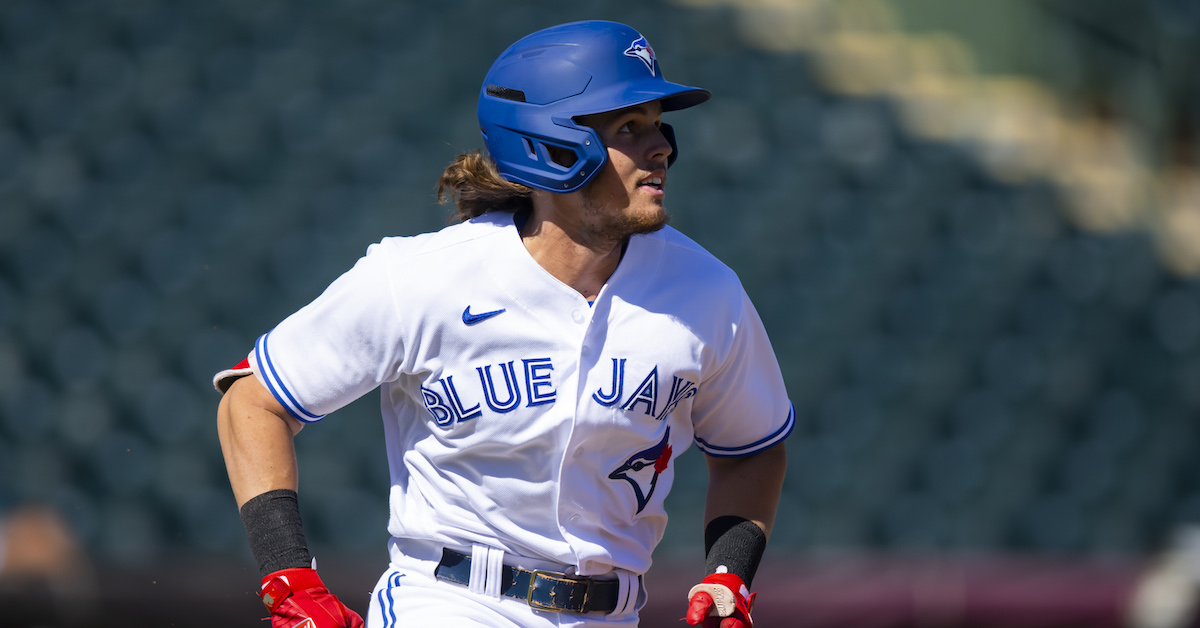
Addison Barger put up the best numbers of any hitter in the Toronto Blue Jays system this season, and he did so with a hitting style that was initially influenced by Ichiro Suzuki.
“I’m naturally a right-handed hitter, and actually switch-hit throughout high school,” explained Barger, who now hits exclusively from the left side. “At the time I started hitting left-handed, around 10 years old, I was obsessed with Japanese players and the Japanese style of hitting. A big leg kick was part of that, and it’s something I mimicked. It just stuck with me.”
That’s not to suggest the 22-year-old infielder profiles similarly to the Japanese icon and erstwhile Seattle Mariner that he grew up watching in Bellevue, Washington. That aforementioned big leg kick is one point of difference; while more pronounced during his NPB days and at times early in his MLB career, Ichiro’s was never as high as the one Barger currently employs. And Barger is no Ichiro-like slasher. The future Hall of Famer had a swing designed to slash line drives into the opposite-field gap. Barger’s M.O. is now the inverse. Indeed, as evidenced by the 26 home runs he hit across three levels, Barger is a basher. Read the rest of this entry »
When the Silver Slugger finalists were announced last week, I took a minute to compare the stats between the candidates at each position. Judging by the comprehensive hitting metrics, like OPS, wOBA, and wRC+, it seemed, at first, like there were numerous close races — many too close to call. But when I turned my attention to Offensive Runs Above Average, several of the close races suddenly disappeared, with one player becoming the clear frontrunner. That can be the result of playing time considerations, but in these cases, it was largely because of baserunning. For example, José Ramirez, Rafael Devers, and Alex Bregman are neck-and-neck-and-neck when it comes to most measures of hitting, but by total offensive value, Ramírez has a commanding lead. There’s a similar thing going on between Xander Bogaerts, Bo Bichette, and Carlos Correa; they have nearly identical hitting stats, but Bogaerts is a markedly superior baserunner.
Once I looked at the baserunning stats, these once-close races hardly seemed close at all. Understandably, this got me thinking about what role baserunning plays in determining the Silver Sluggers. Is it one of the criteria voters are supposed to consider? That sounds like a simple enough question, and one that should have a simple enough answer. And yet that doesn’t seem to be the case. Read the rest of this entry »