Over the past week and a half, we’ve published our annual season preview, ranking the league’s players by position and team based on a blend of our projections (a 50/50 split between ZiPS and Steamer) and our manually maintained RosterResource playing time estimates courtesy of Jason Martinez and Jon Becker. If you happen to have missed any of those installments, you can use the navigation widget above to catch up.
Today, I’m going to summarize the results. We’ll look at some tables and pick out a few interesting tidbits in a moment, but first, as I do every year, I’ll remind you that this exercise captures a snapshot of how we project teams to perform now. Teams aren’t static. Since we began publishing our rankings, top prospectsKevin McGonigle (no. 5), JJ Wetherholt (no. 12), and Carson Benge (no. 21) made their respective Opening Day rosters, while no. 1 overall prospect Konnor Griffin was sent down to get a bit more seasoning in the minors. Nationals outfielder Dylan Crews, the second overall pick in the 2023 draft and a former top prospect, was optioned to Triple-A Rochester. And a number of notable pitchers hit the injured list, including Spencer Strider, whose strained oblique will no doubt complicate his efforts to regain his 2023 form. Read the rest of this entry »
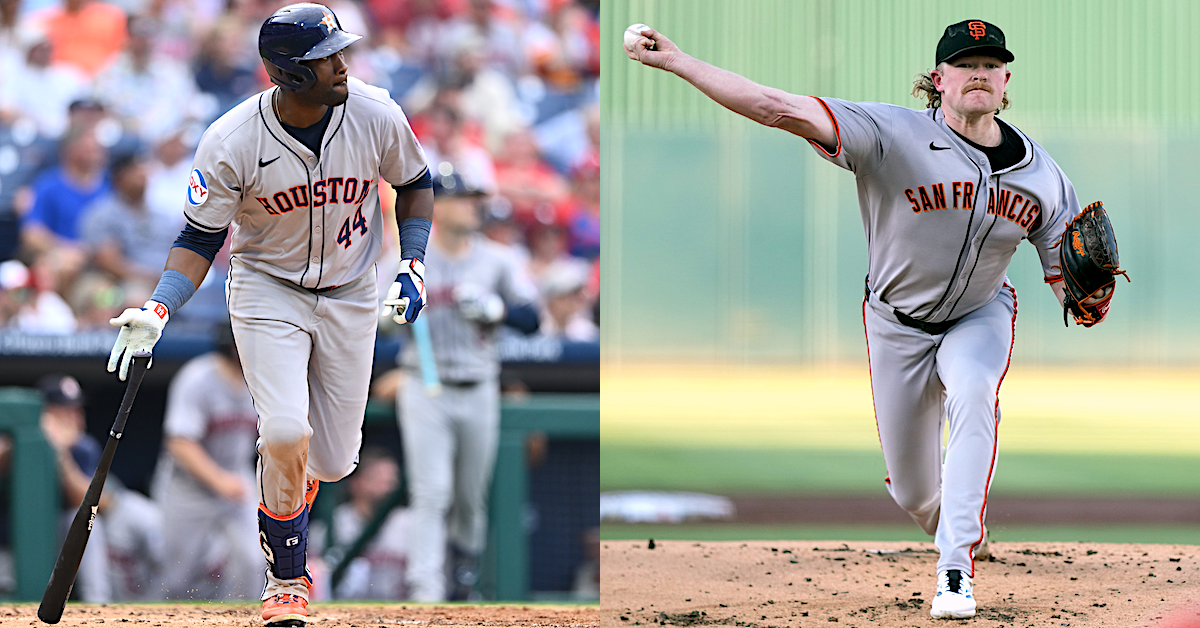
Sam Navarro, Eakin Howard, Rafael Suanes-Imagn Images
Dean Kremer has been a staple of the Orioles rotation in recent years. Even while missing significant time due to injuries in a couple of seasons, he’s made more starts than any other Baltimore pitcher since the beginning of 2022, a span that encompasses both the division-winning Orioles from ’23 and last year’s basement dwellers. Yet this past weekend, Kremer was optioned to the team’s minor league camp, the odd man out in a rotation battle. He’s not the only familiar name among those slated to start the season in the minors due to such decisions.
Opening Day is full of fanfare and so often freighted with meaning, but it’s still just one day on the baseball calendar; the decisions regarding who gets to be there (and who doesn’t) don’t actually define the season. Still, unless they’re recalled to replace injured players — which is hardly out of the question — optioned position players need to remain in the minors for 10 days and pitchers for 15 days, counting from March 25 (Opening Day for the Giants and Yankees). In other words, they’ll be eligible to return on April 4 or April 9. Beyond that, circumstances change as the season progresses, and rosters are in a constant state of flux.
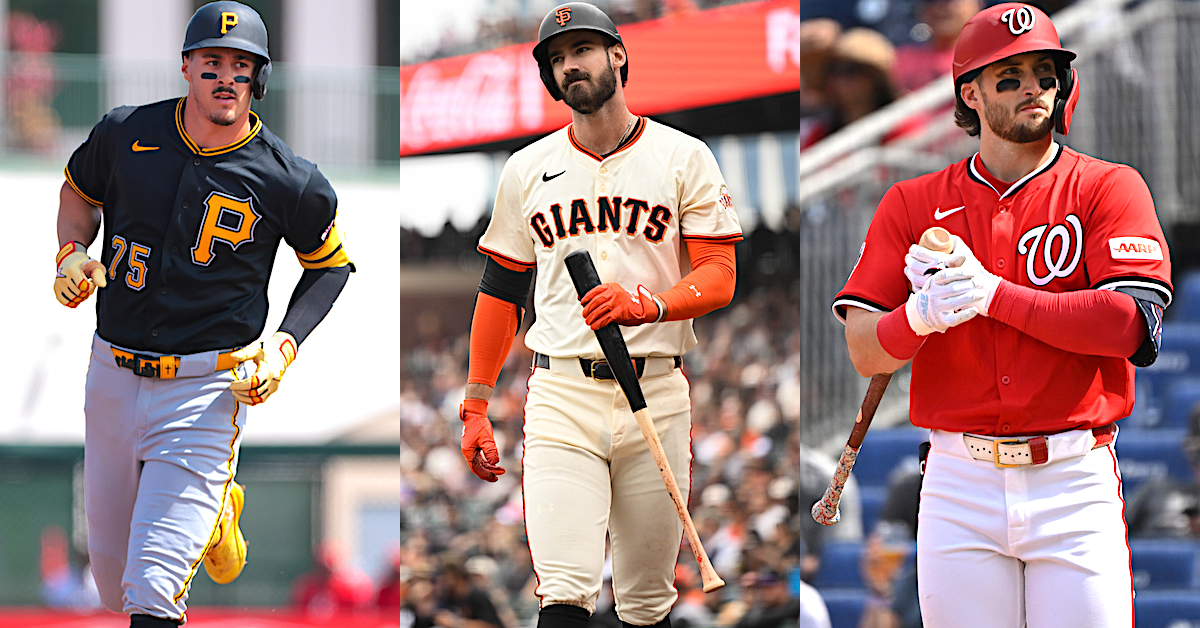
Kremer stands out because he’s fully established himself in the majors, while the other high-profile decisions I’ve highlighted below involve players who are or were recently considered top prospects. They’re all headed to Triple-A, and I expect them to stay past the aforementioned dates, but they’re notable because they’re still expected to play substantial roles in 2026. The players are listed alphabetically. Read the rest of this entry »
At this time time last year, I made a series of predictions. I explained why each team might make it to the promised land, as well as why each team might find itself dead in a pit. We’re running it back this year. Will your favorite team win it all? Will it perish in a factory fire? Here’s how it might go down. Consider these the first- and 99th-percentile projections. If you missed the National League edition yesterday, you can check it out here. Today we’re on to the American League.
Baltimore Orioles Why They’ll Win It All: After two years of struggle, Adley Rutschman will come back and play like a star again. He’ll be a six-win MVP candidate. He’ll instantly look like he did in 2022 and 2023. Where has that guy been the past two years? The answer is simpler than you think. He’s been hiding in the basement while his secret twin, Badley Rutschman has limped to league-average performance. That’s right, he uses a double. This two-years-on, two-years-off gambit used to work well enough. Badley was more than capable of tearing up the Pac-12 and the high minors, but the big leagues are another story. Badley couldn’t quite hack it, but Adley will return and Badley will be back in the basement. (Don’t worry, it’s a nice enough basement.) The secret twin life is a tough one, but it’ll bring the O’s back into the first division.
Why They’ll Lose It All: Playing behind Alex Bregman in the World Baseball Classic will mess with Gunnar Henderson’s head. Do you know the last time Gunnar Henderson was a backup? Neither does Gunnar Henderson. He’s not meant to play third base second fiddle. He’s feeling like a second-class citizen for the first time. Number two’s supposed man the six, not bat seventh. By the Fourth of July, he’ll be striking out a third of the time and batting fifth and seven ate nine. Read the rest of this entry »
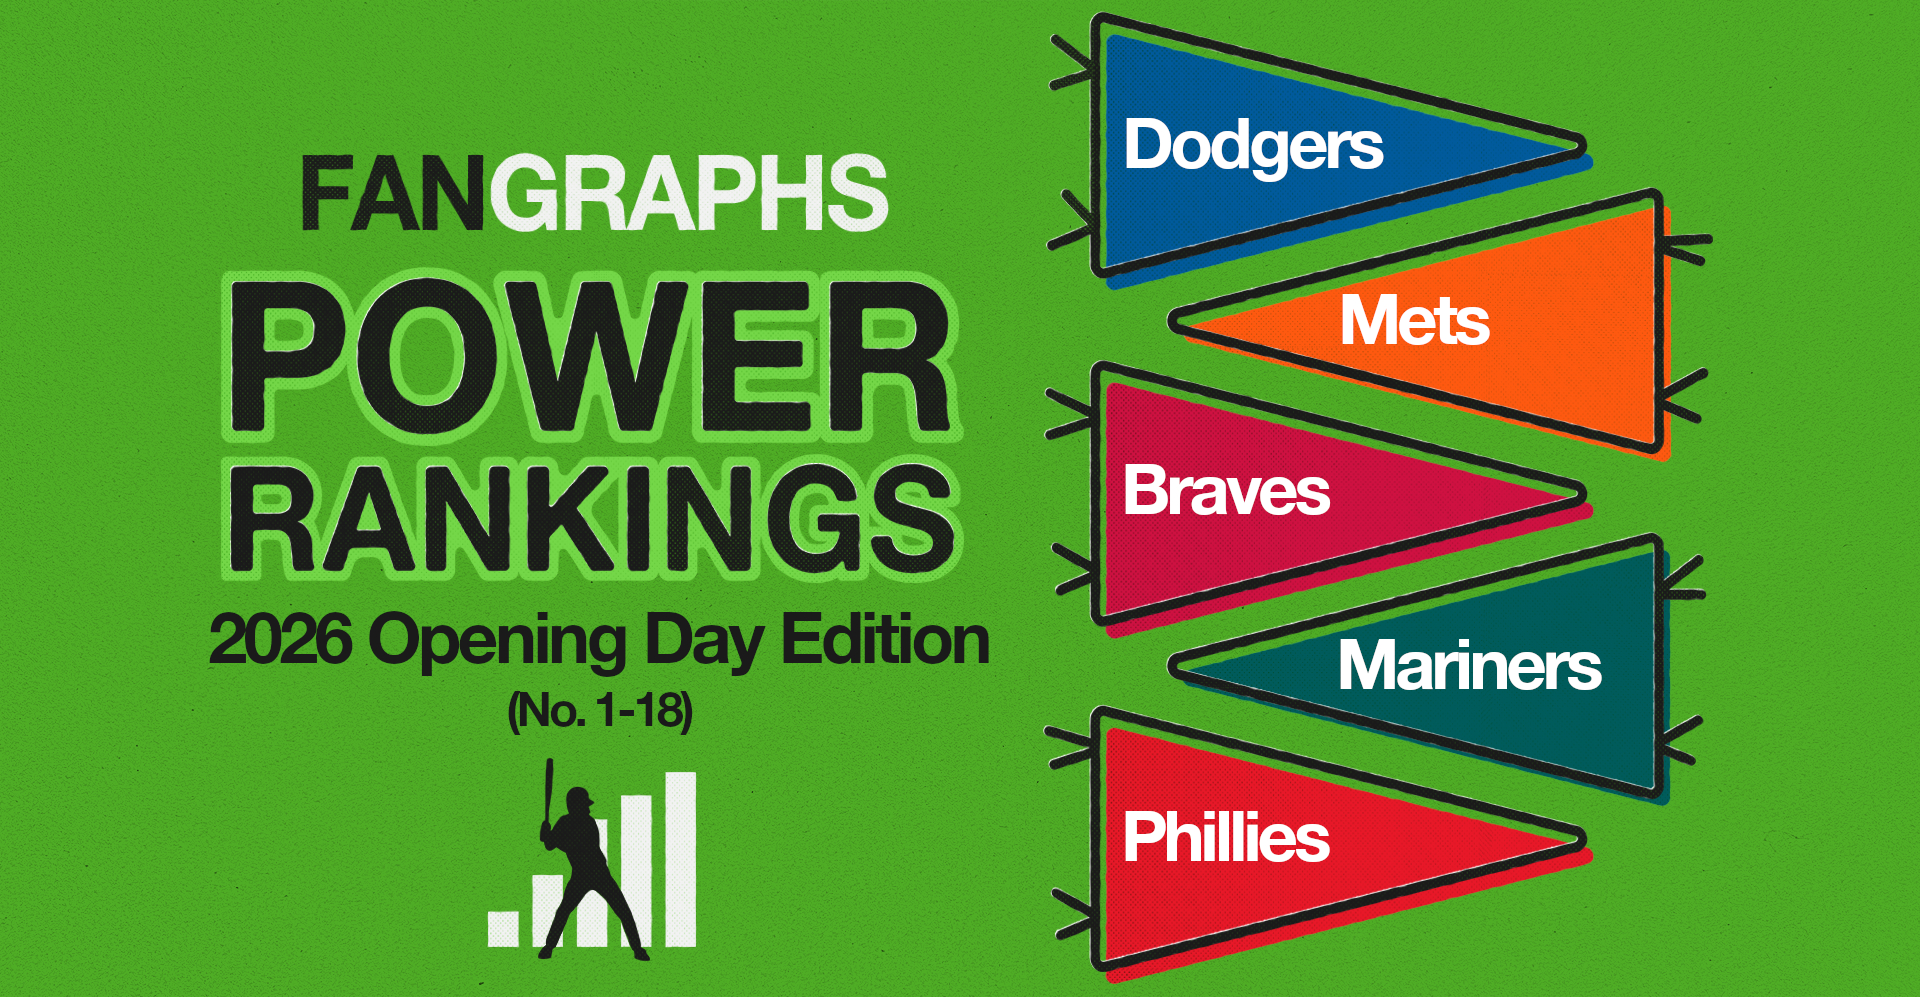
Opening Day is upon us! Yesterday, I laid out what the best- and worst-case scenarios looked like for the 12 teams projected to finish under .500 in 2026. Today, we turn our attention to the teams in the league who are forecast for a .500 or better record, the ones we expect to be vying for playoff position all season long.
Our power rankings use a modified Elo rating system. If you’re familiar with chess rankings or FiveThirtyEight’s defunct sports section, you’ll know that Elo is an elegant ranking format that measures teams’ relative strength and is very reactive to recent performance. For these Opening Day rankings, I’ve pulled the Depth Charts projections and calculated an implied Elo ranking for each team. First up are the full rankings presented in a sortable table. Below that, I’ve grouped the teams we’re covering today into tiers, with comments on each club. The delta column in the table below shows the change in ranking from the pre-spring training run of the power rankings in February.
Angelina Alcantar/News Sentinel-USA TODAY NETWORK via Imagn Images
I’ve concluded my spring journey through the backfields and Breakout Games, which makes this a good time to drop a few more notes. As with last time, I’ve got a mix of updates on top prospects and some off-the-radar names who have played well. I’m again mostly limiting these notes to players and systems we’ve already covered; I have thoughts on Brody Brecht and will share all of them and more on our Rockies list, which is next up in the prospect list queue.
Ethan Holliday, SS, Rockies
Holliday enters the year as one of baseball’s most volatile prospects. Big, All-Star-caliber tools run into a long swing with a lot of moving parts, and the collision is producing hard-hit balls and tardy cuts in equal measure. He tends to be behind good velocity, or even average fastballs if they’re up in the zone. Conversely, he bruised a couple baseballs in his wheelhouse down and in, including a ringing hit on a pretty good cutter in the Breakout. Physically, he looks great, and while I still think he’ll need to make an adjustment to cut down on the length of his swing at some point, I’d give him all the time in the world to figure it out.
The pleasant surprise here is that Holliday’s glove has looked significantly better at short this week than it did in Fresno last August. His reactions off the bat are quick and accurate, he charges smartly, and he picked everything in his orbit. This wasn’t a long enough look to change course entirely on his defensive projection, as he’s already big and likely still growing, but for me his odds of staying at short went up this week.
Patrick Forbes, RHP, Diamondbacks
I tend to think that good spring performances are more meaningful than bad ones. For the latter, sometimes guys are just working on a pitch, battling through the dead arm period, trying a new stance, going through the motions, or otherwise focused more on “preparing” than “competing.” In that spirit, I’m not alarmed by Forbes’ outing in Arizona’s Breakout, though I do think it’s fair to note that he didn’t look great. Forbes was the first pick in the first compensation round of last year’s draft, and when he was in college, his velocity sat 94-97 mph and touched 99. On Saturday, though, he barely scraped 95 mph, sitting 92-94. He was scattered with both his heater and his slider, and while he missed several bats, he never got in a rhythm. He had trouble aligning his upper and lower halves, and in this outing he tended to pull the ball with him as he fell off the mound. Hopefully, this is just a blip, and he’s back to his high-octane self during the regular season.
Nate Snead, RHP, Angels
In last week’s notes, I covered how one Angels source highlighted Snead as a player who belongs on the main section of the club’s top prospects list. Good scouting on his part, as Snead looked sharp in their Breakout, where he struck out two (with two walks) in two innings of work. In the system overview, I wrote that Snead “regularly touches triple digits,” which is still part of his game. But I also wrote that “he needs a sharper breaking ball,” and on this look, it was evident that he’s got a very good one, a hard slider that flashes plus. That offering is substantially ahead of his curve, which looks fringy, but as a likely reliever, upper-90s and one plus breaker is all you really need. While he’s not the most deceptive guy in the world, I came away pleasantly surprised with his ability to hit a region and move the ball to both sides of the plate. Snead will jump toward the top of the 40 FVs or bottom of the 40+ FVs when I next update the Angels list, which should be soon.
Wellington Aracena, RHP, Diamondbacks
Speaking of pitchers who need to be added to a list. Aracena was the main return for the Diamondbacks when they shipped Blaze Alexander to the Orioles. He’s a big guy with elite velocity and two very hard secondaries. While he regularly touches triple digits, it’s his 97 mph cutter and 92-93 mph slider that are most impressive on the radar gun. He’s long thrown hard, but this is another step up from when we last covered him in June. Overall, the 21-year-old struck out three in his three innings of work, with no free passes. While not wild, there’s some effort in Aracena’s delivery, as he generates his velocity in part with big shoulder and hip torque as he drives toward the plate. He poses an interesting dilemma for Arizona: He has the length and stuff to continue developing as a starter, but he projects as a late-inning reliever in short stints and could be a shot in the arm for the thin bullpen. He also has the outwardly competitive disposition and attitude teams tend to like in that kind of role. It’s a good problem to have.
Sandro Santana, LHP, Diamondbacks
Of the thousand pitches Santana fired last year, only 15 were changeups — so few that I didn’t catch any in my several looks at him in 2025. I omitted the pitch in my report on him last December, as I assumed he’d either mothballed it or would soon. Looks like we’ll need to update that report, too. Santana didn’t just throw a few cambios, but he also missed a couple bats with them. He has a low slot and generates the kind of fade and tumble that that release tends to produce, with good arm speed to boot. I don’t know what my best accomplishment was this winter, but I’m sure it pales in comparison to finding an above-average changeup.
The rest of Santana’s game looked sharp, as well. In two innings, he didn’t allow a baserunner and struck out two. He touched 96 mph, and his slider was again above average, long with good spin, and lefties looked very uncomfortable against it, flinching or waving weakly at it several times.
Yilver De Paula, SS, Angels
De Paula stood out in this winter’s deep dive through the Angels’ DSL club, even though he only played a handful of games. I got only a quick look at him live. (Disappointingly, he didn’t appear in their Breakout even though he was on the roster.) In person, he looked athletic with clean actions at short and an arm that could be plus at maturity. At the plate, he’s quick to the ball and made hard contact a couple of times against older pitchers. He’s not the biggest guy, and there’s a chance he’s neither quick enough to be an elite defensive shortstop, nor strong enough to hit for enough power to be a lineup regular. Were I scouting for a club, though, with the caveat that I’d need to see him a little more to have adequate conviction, I’d be leaning toward a high-variance everyday grade.
Lucas Ramirez, OF, Angels Manny’s son was a late scratch on my Angels list because I didn’t love his swing or how jumpy he looked in the box. He’s such a twitchy guy, though, and he belongs on the list in some capacity. His hands are fast and he roped a double in a backfield game 111 mph off the bat — three ticks higher than his max output a year ago. His power looks like a potential carrying tool, and while I still have reservations about his swing and approach — particularly with respect to how he identifies and attacks spin, which has eaten him alive as a pro — this is the kind of athlete to stay on even if he struggles early in his career.
Dauri Fernandez, MI, Guardians
Fernandez, while still a lean middle infielder, looks like he’s bulked up in a positive way this spring. It’s the kind of physical projection we were hoping to see, and while he’ll need to continue getting stronger, it’s fair to mentally lump him in with the tier of guys like Robert Arias, Juneiker Caceres, and Gabriel Rodriguez, young Guardos with hit tools and everyday upside.
Cam Day, RHP, Dodgers:
Day was an honorable mention on our Dodgers list this winter due to middling production and a history of wildness. His stuff is diabolical, though, and this spring he’s been sitting 97-99 mph (up from 93-97 last season). That extra velo has burnished both of his breaking balls, and the curve in particular looks like a 70. Day’s delivery is still high maintenance with some excess movement and a wobbly back leg, and he’s probably never going to be a great strike thrower. His arm speed and stroke look a tick faster and quicker this spring. Is that a meaningful change for him? Am I just seeing things, dizzy from the triple-digit heat coming from the sky and radar gun? Let’s check back soon.
Here at FanGraphs, we make a lot of bold predictions. The entire staff makes them in a site-wide exercise that will come out tomorrow. I made 10 more of my own on Effectively Wild. Historically, I made five bold predictions about the season in this space as well. But I’ve been crowded out! Bold predictions are everywhere now. Meg and I came up with a substitute last year, and I enjoyed it enough that I’m bringing it back again: Five big questions about the season. These aren’t the only big questions I have. They aren’t necessarily the biggest questions in baseball. I don’t know the answers to any of them. But all five of these are unresolved questions that will help to shape the 2026 season, and all five fascinate me.
1. Do the Brewers Still Know Best?
The kinds of nerdy fans who read (and write for) FanGraphs have always had a data-driven team to root for. The Moneyball A’s predate this website. The Rays took that blueprint and ran with it. Before the Astros went full banging scheme, they revolutionized player development. The Guardians develop pitchers better than almost everyone else. The Brewers are the latest model; they do things a little bit differently than the rest of the league, according to some internal blueprint, and their plan works. They have the third-most wins in the league over the last five years despite running one of the lowest payrolls. It looks like their run atop the NL Central might continue indefinitely.
Of course, it felt like the previous analytical darling teams would keep their runs going forever, too. The A’s fell off hard after their peak. The Rays look a lot less magical today than they did four years ago. No advantage lasts forever; if you have some kind of secret sauce that truly does work, every other team in baseball will be trying to figure out the recipe.
From the outside, it’s clear that the Brewers do at least three things very well: They develop good pitchers, find fast and athletic position players who deliver plenty of WAR without gaudy batting statistics, and proactively trade established players for prospects who fit their preferred pitching and hitting archetypes. Read the rest of this entry »
This extension, the largest ever for a player with so little service time, begins in 2027, buys out two of Crow-Armstrong’s free agent years, and includes escalators that could increase the value to $133 million. But shockingly, (and to the immense relief of those of us who are still parsing the inscrutable Julio Rodríguez extension), it does not include any option years. Whatever happens, Crow-Armstrong can still hit free agency after his age-30 season. Read the rest of this entry »
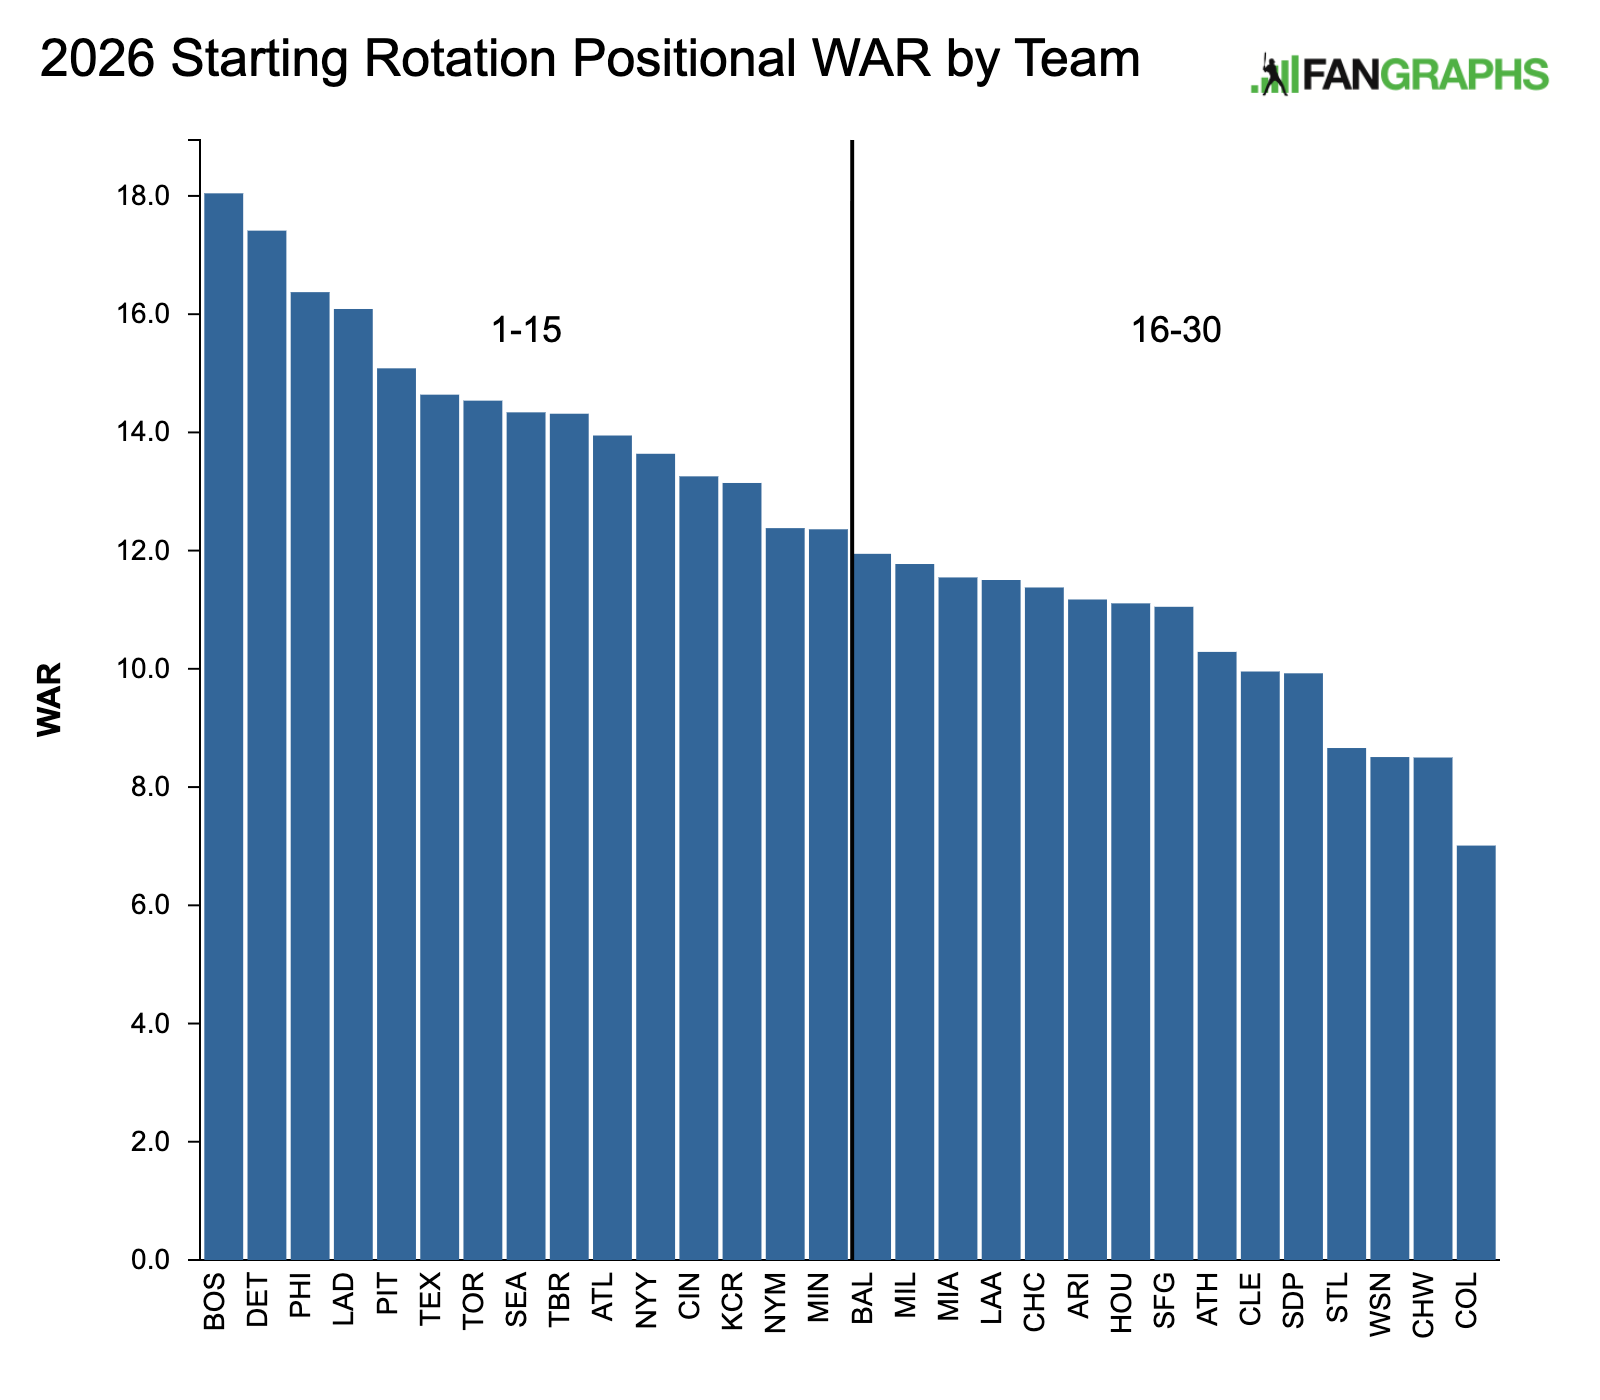
Looking at the best rotations in baseball is a great way to learn about how the best teams in baseball build their staffs. Recently, they’re coalescing around a common plan. It’s hard to get through a 162-game season these days. Five pitchers certainly won’t do it. Every team used at least eight starters last year. Only five teams used fewer than 10 starters, even. You can’t just fill your rotation with five great pitchers and move on with life.
Many of the best teams in the game have solved that issue by building a rotation in two parts. At the top, you’ve got your elite starters, as many as you can get. The top four teams in our rankings have all gone out and proactively added aces in recent years, whether they had some homegrown ones to start with or not. These are the guys who, health willing, have guaranteed spots in a potential playoff rotation.
That said, it usually isn’t possible to assemble an entire playoff rotation out of elite starters, even though you only need four guys instead of five thanks to the postseason schedule. The Dodgers managed it by a) having more money than Croesus and b) signing a unicorn who moonlights as a playoff-caliber starter when he isn’t busy being the best DH in baseball. Everyone else has to solve for two constraints: having enough innings to fill an entire season, and having enough upside that at least one or two of your mid-pack starters will be good enough to pitch in October. Read the rest of this entry »
Mike De Sisti / Milwaukee Journal Sentinel-Milwaukee
At this time time last year, I made a series of predictions. I explained why each team might make it to the promised land, as well as why each team might find itself dead in a pit. We’re running it back this year. Will your favorite team win it all? Will it perish in a factory fire? Here’s how it might go down. Consider these the first- and 99th-percentile projections. Check back for the American League tomorrow.
Arizona Diamondbacks Why They’ll Win It All:Geraldo Perdomo is just getting started. The shortstop had an ugly rookie season at the plate, then jumped to right around league average in 2024. In 2025, he exploded, running a 138 wRC+ and knocking 20 home runs, a 143% improvement over his career mark. He combined that quantum leap in offense with his trademark excellent defense and baserunning, ending up with 7.1 WAR and finishing fourth in the NL MVP voting.
In 2026, Perdomo’s going to make another 36-point jump in wRC+. He’s going to finish with a wRC+ of 174, sock 34 dingers, put up a 12-win season, and dethrone Shohei Ohtani. I mean that literally. He’ll win the MVP, yes, but Perdomo will also walk into the Dodgers clubhouse on Opening Day and yank the ergonomic swivel chair from under Ohtani’s versatile posterior.
Why They’ll Lose It All: Everything I’ve just described will come to pass, for a while. Perdomo will unseat Ohtani and get off to a scalding start, spraying homers all over the greater Phoenix area. Then the Dodgers will come to town for a four-game set in June. For four days, Perdomo will watch Ohtani, just returned from the injury list (coccyx), limp around the bases. After the rubber match, Perdomo will stay in the clubhouse long after everyone has left. He’ll take a look in the mirror. “Who are you?” he’ll ask (though he’ll be munching a protein bar, so it will come out sounding more like, “Froowroo?”). He won’t like the answer. He’ll decide that he liked the old Geraldo Perdomo better. The one who led the league in sac bunts every year. The one who put up league-average seasons like clockwork. The one who never broke any butts. He’ll never hit another home run.
Atlanta Braves Why They’ll Win It All:Michael Harris II is finally going to come out of the gate strong. The 2022 Rookie of the Year has never been an All-Star because despite a career 134 wRC+ in the second half, his first-half mark is a disastrous 80. It’s the most extreme split in major league history. All that will change in 2026. Harris will put up a 134 wRC+ in the first half, and then he’ll still undergo his usual 50-point jump. He’ll be an All-Star, then he’ll be All-World in the second half. The rest of the Braves will get injured. It won’t matter.
Why They’ll Lose It All: In a desperate bid to recapture the glory of the 2021 World Series championship squad, Alex Anthopolous will wheel the soft-serve ice cream machine back into the Atlanta clubhouse. This will prove a mistake, because as it turns out, you have to clean those things. The machine, which had been sitting in a closet since the fall of 2022, will be full of microbiota that qualify as neither toppings nor mix-ins. The entire 26-man roster, the entire coaching staff, and two clubbies will wind up on the IL with tummy trouble. Everyone at Triple-A Gwinnett will get called up at the same time, crucially, before the soft-serve machine is identified as the culprit. They, too, will fall victim to the swirl sickness. Neither the Braves, nor the pipes will recover.
Chicago Cubs Why They’ll Win It All: Because it was foretold in Back to the Future, again. What, didn’t you ever watch Back to the Future Part IV? It was straight-to-video, so I understand if you missed it, but Marty McFly, played by a guy who looked at least a little bit like Michael J. Fox, ends up in 2026, and he can’t come home until his son, Arthur, gets help for his debilitating gambling addiction. It’s quite accurate and thoroughly depressing. Anyway, the Cubs win the Series again, and Arty McFly loses everything and lives out the rest of his life skateboarding across the great Pacific garbage patch.
Why They’ll Lose It All: Some time in May, Pete Crow-Armstrong will go back on a ball and disappear into the ivy. Like, he’ll just be gone. The Cubs will send dozens of people out there after him, poking and prodding the wall, shouting his name. They won’t find a trace of him. A bereft Seiya Suzuki will try to walk through the ivy and join PCA, wherever he is. He’ll just bonk his head on the bricks over and over again. The Feds will shut down Wrigley Field while they conduct their investigation, and the Cubs will play their home games at Rate Field. With PCA on indefinite leave and Suzuki on the IL with a concussion, they’ll post the worst outfield WAR in the league
Cincinnati Reds Why They’ll Win It All: Do you know what Matt McLain has been doing during spring training? He’s batting .529. He’s hit seven home runs in 17 games. He’s got a 301 wRC+. Guess what? He’s going to keep it up. McLain will transition from spring training to the regular season without so much as a hiccup. He’ll never slow down. He’ll hit .700 in the playoffs. Elly De La Cruz will be pretty good, too.
Why They’ll Lose It All: McLain will only be pretty good. De La Cruz will only be pretty good, too. In fact, everyone on the Reds will be pretty good. As it was foretold, Cincinnati will be a medium place. You might think that would make the Reds a medium team, but it’s not that simple. Every inning they play will end in a tie. They’ll never finish a game, except by way of suspension. The whole damn system will break down. They’ll be cast out from the league, and then the sport.
Colorado Rockies Why They’ll Win It All: In a brilliant bit of outside-the-box Moneyball thinking, Paul DePodesta will sign the Rocky Mountains to a contract. “His defect is that he’s literally a mountain range,” he’ll say as he pitches the scheme to Dick Monfort. “Nobody in the big leagues cares about him, because he mountains funny.” Colorado will go from an extreme hitter’s park to an extreme pitcher’s park overnight, since every ball that lands on the ground will have technically been caught by Colorado’s right fielder, literally the Rocky Mountain range. (Brenton Doyle will still keep his job as the center fielder, because have you seen him out there?) The Rocky Mountain range will strike out quite a bit, but nobody will mind it much when it’s holding opponents to a BABIP of zero.
Why They’ll Lose It All: Even with a BABIP of zero, Rockies starters will give up enough homers to end up with 105 losses.
Los Angeles Dodgers Why They’ll Win It All: Inertia.
Why They’ll Lose It All: Entropy.
Miami Marlins Why They’ll Win It All: It turns out that calling pitches from the dugout is a winning strategy after all. The Marlins’ front office quants will read “The Purloined Letter” 15 times in a row, then develop an unbeatable algorithm that calls the perfect pitch for every situation based on the count, the game situation, the pitcher, the catcher, the weather, the time of day, and an extensive psychometric profile of the batter. They’ll stick it in the dugout disguised as a quality control coach and let it cook. Opposing batters will be constantly off-balance. They’ll flail wildly at pitches in the dirt. Their knees will buckle at get-me-over curveballs. They’ll start to think the Miami pitchers can read their minds. They’ll grow paranoid. They’ll second-guess themselves and third-guess themselves. They will have struck out before they even step into the batter’s box.
Why They’ll Lose It All: Some time in April, the other teams will get wise. That coach in the Marlins dugout – the one with the boxy head and boxy torso, who never moves a muscle but whose eyeballs flash a sequence of bright colors after each pitch – isn’t really a coach. The opposing manager will finally ask the umpires to check him out. “That’s just Jerry!” manager Clayton McCullough will shout. “He has a condition!” But the jig will be up. The umpires will tap on Jerry’s hollow cube of a head, and the left side of his mustache will come unglued and flutter in the light breeze. He’ll never call another pitch.
Milwaukee Brewers Why They’ll Win It All: The Bratwurst won’t just win the first 15 runnings of the sausage race. It’ll destroy the other sausages. It’ll keep on running around the entire warning track and lap them. Pat Murphy will sign the Brat to a contract and start it out as a pinch-runner. After a week or two, the Brat will stand alone atop the Baserunning Runs leaderboard. It’ll swipe bases left and right. It’ll tag up on popups. It’ll steal home and slide across the plate before the pitch even arrives. And it’ll do all this in full costume. Murphy will make the lederhosen-clad Bratwurst his everyday center fielder, and it will reward him with thrilling diving catches, a surprisingly accurate arm, a .275 batting average, and 25-homer pop. Jackson Chourio will be pretty good, too.
Why They’ll Lose It All: Just after the Bratwurst earns All-Star Game MVP honors, the Brewers will celebrate with a sausage appreciation night: sausage-making competitions, grilling competitions, bratwurst-eating contests, kids in sausage costumes, the whole nine yards. But while handing out an award to a local sausage-maker right in front of home plate, the sure-footed Bratwurst will trip and tragically stumble directly into a running sausage grinder. To the horror of 41,900 celebrants, it will return to its previous state, an unformed pile of meat (with veins of lederhosen mixed in there, too). The crowd will watch in stunned silence as all of the sausage-makers on hand try in vain to put the Bratwurst back together again. The entire state of Wisconsin will go into mourning. The Brewers will play out the string lifelessly. Murphy will take a flier on the Polish sausage, but it’ll keep getting doubled off because it doesn’t understand the tag-up rule.
New York Mets Why They’ll Win It All: It turns out that right field was the problem for Juan Soto all along. After a career of unrelenting defensive ghastliness, he’ll be great in left field. He’ll be… well, he still won’t be elite out there. But he’ll be quite good, and all of a sudden, his game will have no weaknesses at all. He’ll have an average Juan Soto season at the plate, steal another 35 bases, and all of a sudden, that 158 wRC+ will put him in line for a nine-win season. He’ll carry the Mets into the playoffs.
Why They’ll Lose It All:Francisco Lindor will miss his hamate bone. The surgery won’t hinder his performance at the plate – at least not physically. He’ll just miss it, you know? He once had a whole hand full of bones, and now he’s got a missing piece. He’ll feel incomplete, distracted, and the rest of the Mets will follow their leader. They’ll never quite get it together. They’ll always feel like something’s missing, even if they can never quite name it.
Philadelphia Phillies Why They’ll Win It All: The Lord will look down upon Philadelphia, see a team that just agreed to devote a quarter of a billion to pitchers named Jesús and Cristopher, and the Lord will smile.
Why They’ll Lose It All: Measles and listeria will sweep through the clubhouse. No one will say out loud who’s responsible for it, but everyone will know.
Pittsburgh Pirates Why They’ll Win It All: Because they might actually be good. Maybe? Possibly? They might, like, just have a good team. With good players? I know, I know. But it’s possible. Maybe.
Why They’ll Lose It All: At a certain point, Paul Skenes will decide that he’s sick of losing at baseball and go back to the Air Force Academy.
San Diego Padres Why They’ll Win It All: Welcome to the Nick Castellanos Revenge Tour. Castellanos will work his way into the starting lineup by hook or by crook, and he will unleash unholy fury upon the baseball for the sole, spiteful purpose of making sure the Phillies know exactly what they’re missing. He’ll slug hellaciously, and he’ll step up as a clubhouse leader to lift the rest of the Padres with him. It’ll be like that scene in The Natural where the New York Knights actually look like a baseball team during practice. His defense will still be pretty bad.
Why They’ll Lose It All: Joe Lacob, owner of the Golden State Warriors, is known to be in the running to purchase the Padres, and he’ll have the winning bid. San Diegans will rejoice now that the man who oversaw a dynasty in Oakland (then promptly moved it to San Francisco) has just purchased their team. But Lacob will have learned all the wrong lessons from the success of the Dubs. He’ll trade what little is left of the farm for Trayce Thompson. He’ll sign Xzavion Curry. He’ll hire Draymond Green to manage the Padres, and that will go exactly as well as you might expect it to go. He’ll move the team to LA.
San Francisco Giants Why They’ll Win It All: Remember when Luis Arraez played in Miami and put up a career-high 131 wRC+ dumping weak liners into that enormous outfield? Well, he’s finally landed in San Francisco and found himself another big old outfield. He’s going to go back to hitting .350, and he’s going to teach Jung Hoo Lee all his tricks. Matt Chapman and Rafael Devers are never going to come to the plate without a couple runners on base.
Why They’ll Lose It All:Logan Webb can’t start every game.
St. Louis Cardinals Why They’ll Win It All: The Cardinals will try something new in the outfield. They’ll turn Victor Scott II loose. “Any ball you can reach, you go get it,” Chaim Bloom will tell him. This newfound freedom will strike Scott as a revelation. He’ll finally realize that the artificial boundaries separating center field from left and right are just that. Artificial. Limitations keeping him from unlocking his true potential. The scales will fall from his eyes and he’ll range through the outfield like a holy wind, catching everything there is to catch. Jordan Walker and Lars Nootbaar will take to positioning themselves directly on the foul lines, content to steal outs on the occasional would-be foul ball while Scott takes care of the rest. The Cardinals will have the best defense in the league.
Why They’ll Lose It All: They’ll still need some hitters.
Washington Nationals Why They’ll Win It All: Pass.
Why They’ll Lose It All: In an odd mathematical quirk, it turns out that it’s really hard to have a successful season while losing more than 90 games. Let’s just give Paul Toboni some time.
When you run a lot of projections, one thing you have to get used to is being very wrong, very often. The ZiPS projections generally run about 4,000 players every year, meaning you should expect around 800 players to either achieve their 90th-percentile projection or fall short of their 10th-percentile projection. Those hundreds of results will invariably be quite a distance away from the standard midpoint projections that you see.
As is my ritual, it’s time to run my two articles discussing my favorite booms and busts of the upcoming season. After looking at the hitters last week, today we turn our attention to the pitchers. But just to keep the ritual of humiliation fully transparent, we’ll start by looking at the pitchers I selected for last year’s booms and busts.
Thank goodness I was wrong about Jacob deGrom, as he managed to have his first essentially healthy season in forever! I think it’s finally time for me to get off the Brandon Pfaadt train, meaning he’ll probably have his breakout this year. A real mixed bag, but it was overall a less bleak result than I had with the hitters! Read the rest of this entry »