Teel is set to begin the season on the injured list. He pulled his hamstring while legging out a double for Team Italy last week at the World Baseball Classic. The diagnosis is a Grade 2 strain, which could keep him out for most of April. It’s an unfortunate start to what was meant to be his first full big league season.
In some ways, this answers a crucial question for the White Sox: Who will start at catcher on Opening Day? Teel, 23, would have been the obvious choice for most rebuilding organizations. He was a top 100 prospect last year before his debut in June, and he then posted a 125 wRC+ in 297 plate appearances. He’s at the forefront of Chicago’s burgeoning prospect pipeline and a key figure as the organization searches for its next core.
But the same can also be said for Edgar Quero, a similarly rated prospect who debuted last year at just 22 years old. Quero is now set for the starting job right out of camp, and he’ll have the first chance to showcase his development in 2026. Read the rest of this entry »
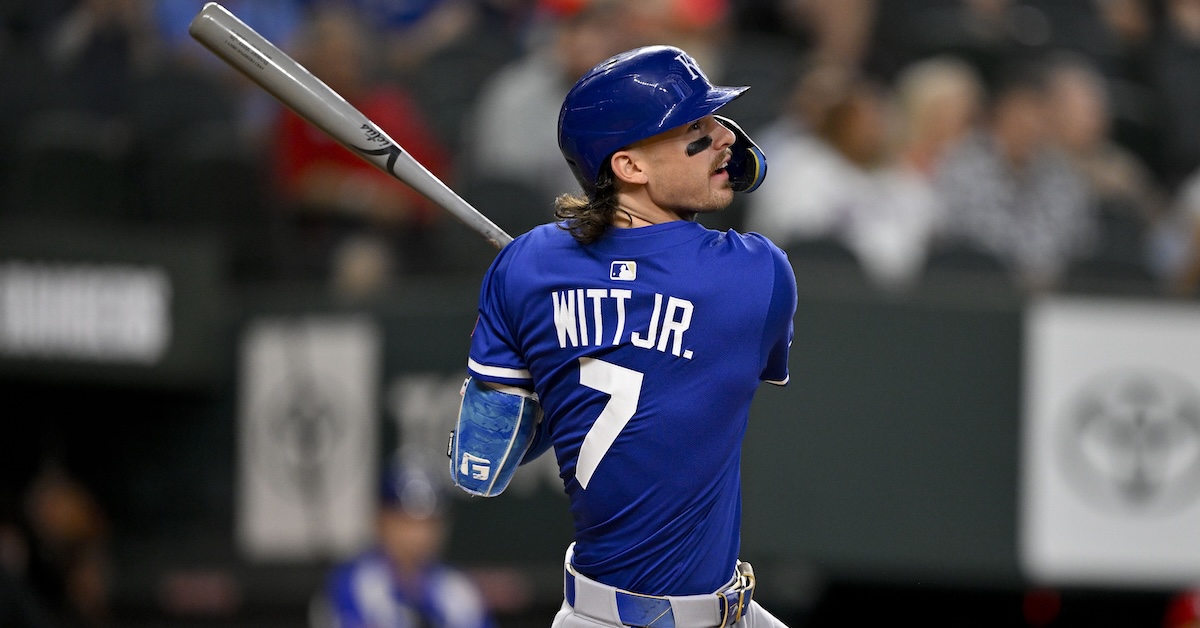
I’m somehow nearing 50 years of age — I’m a little concerned this number seems to be going up by one every 365 days or so — and the position of shortstop has changed a lot since I got into baseball as a small child. Back then, the attitude was defense is what mattered from shortstops, and anything else a team got from the position was gravy. In 1978, the year I was born, only four primary position shortstops with 300 plate appearances had a wRC+ of at least 100: Roy Smalley III, Dave Concepcion, Robin Yount, and the eternally underrated Toby Harrah. Only Smalley and Harrah even hit the double digits in home runs. In 2025, 25 primary position shortstops had double-digit home run totals and 19 finished with a wRC+ in the triple digits. An average player at the position in 1978 slashed .258/.309/.335, a line that would cause teams of today to look for an upgrade unless their shortstop were Ozzie Smith with the glove.
While there were always scattered shortstops who excelled at the plate, they were generally seen as outliers. But that changed as teams became more and more willing in the 1980s and 90s to let their best athletes stay at shortstop until they conclusively proved they shouldn’t be at the position, and larger players like Cal Ripken Jr. and Alex Rodriguez weren’t simply moved to traditional “big dude” positions. Defense remained important, but offense became a really big deal, as many talented hitters demonstrated that previous generations were too quick to move young sluggers down the defensive spectrum. Shortstops are like quarterbacks now; you either have a star shortstop or you’re biding your time until you find one. Read the rest of this entry »
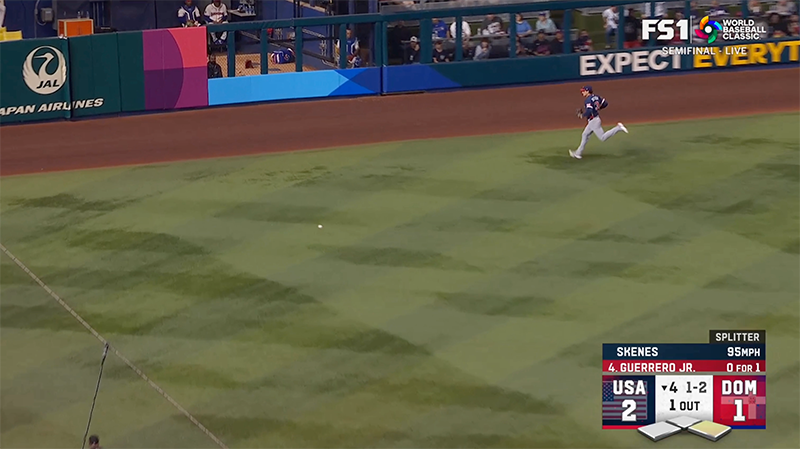
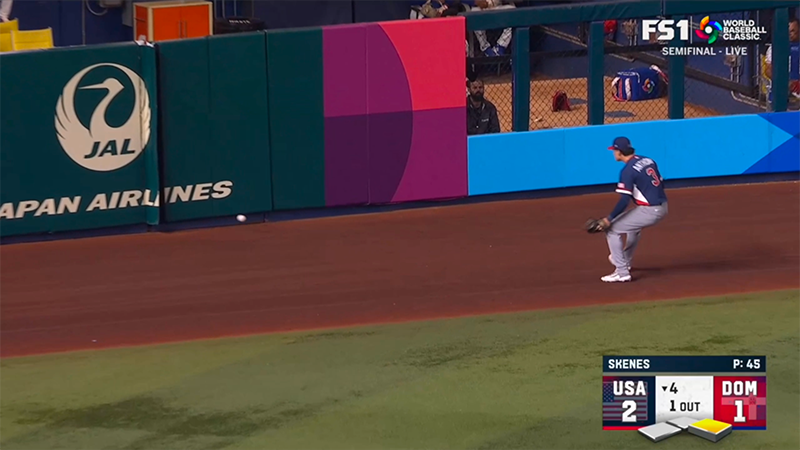
The hardest-hit ball of the World Baseball Classic semifinal between the United States and the Dominican Republic only traveled 191 feet. Vladimir Guerrero Jr.’s fourth-inning double left the bat at 116.1 mph, but it was just the 23rd-longest batted ball of the game, a few feet behind a Ketel Marte popout that was hit more than 40 mph softer. None of this was necessarily shocking. After the play, John Smoltz revealed even he was aware that sabermetric types wish Guerrero would find a way to lift the ball more often and turn some of his scorched groundouts into extra-base hits and extra-base hits into home runs.
This decade, 26% of balls hit 116 mph or harder have gone for home runs, and the lowest launch angle among those home runs was 15 degrees. Guerrero hit his double at just five degrees, and over the past five years, he ranks fourth in baseball with 28 non-homers of at least 116 mph. Five degrees is not the optimal launch angle if your goal is to do damage, but hitting a ball that low and that hard can have other benefits.
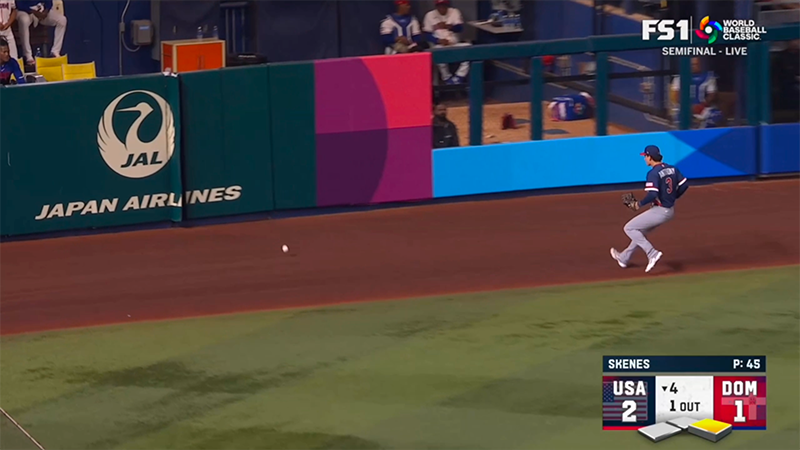
One benefit is that the ball can really slow down on its way to the wall. When you hit a screaming line drive or a high fly ball to the wall, it maintains much of its velocity and bounces off hard. When you hit a low liner or a grounder, all that contact with the outfield grass slows it down. Hard as it was hit, this ball didn’t have all that much velocity left, and the padding on the wall absorbed much of the remainder. It rolled back across the warning track and likely would have stopped entirely as soon as it encountered the grass. The outfielder has to wait back, wary of a hard carom bouncing past them, so when the ball dies like that, they need extra time to go get it, giving you more time to coast into second or stretch for third.
A weak carom also carries aesthetic benefits. When a ball is moving that slowly, you can’t field it normally. Below a certain velocity threshold, gloves are more hindrance than help. If you’re picking up a stationary baseball, or one moving at anything below a brisk walk, say 5 mph, it’s harder to pick the ball up off the ground with a glove than it is with your bare hand. Stiff leather fingers aren’t as sensitive or as flexible as real fingers, and the ball doesn’t have enough momentum to roll up into the pocket. Since you have to get the ball to your throwing hand anyway, you’re better off cutting out the middle man and barehanding the ball. It happens every day, but usually it happens for infielders who are dealing with bunts or squibbers. They charge hard, then scoop up the ball and throw it in one motion. It’s a thing of beauty, but it works quite differently in the outfield.
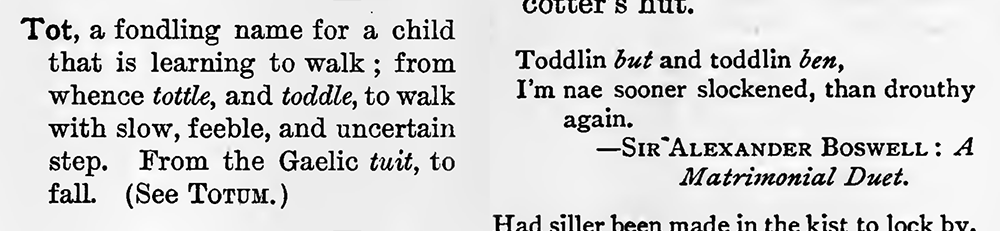
How much have you thought about the word toddler? As you can deduce, it means one who toddles, walking “with short tottering steps in the manner of a young child,” according to Merriam-Webster. The word first appeared in the early 16th century. There were tots, and the way they got around became tottering and tottling, which then became toddling. Finally, a good 300 years later, those tots who toddled became known as toddlers. (Who knows, they may have even enjoyed the occasional hot toddy. It was a different time.)
A Dictionary of Lowland Scotch, Charles Mackay, LL.D., 1888
Of course, toddling isn’t the only hallmark of a toddler. Our balance, motor skills, and proprioception evolve (and then devolve) over time, so we end up moving very differently at each stage of life. For example, when adults bend over to pick something up off the ground, they bend at the waist, but they also tend to put one foot in front of the other and go into a slight lunge to bring their torso closer to ground level. Toddlers have a different approach, getting into a deep crouch and reaching for the item while it’s still way out in front of them. They tuck their chests against their knees and they have to stick their elbows out to make room. Because they’re not yet champions of spatial awareness, they don’t often nail the location of their squat, which is the reason they often end up reaching way out or way across their bodies.
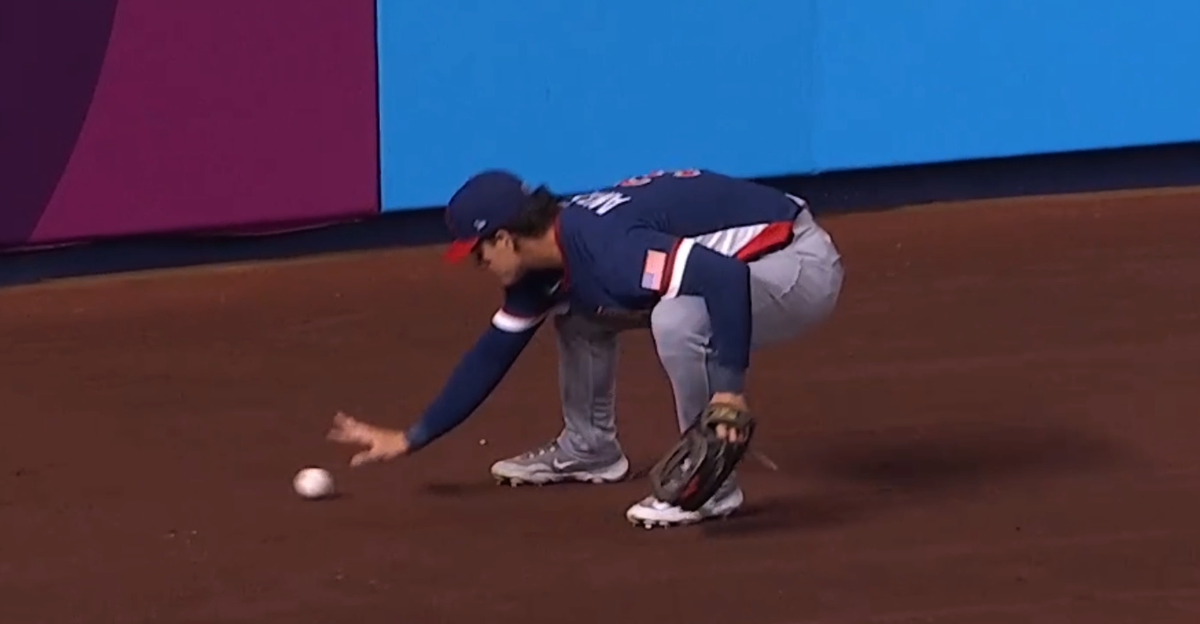
I bring all this up because when Roman Anthony, playing left field for the United States at the time of Guerrero’s blistering low-launch-angle double, loped out to the warning track to field the ball, I couldn’t help but notice that he didn’t exactly look like the Greek god, top-prospect-in-baseball, uber-athlete we’ve come to expect. He looked, uh, different.
Anthony looked either like a toddler playing with a toy dump truck or a grown man doing a pretty convincing impression of an anteater. I’m going to be honest with you. I went through a bunch of pictures of my nieces and nephews, and it didn’t take long to find a photo of a niece in the exact same pose. She’s two years old, and she’s not wearing a shirt or pants because she was just playing in the sprinklers. She’s crouched down to pick up a worm from the garden. She looks exactly like Anthony in the picture above, and I wish I could show you the two side-by-side in the Miami outfield, which I absolutely mocked up in Photoshop. Alas, I cannot do that to my niece, who is no longer two years old.
How did Anthony get into this position? For starters, in the outfield, you’re no longer scooping the ball up gracefully and firing it on the move. The weak carom is the only situation where you have to barehand the ball, and you’re always moving away from the infield to get it, which means you’re running, stopping to pick up the ball, then reversing your momentum to throw it into the infield. It’s a halting, graceless maneuver at the best of times. But other outfielders seem to manage it. Here are Anthony’s Red Sox teammates, Nick Sogard and Wilyer Abreu, making similar plays.
They chop their steps and time things so that the ball arrives between their feet rather than way out in front of them. They get low to field the ball, but their chests aren’t tucked tightly against their knees. They still look like athletes. To be fair, they’re also benefitting from a more flattering angle, but let’s break down the video of Anthony on Guerrero’s double frame by frame just to make sure we understand the progression.
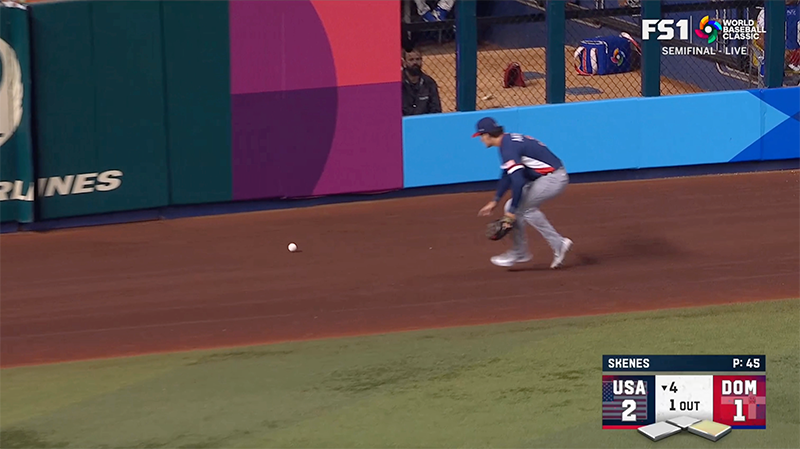
Here’s Anthony running after the ball with his trademark long, graceful strides. He’s a 6-foot-3 miracle with a 55 current value on his run tool.
Next, here he is putting on the brakes. He may be slowing down, but the picture is still alive with movement as he powers down into a hover.
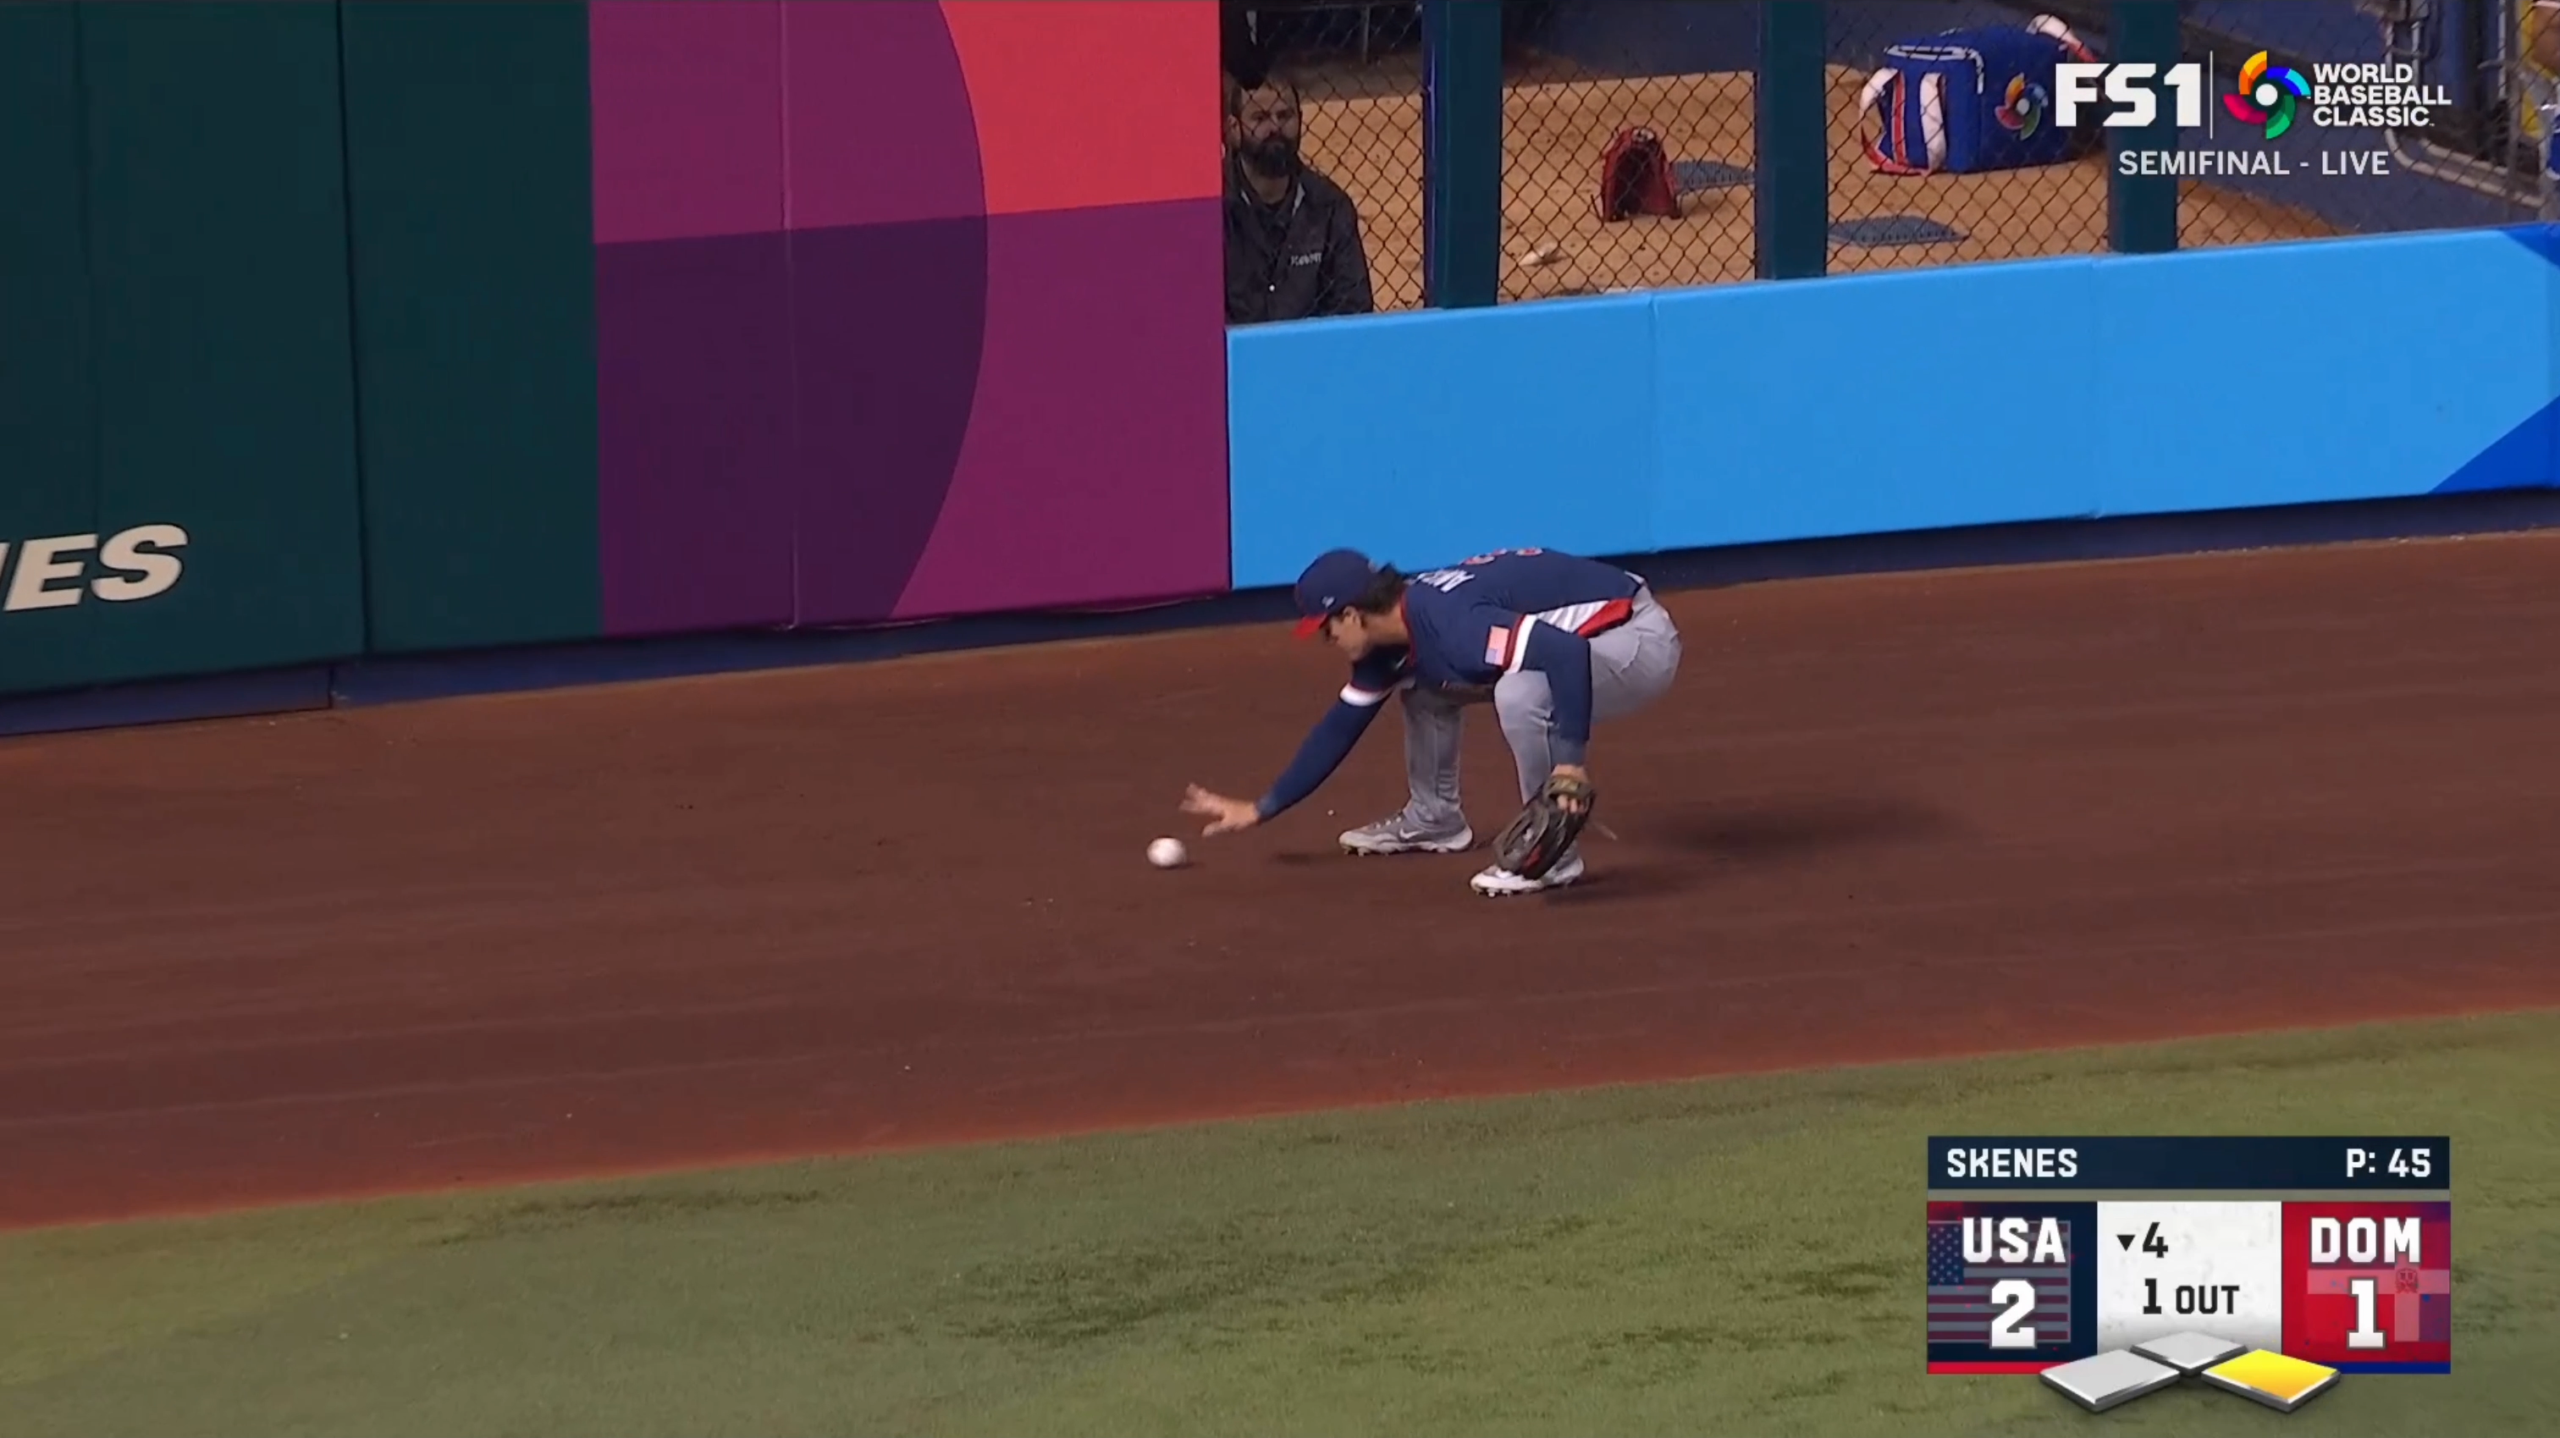
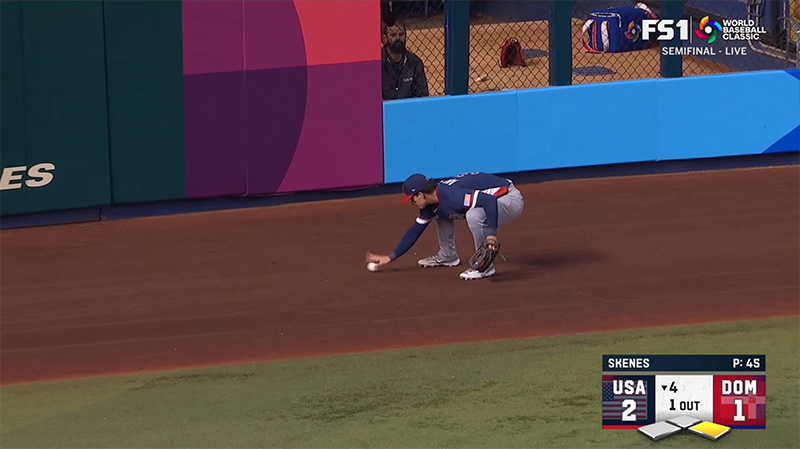
And here Anthony is, settling into a defensive crouch as he awaits the carom off the wall. He’s low, he’s alert, he’s ready for anything. Wherever this ball decides to bounce, he’s about pounce.
Um, so this is Anthony scuttling like a crab. He’s scuttling like a crab now. The ball didn’t so much bounce off the wall as it did die on the wall, and Anthony just kind of stayed in the crouch and started – sorry, scuttling is really the only word I can think of that applies here – toward it.
So this is the difference between a professional athlete and a toddler. When the right leg is still extended, planted in the ground for maximum leverage, the foot digging into the dirt at an angle, Anthony is a force to be reckoned with. Once the right leg is bent, he’s completely flat-footed, knees to his chest, left elbow stuck way out to the side so he can wrap his arm around his leg; he’s everyone’s nephew, powerless to stop himself from befriending a worm.
This is the frame that really takes it over the toddler top. For some reason, Anthony doesn’t grab the slow-moving ball with his fingers. He reaches out with his hand angled back. It looks like he doesn’t know what to do, so he’s just going to slap the baseball. He lets it get deep into his palm and grabs it with his whole hand. Professional baseball players do not grip the baseball that way. They have enormous hands and get a four-seam grip, holding the ball with their fingertips. There’s air between the ball and their palm. When Anthony finally picks up the ball, he holds it the way you might cradle a melon.
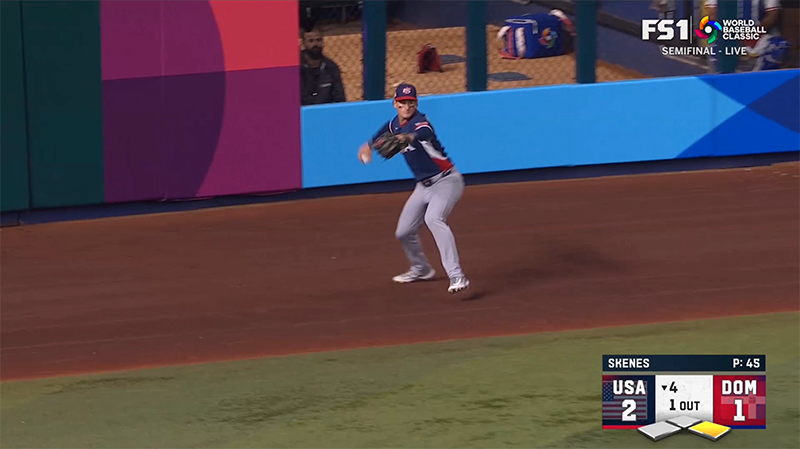
After that, sadly, Anthony returned to his usual status as a fearsome baseball warrior blessed with grace and agility.
Anthony has a long career ahead of him, and he will awe us with many astounding feats of power and dexterity. For now, though, let’s make sure we treasure this memory of him as an adorable toddler before he hits the terrible twos.
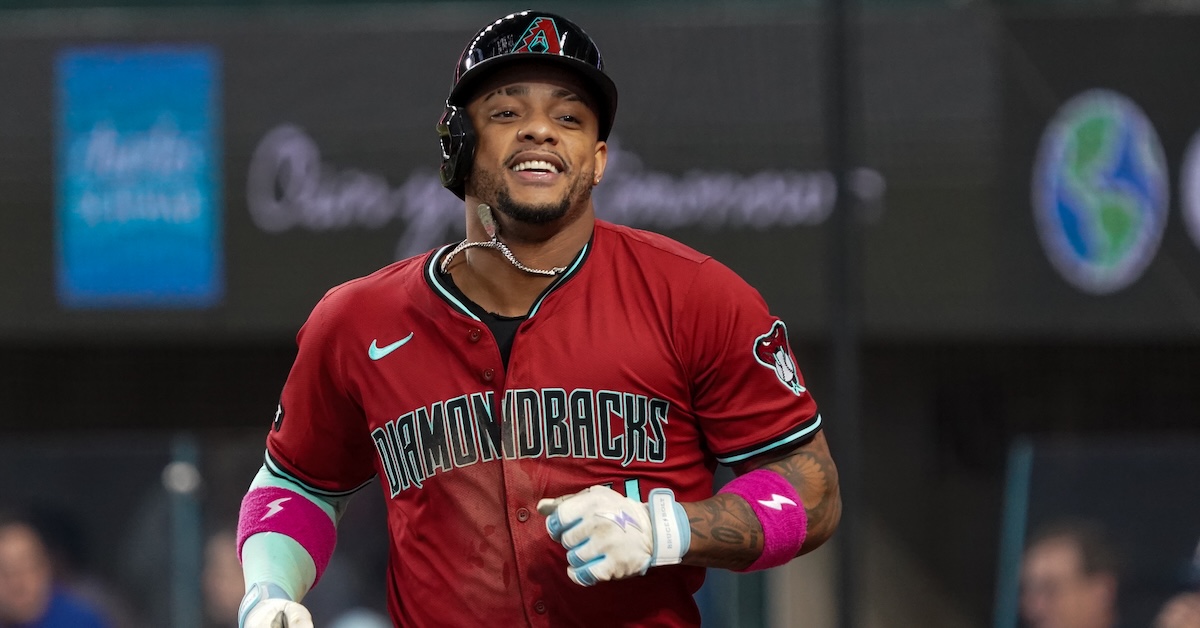
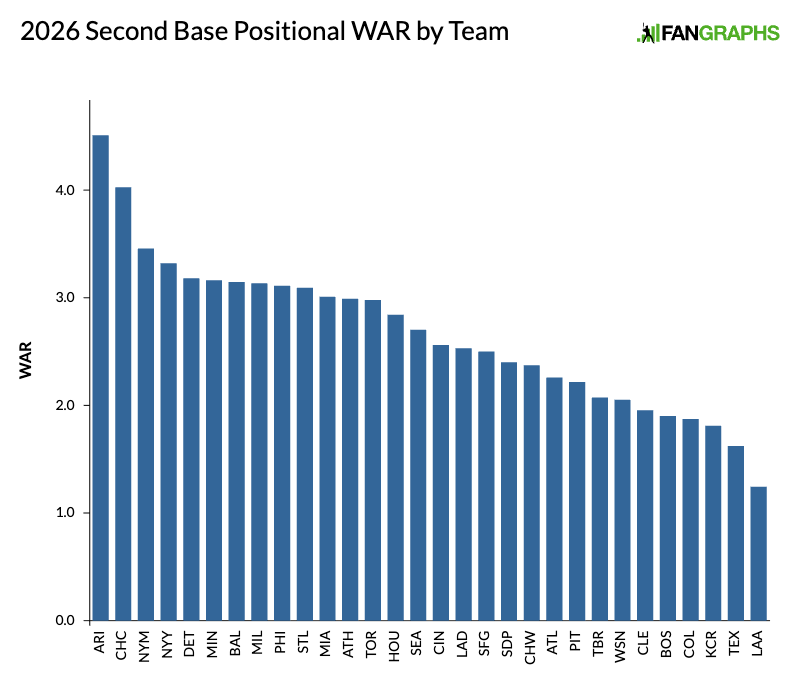
Second base can be a bit of an unglamorous position; what is a second baseman, after all, but a failed shortstop? Indeed, the keystone is light on true superstars but heavy on solid regulars. The difference between third place and 13th, in our projections, is just half a win. A few teams in the bottom half of the ranking are bringing in exciting young players, too, so a low ordinal ranking does not necessarily indicate that the team’s second base situation is a lost cause.
It might please you to learn that second base in 2026 is also a position for interesting players: guys with extreme tool sets, speedsters, glove-only wizards, high-contact/no power dudes. It’s like they put the Statue of Liberty at second to exhort the sport’s most unorthodox hitters to congregate at this position. There’s something for everyone here. Read on, you’ll see. Read the rest of this entry »
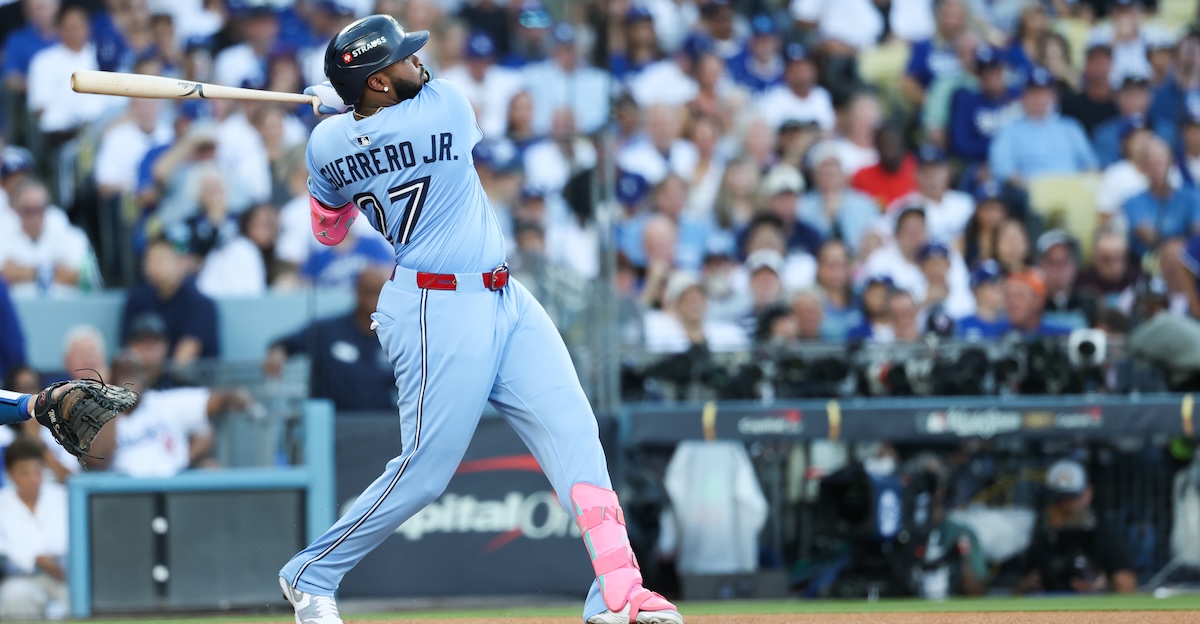
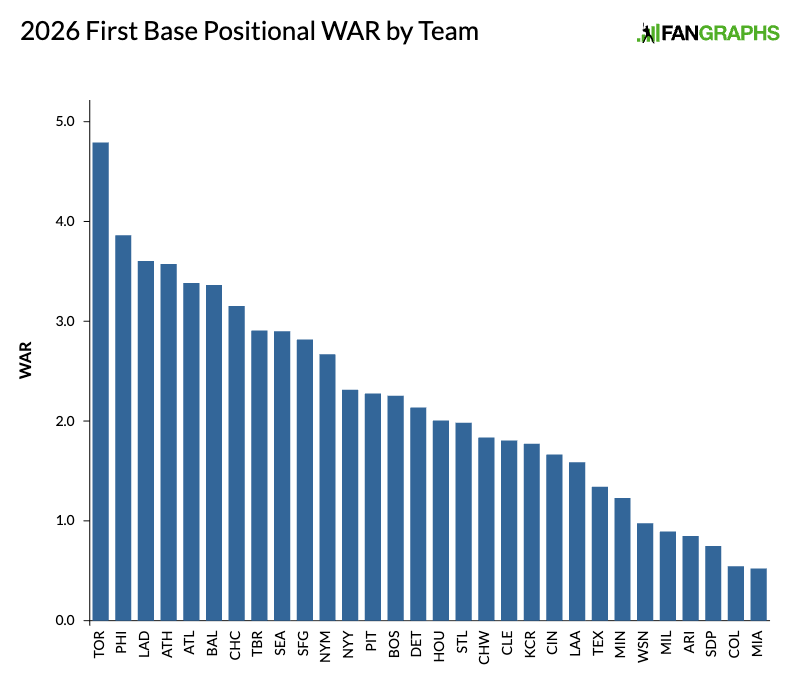
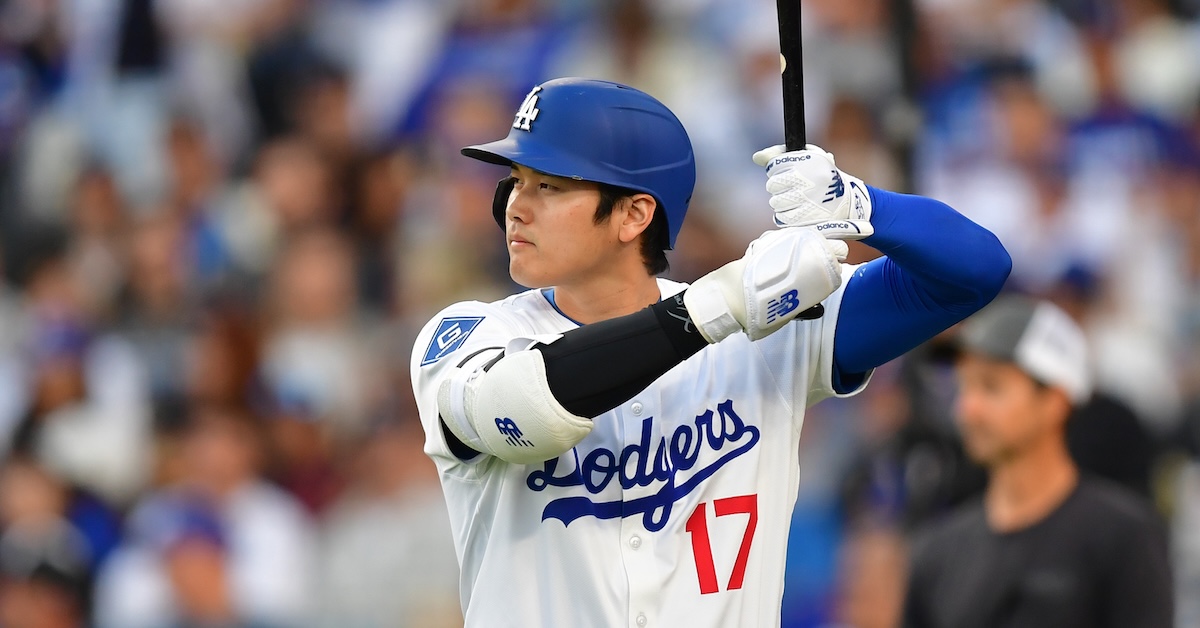
Vladimir Guerrero Jr., Bryce Harper, and Freddie Freeman walk into a bar — the same bar, in fact, as the one they walked into last year, and in the same order; the trio and their assorted backups topped these rankings in 2025, just as they do in ’26. But where they towered over the rest of the field last year, with a full win gap between the third-ranked Dodgers and the fourth-ranked Rays, this time it’s only Guerrero who’s separated from the pack. The 0.9-WAR gap between the Blue Jays and Phillies is just 0.1 WAR less than the gap between those Phillies and ninth-ranked Mariners.
It’s not hard to understand what’s happening. Guerrero is 27 years old, and if he didn’t have his best season by the numbers in 2025 — though a half-billion dollar extension and a near-miss of a championship is still a pretty great year — our projections suggest he’ll rebound. Harper, on the other hand, is 33 and Freeman 36, and while they remain championship-caliber players, both are increasingly prone to the aches and pains that can leave a mark on their performances, as explained below.
It’s not just that those older guys are past their peaks — likely future Hall of Famers, but trending down just the same — it’s that an influx of younger talent is pushing the middle of the pack upward. The 23-year-old Nick Kurtz, 27-year-olds Ben Rice and Jonathan Aranda, and 28-year-olds Michael Busch and Josh Naylor all rank among this year’s top dozen; none was the primary first baseman on a team ranked above no. 14 last year. Read the rest of this entry »
Curt Hogg-USA TODAY NETWORK via Imagn Images, Mark J. Rebilas and Jay Biggerstaff-Imagn Images
When the Royals traded for Isaac Collins in December, I praised the move. I understand that there are limitations to a 5-foot-8 corner outfielder who showed his first signs of major league life at age 27, but the man hit .263/.368/.411 last year, and the Royals — a team traditionally in dire need of live bats — only gave up a middle reliever to get him.
A Royals fan on Bluesky asked me how to feel about that move when it happened, and I answered thusly: “I think it’s a steal, as long as you make your peace with the small but non-trivial possibility that the Brewers turn Angel Zerpa into Josh Hader.” Read the rest of this entry »
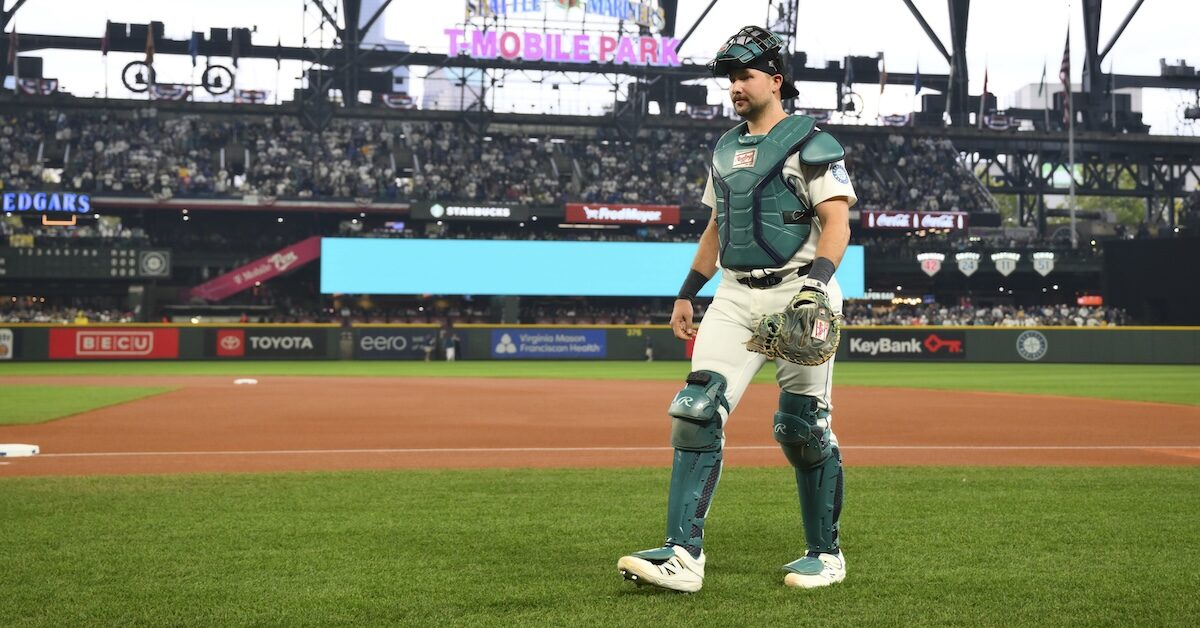
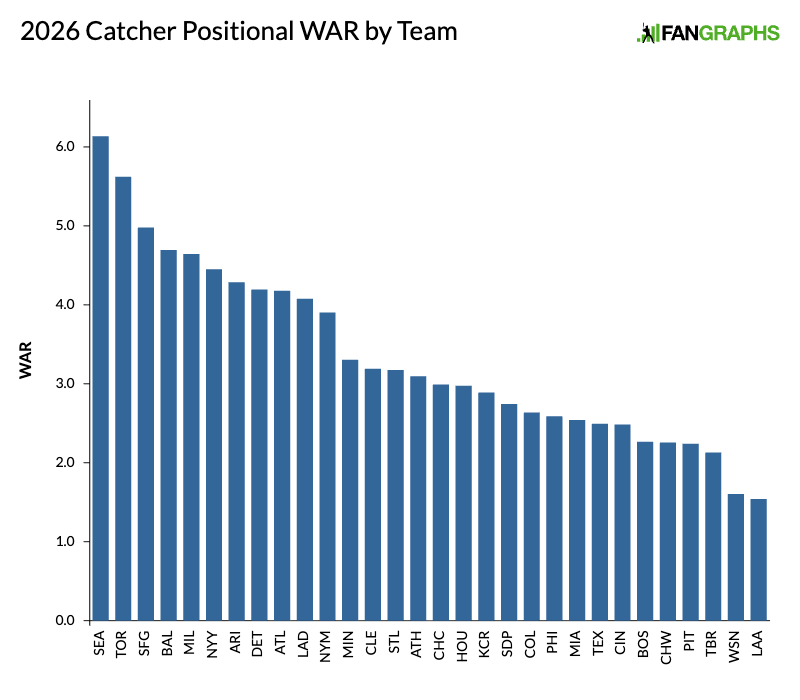
This season has the potential to be an odd one for catchers. None of us knows exactly how the ABS challenge system will affect the way they go about their job, but all of us will be paying close attention. We’re a couple years into the one-knee-down revolution, and while the conventional wisdom was that it would help keep them fresher and allow them to play more innings, the top 30 catchers in terms of innings caught actually caught fewer innings in 2025 than they did in 2024.
The top of the list is fun. We’ve got 60-homer Cal Raleigh in his own stratosphere, William Contreras in his shadow, and Patrick Bailey one-tooling his way to the top tier. We have deep teams like the Blue Jays and Yankees, Rookie of the Year Drake Baldwin, rookie Gold Glover Dillon Dingler, and veteran Will Smith, who became an entirely different hitter at age 30. And nobody knows what to expect from Adley Rutschman.
Welcome to the 2026 positional power rankings! As is tradition, over the next week and a half, we’ll be ranking every team by position as we inch closer to Opening Day next Thursday. As I note every year, this is something of a funny exercise. You read FanGraphs regularly, after all — a fact for which we are very grateful — and are well-versed in the various signings, trades, and injuries that have occurred over the offseason. You know that Kyle Tucker is now a Dodger, that the Blue Jays signed Dylan Cease, that the Cardinals traded away most of their veterans, and that the injury bug has bit much of the Braves rotation. And yet, you’re still keen to know more about the game and what it might look like between now and October. The positional power rankings are our answer to that impulse.
This post serves as an explainer for our approach to the rankings. If you’re new to the exercise, I hope it helps to clarify how they are compiled and what you might expect from them. If you’re a FanGraphs stalwart, much of this will be familiar, but I hope it’s a useful reminder of what we’re up to. If you have a bit of time, you’ll find the introduction to last year’s series here. You can use the navigation widget at the top of that post to get a sense of where things stood before Opening Day 2025, a spring that saw a number of players who had signed record-setting free agent deals report to their new teams.
Unlike a lot of sites’ season previews, we don’t arrange ours by team or division. That is a perfectly good way to organize a season preview, but we see a few advantages to the way we do it. First, ranking teams by position allows us to cover a team’s roster from top to bottom. Stars, everyday contributors, and role players alike receive some amount of examination, and those players (and the teams they play for) are placed in their proper league-wide context. By doing it this way, you can more easily see how teams stack up against each other, get a sense of the overall strength of a position across baseball, and spot the places where a well-constructed platoon may end up having a bigger impact than an everyday regular who is good rather than great. We think all of that context helps to create a richer understanding of the state of the game and a clearer picture of the season ahead. Read the rest of this entry »
Angelina Alcantar/News Sentinel-USA TODAY NETWORK via Imagn Images
Several times during the last half decade, Major League Baseball has piloted rule changes in the minor leagues, some that have already been implemented at the highest level and others that remain purely experimental. Over the weekend, I learned about a league memo circulating among baseball operations departments regarding various experimental rule changes that will be tested during the upcoming minor league season; I then acquired the document from a club source.
This memo, which has not been previously reported, was sent to general managers, assistant general managers, farm directors, and player development personnel with the request that it be relayed to managers and coaches throughout the organization. I have excerpts from the memo below, as well as some thoughts spawned by its contents. Some of the rule changes being piloted in 2026 are aimed at augmenting the game’s aesthetic, others at further increasing the pace of play. Some of them seem like they’re for player development purposes only and not likely to be a future big league feature. Read the rest of this entry »
Content warning: This piece contains historical photographs of a racist effigy being hung from a school building. They may be upsetting to readers.
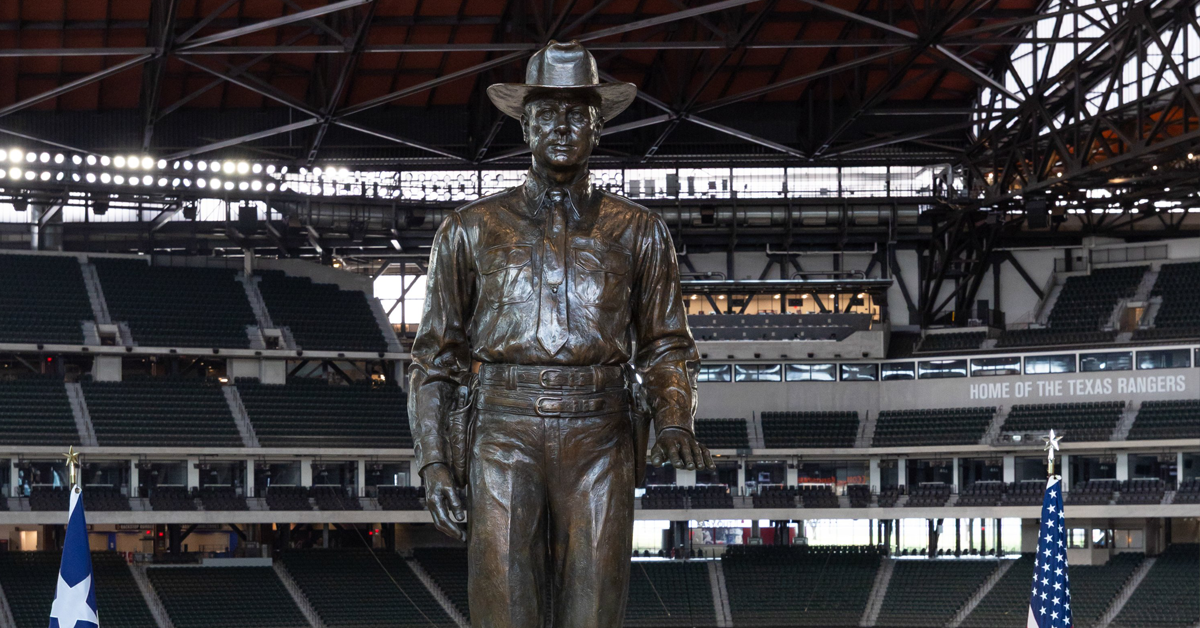
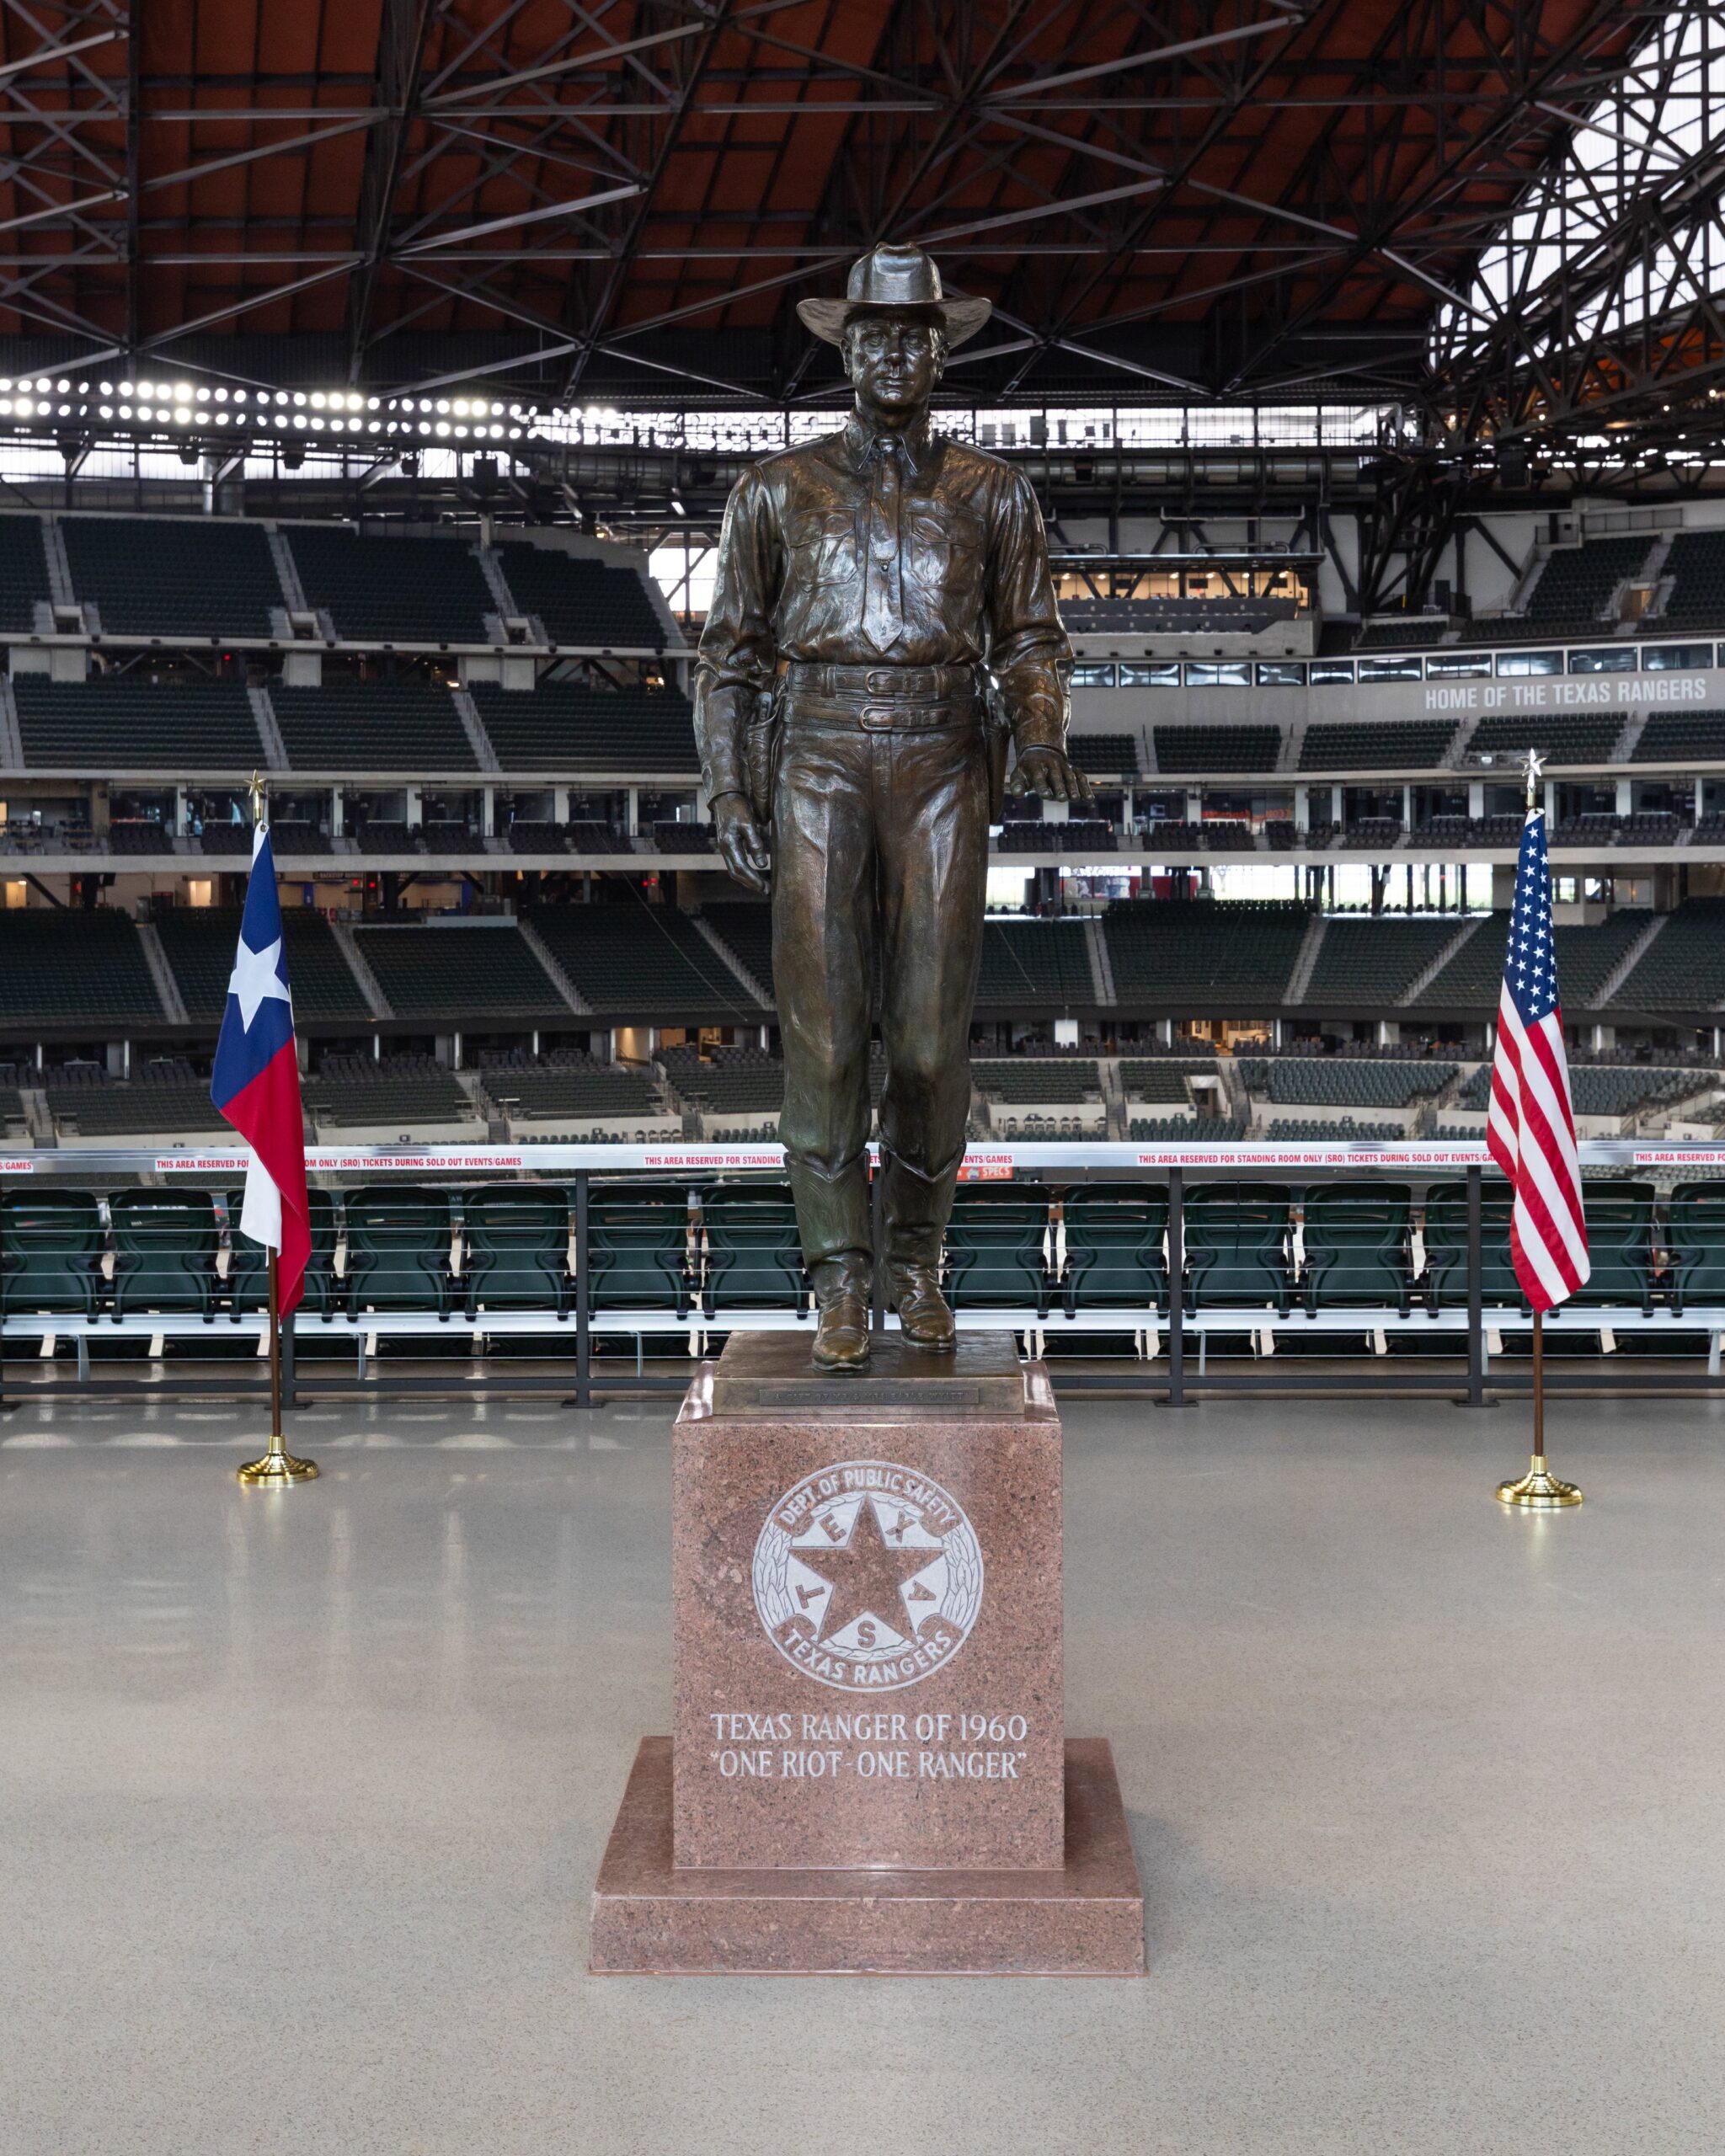
The Rangers host the Royals for a two-game series starting on March 23. It’s their final tuneup before Opening Day, and the first time Rangers fans will enter Globe Life Field this year. Those who filter into the ballpark through the TXE Energy North entrance will encounter a 12-foot-tall bronze statue of a Texas Ranger – not a ballplayer, but a lawman – in the left field concourse, his extended left hand instructing them to calm down, his right hand hovering next to his pistol. The Ranger stands atop a red stone base engraved with the agency’s logo and the words:
TEXAS RANGER OF 1960
“ONE RIOT – ONE RANGER”
The team has been unusually quiet about the statue, offering little context about its provenance or significance. An unveiling ceremony was held the morning of Monday, March 2, but reporters weren’t informed about it until the night before, and they weren’t invited to ask questions. Majority owner Ray Davis’ remarks were brief and vague. Posts on the team’s social media accounts showed only a picture of the statue beneath the text, “New addition to the concourse.” A press release revealed some details about the statue, the name of the sculptor and where it once stood, but it said nothing about how the statue ended up at the ballpark.
This is the story of how the statue arrived at Globe Life Field, but it’s not the story of why the team decided that it belongs there. Only the team can tell that story, and it is not interested in doing so. Last week, in response to an emailed list of questions, a club spokesman referred FanGraphs to the team’s initial press release.
“One Work That Will Really Live Down Through the Ages”
Though often referred to as “One Riot, One Ranger,” the name of the statue is “Texas Ranger of Today,” and it was created by prominent San Antonio sculptor Waldine Amanda Tauch. It was commissioned in 1959 by the Dallas Historical Monuments Commission and paid for with a $25,000 donation (made anonymously at the time) from restaurateur Earle Wyatt. Tauch’s design beat out those of three other artists. “He will be a two-gun man — with one hand on his gun — who is entering the scene of a fight,” she told reporters. “He will be a man that everyone respects and trustfully looks upon as law and order.” Tauch had ambitions for the statue, saying, “I would like to leave some one work that will really live down through the ages.” Oddly, the Ranger is posed nearly identically to Tauch’s 1969 sculpture of General Douglas MacArthur. On April 30, 1961, the statue was dedicated at Dallas Love Field Airport. Apart from temporary stints at Union Station and the Frontiers of Flight Museum, it stayed at Love Field until 2020, when professor Doug Swanson published a book called Cult of Glory: The Bold and Brutal History of the Texas Rangers.
The book was an attempt to tell the story of the Rangers, separating truth from myth without shying away from the darkest chapters of the organization’s history, such as the atrocities committed during the Mexican revolution. According to the Bullock Texas State History Museum’s account of the Porvenir Massacre, “Texas Rangers were sent to patrol the border, but rather than enforcing the law impartially, they participated in and often instigated the killing of hundreds of ethnic Mexicans between 1914 and 1919.”
The phrase “One Riot, One Ranger,” has become an unofficial motto for the Texas Rangers Division. There are differing accounts of its origin. The most famous references an incident from 1896, when Captain Bill McDonald was charged with breaking up an illegal prizefight. Local officials were dismayed that only one Ranger arrived to deal with the unrest. Replied the Ranger, “You only have one riot, don’t you?” In a phone interview, Swanson tried to explain how the Rangers acquired their larger-than-life reputation. “In part, it’s because they helped make Texas what Texas is,” he said. “They helped settle Texas, for lack of a better word. They were the people who fought the Native Americans; they were people who fought outlaws. They fought in the Mexican-American War, all of that. They had this long history. At the same time, they’ve been really good at promoting themselves as these superhuman lawmen who do nothing except engage in justice and honorable behavior and fight on the side of right – which they have in many cases, but which they haven’t in many cases.”
A Pulitzer Prize finalist, Swanson spent 34 years at the Dallas Morning News. He was also “a huge Rangers fan” who got engaged at Arlington Stadium during a Rangers-Yankees game. In 2016, after stints at the University of Texas at Austin and the University of North Texas, he began teaching journalism at the University of Pittsburgh. “You know, the Pirates may have a team this year,” he said. “That should be your story.”
Cult of Glory wasn’t the first book to document the Rangers’ past atrocities, but it arrived at a moment of national reckoning over police brutality, particularly as it affected communities of color. It was published on June 9, 2020, 15 days after Minneapolis police officer Derek Chauvin murdered George Floyd, an unarmed Black man; the killing was captured on video and prompted protests of police violence across the country. On June 4, D Magazine ran an excerpt from the book that began with a section on the statue. It identified the model for the statue as former Texas Ranger Captain E.J. Banks, known as Jay, and it ran under the headline, “The Horrible Truth of Love Field’s Ranger Statue.” The statue was removed later that day. “Protests at an airport present too much risk,” said then-aviation director Mark Duebner. The statue went into storage at Hensley Field, a former Naval Air Station, and news outlets ran pictures of the Ranger lying horizontally on a dolly – his calming left hand now pointed straight up toward the ceiling – as workers in hard hats wheeled him out of the airport.
“He Could Hit Harder Than Any Man I Ever Saw”
Born in 1912, Banks spent nine years as a highway patrolman and served in the Coast Guard during World War II. He joined the Rangers in 1947 and became a legend for his toughness during a time of gang wars. Said one of his subordinates, “I don’t want to make a folk hero of the man, but he was formidable. He was big and powerful. He could hit harder than any other man I ever saw.” Banks’ most celebrated accomplishment was a 1957 car chase and shootout in which he killed notorious murderer Gene Paul Norris and accomplice Carl Humphrey, reportedly shooting Norris 23 times.
Banks gained national fame in 1956, when the country was mired in a battle over segregation. Two years after Brown v. Board of Education of Topeka, state police and federal troops forcibly integrated schools across the South. In Texas, Governor Allan Shivers twice sent in the Rangers to make sure the schools stayed segregated. He’d campaigned on segregation, and even after more than 100 school districts had integrated, he continued to fight it. Striking a tone that’s all too familiar today, he blamed the turmoil on “paid agitators.”
On Friday, August 31, after a federal court refused to stay the decision to integrate the Mansfield Independent School District, a mob of 400 people descended upon Mansfield High School to prevent Black students from registering. They blocked the doors. They hung effigies. They brought hunting dogs. They smashed the cameras of out-of-town reporters. A lawyer representing three Black students tried to register them by telegram, but superintendent R.L. Huffman refused to accept the proxy registration. “Now you guys know I’m with you,” he assured the mob, before making sure they hadn’t overlooked two doors around the back.
Shivers sent his own telegram to the Mansfield trustees, instructing them to transfer to another district any students “who might be the cause of difficulties.” To enforce this directive, he dispatched Banks and fellow Ranger Lewis Rigler. The telegram also served as a photo opportunity. On the front page of the Fort Worth Star-Telegram, a highway patrolman hands the telegram to the president of the Mansfield school board. Between them stands Banks.
On September 4, Reverend D.W. Clark of St. Timothy’s Church in Fort Worth admonished the demonstrators, telling them to love their neighbors. The incensed crowd surrounded him, screaming. A widely circulated AP report described Banks’ extrication of Clark in heroic terms: “Banks came through the crowd very quietly, took the priest gently by the arm, and said, ‘I think we’d better go.’ He led the priest off the school grounds.” The article was often accompanied by a photo of a smiling Banks leaning against a tree, surrounded by adoring high school girls. A photo taken from another angle, which didn’t make it into newspapers, shows that the cheerful gathering took place on the front lawn of the school, in the shadow of an effigy hanging from the entrance to the school. Another picture showed Banks and the girls laughing as he playfully handcuffed two of them together.
The next week, Banks and three other Rangers were sent to Texarkana College, a community college. On September 10, a mob estimated at 300 people assembled to physically block Black students from entering. People started arriving at 7:00 AM. They brought signs: “No NAACP Goons” and “Go North, N*****.” Two Black students arrived, 17-year-old Steve Poster and 18-year-old Jessalyn Gray. The crowd screamed epithets as the teenagers tried to find a way in. They separated Poster and Gray, kicking him and throwing gravel at her. The two left, but a few minutes later, they returned and asked the Rangers to escort them into the college. Banks refused, and relayed to reporters what he said to the teenagers: “Our orders are to maintain order and keep down violence. We are to take no part in the integration dispute and we are not going to escort anyone in or out of the college.” Wrote Swanson, “The local White Citizens Council was so happy with the Rangers’ actions they treated Banks to a chicken dinner.”
Photographs played an important role in how the narrative unfolded across the country. They also raised Banks’ profile. That September, Life magazine ran a series of articles on the skirmishes across the South. The September 17 and September 24 issues contained photos from Mansfield and Texarkana. One showed an effigy that had been hanging over Main Street in Mansfield. It was covered in blood-red paint and accompanied by two signs. The first read, “THIS NEGRO TRIED TO ENTER WHITE SCHOOL.” The second read, “THIS WOULD BE A HORRIBLE WAY TO DIE.”
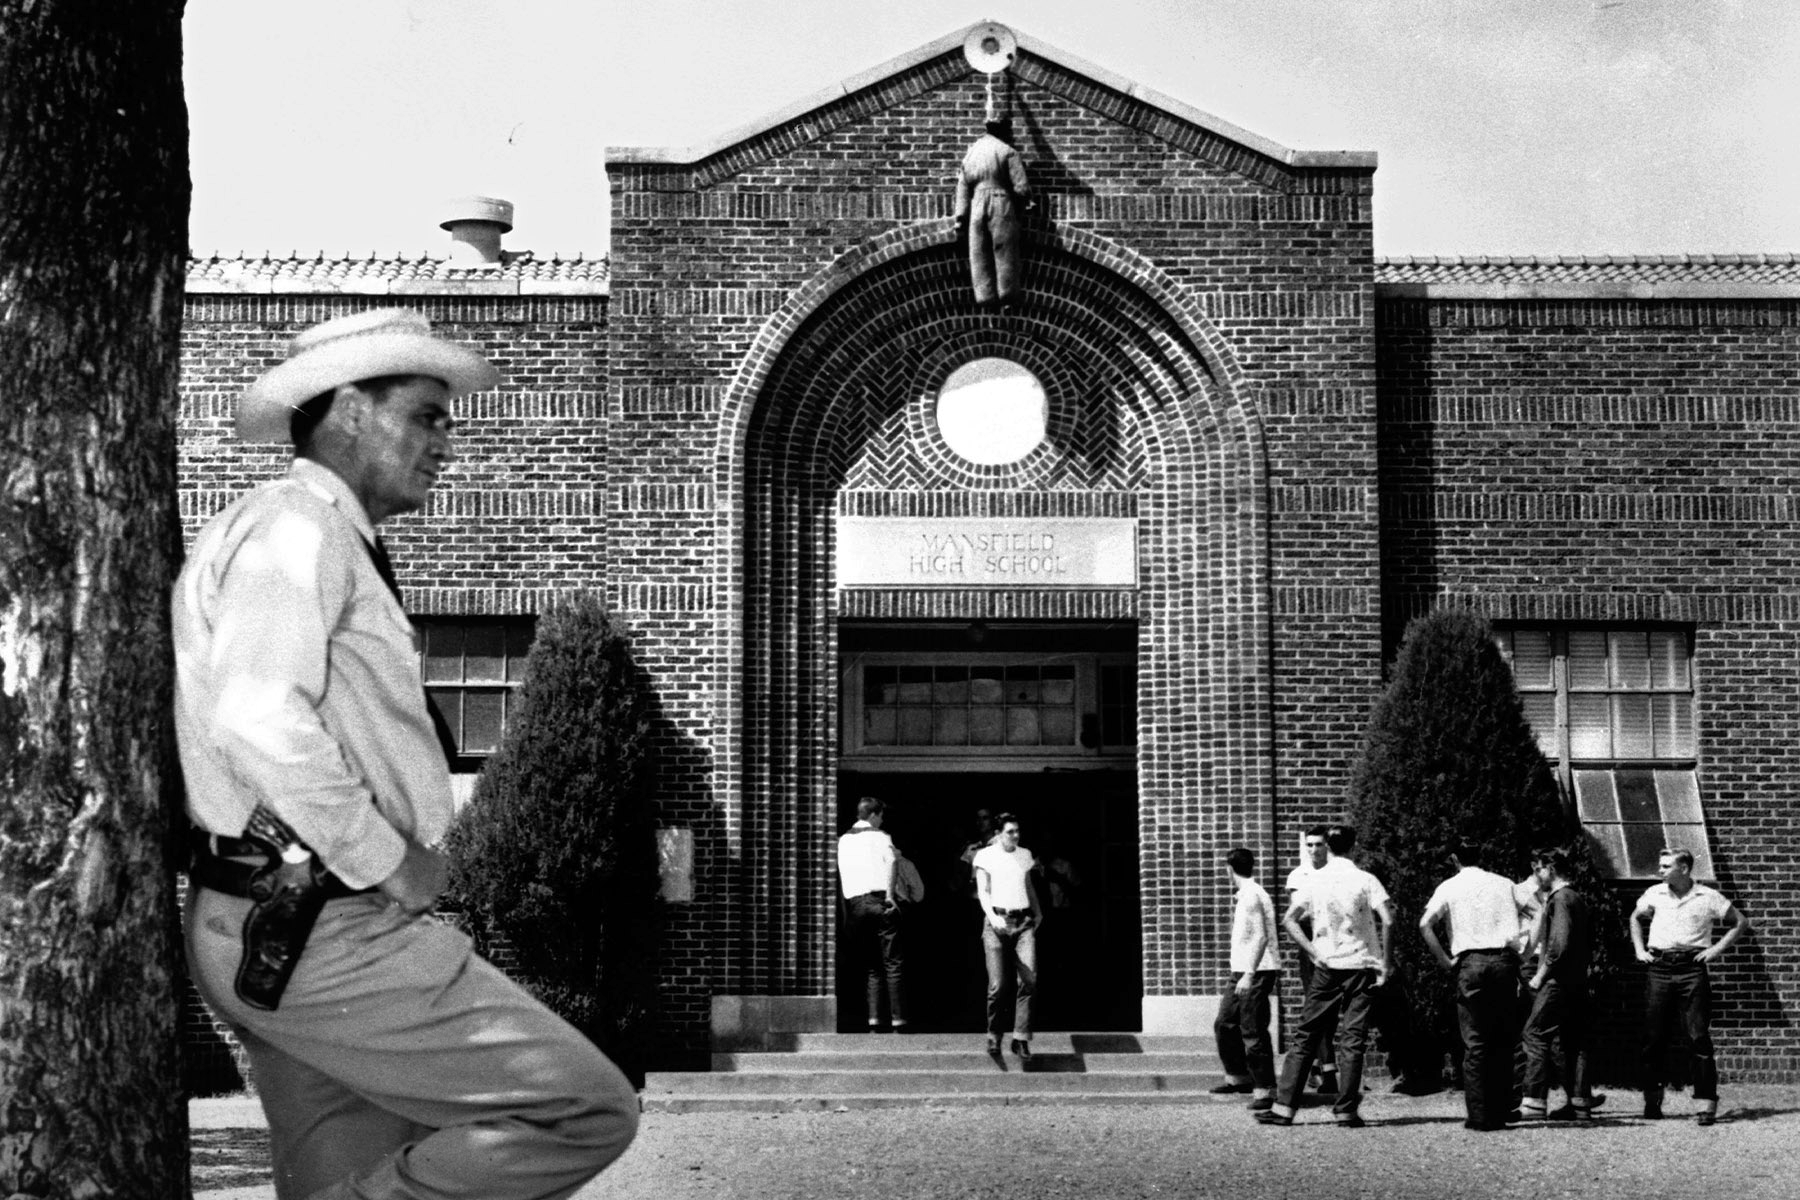
The defining picture of the incidents also came from Mansfield. In the foreground, in the left of the frame, Banks leans calmly against a tree, his thumb tucked into the waistband of his holster. Banks is in perfect profile, facing to the right and drawing the viewer’s attention to the center of the picture. The dramatic brick façade of the school commands the background. In the center, the high, gabled main entrance juts out from the surrounding wall. The door to the school, set in a sweeping arch, is patrolled by nine high school boys, their hands on their hips. Some 30 feet above them, at the peak of the gable, an effigy with a noose around its neck hangs from a light standard.
UTSA Libraries Special Collections
The picture appeared in Time magazine. “Banks became for a while the face of uniformed, armed, and officially sanctioned white resistance to court-ordered civil rights,” wrote Swanson. Less than two weeks later, Banks was promoted from sergeant to captain. His rising celebrity earned him appearances on the “Today” show, “Name That Tune,” and “What’s My Line?” Wrote the Dallas Morning News, “Whenever they needed a big, handsome guy to trot before the public, whether on network TV or at a beauty pageant, they called on Banks.” In some respects, Banks makes a fitting avatar for the Rangers. He killed men and committed acts both heroic and despicable. He earned a reputation for toughness, and he excelled at parlaying it into widespread fame.
“I Always Thought Models Were Kind of Sissy”
Ray Davis wasn’t the only speaker at the unveiling last week. Russell S. Molina, a businessman and board member of the Texas Ranger Association Foundation (TRAF), said, “This statue represents all Texas Rangers, not any single individual.” Asked in a phone interview whether his remarks were intended to imply that the statue was not modeled on Banks, Molina was more direct. “It is not,” he said. When informed that the Texas Ranger Hall of Fame & Museum lists Banks as the model for the statue, he conceded that Banks was “one model of many models… But that is not a model of him. That is not about a singular individual.” This contention feels disingenuous. The statue’s history is inextricably tied to its model, and the relationship between the two is well documented.
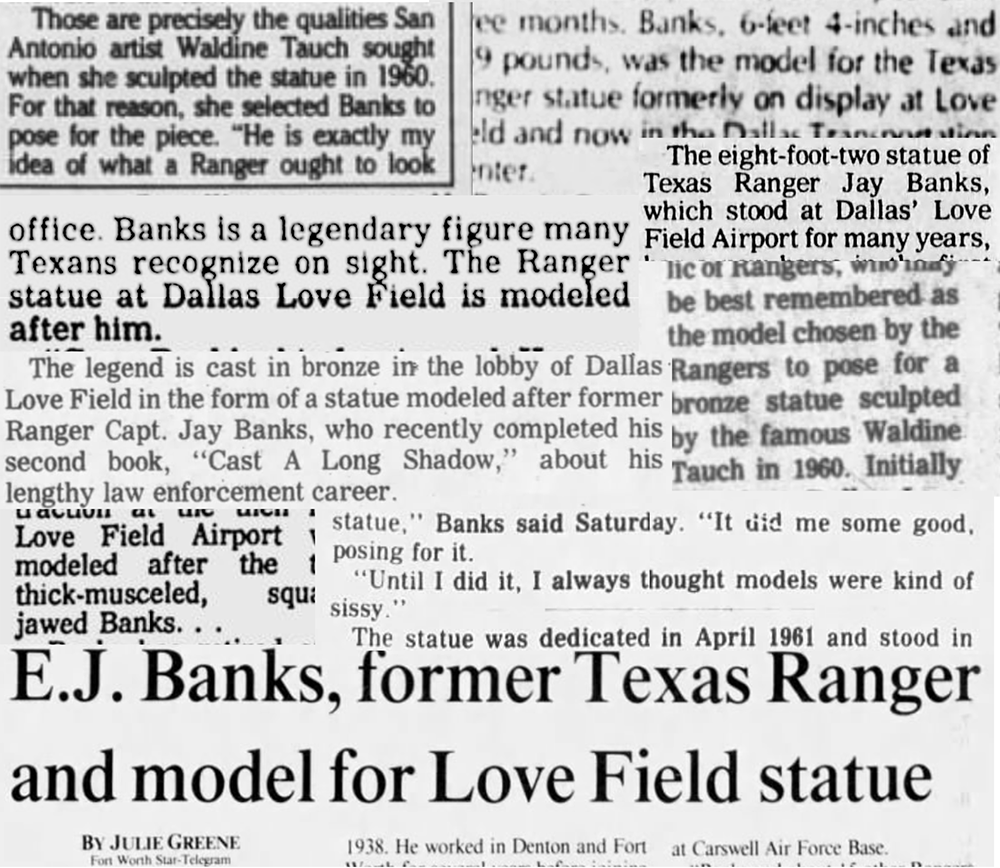
“The artist used one ranger who posed for her,” read a 1960 profile of Tauch in the San Antonio Light. Because the statue was intended to be a composite of all Rangers, “She promised authorities that she would not reveal his name.” An article in the Brady Herald, supplied to FanGraphs by Molina, told the same story of a single model: “Dr. Tauch used a model in doing the work but he will remain anonymous so the statue will be a tribute to all ‘Texas Rangers of Today.’” It was Banks who revealed that he was the model for the statue. “I don’t mind admitting I enjoy remembering the statue,” he told the Longview Daily News in 1976. “It did me some good posing for it. Until I did, I always thought models were kind of sissy.”
The article was adapted for syndication by the Associated Press and ran in at least 10 different newspapers. Tauch acknowledged her instructions to avoid making the likeness any one Ranger, but said she only made “a few minor changes,” and that the statue looked so like Banks that many called it simply “the Jay Banks statue.” In another interview, she said Banks was “exactly my idea of what a Ranger ought to look like.” According to the 2010 book Time of the Rangers, Banks lent Tauch his hat, boots, pistols, and holsters, which explains why the statue’s holsters bear a similar design to the ornately tooled leaf pattern of Banks’ actual holsters. They were sold at auction in 2012, accompanied by a notarized letter of provenance that read, “these are the holsters that he was wearing when he posed for the statue.”
Just as relevant, Banks has existed in the public consciousness as the model for the statue for 50 years now. Long before Swanson’s book, he was identified as such by the Public Art Archive, manydozensofarticlesinnewspapersandmagazines, TV broadcasts, andbooksaboutRangerhistory. A 1982 biography, authorized by Banks, was titled Legend in Bronze. He posed for pictures in front of the statue. It wasn’t just the firstline of his obituary; it was the headline. And, of course, in 2020, the statue was taken down specifically because of its connection to him. At this point, it isn’t possible to tell the full story of the statue without including Banks and his role in defending segregation.
For Failure To Perform His Duty
When asked whether, hypothetically, his opinion of the statue would change if he knew definitively that it was modeled on Banks, Molina responded with a question: “Do you think one picture should define a man’s legacy?” He cited Banks’ relationship with Earl Ray Peterson, who went on to become the first Black chief of the Rangers, as proof of his character. Said Molina, “He was there at Mansfield doing a job that the governor told him very specifically what to do, and he was very successful at that.” It’s a familiar argument. “As modern Rangers still must, mid-20th-century Rangers followed orders,” wrote Mike Cox for True West Magazine. “They didn’t unilaterally set state policy. Wrong as what happened in Mansfield was, Banks and other Rangers would have been out of a job had they not done what Gov. Allan Shivers sent them to do.”
Banks soon found out how true this was. In March 1960, before the statue was even finished, he was fired from the Rangers. When Banks claimed he’d resigned rather than been fired, Colonel Homer Garrison Jr. held a news conference to explain that for “practically a year,” he had repeatedly ordered Banks to raid illegal gambling establishments in Tarrant County. “For failure to carry out department orders,” Garrison said, “Captain Banks has been relieved of his command and dismissed.”
Following his dismissal, Banks was hired as chief of police in Big Spring, Texas. In June 1971, the city fired him after complaints that included refusal to cooperate with other law enforcement agencies that sought to investigate theft within his department, refusal to fire incompetent officers, and discrimination in enforcing ordinances on the sale of beer and pornography. Twice, Banks’ refusal to follow orders cost him his job. In Mansfield and Texarkana, he did what he was told. He later wrote that the mobs “were just ‘salt of the earth’ citizens. They were concerned because they were convinced that someone was trying to interfere with their way of life.”
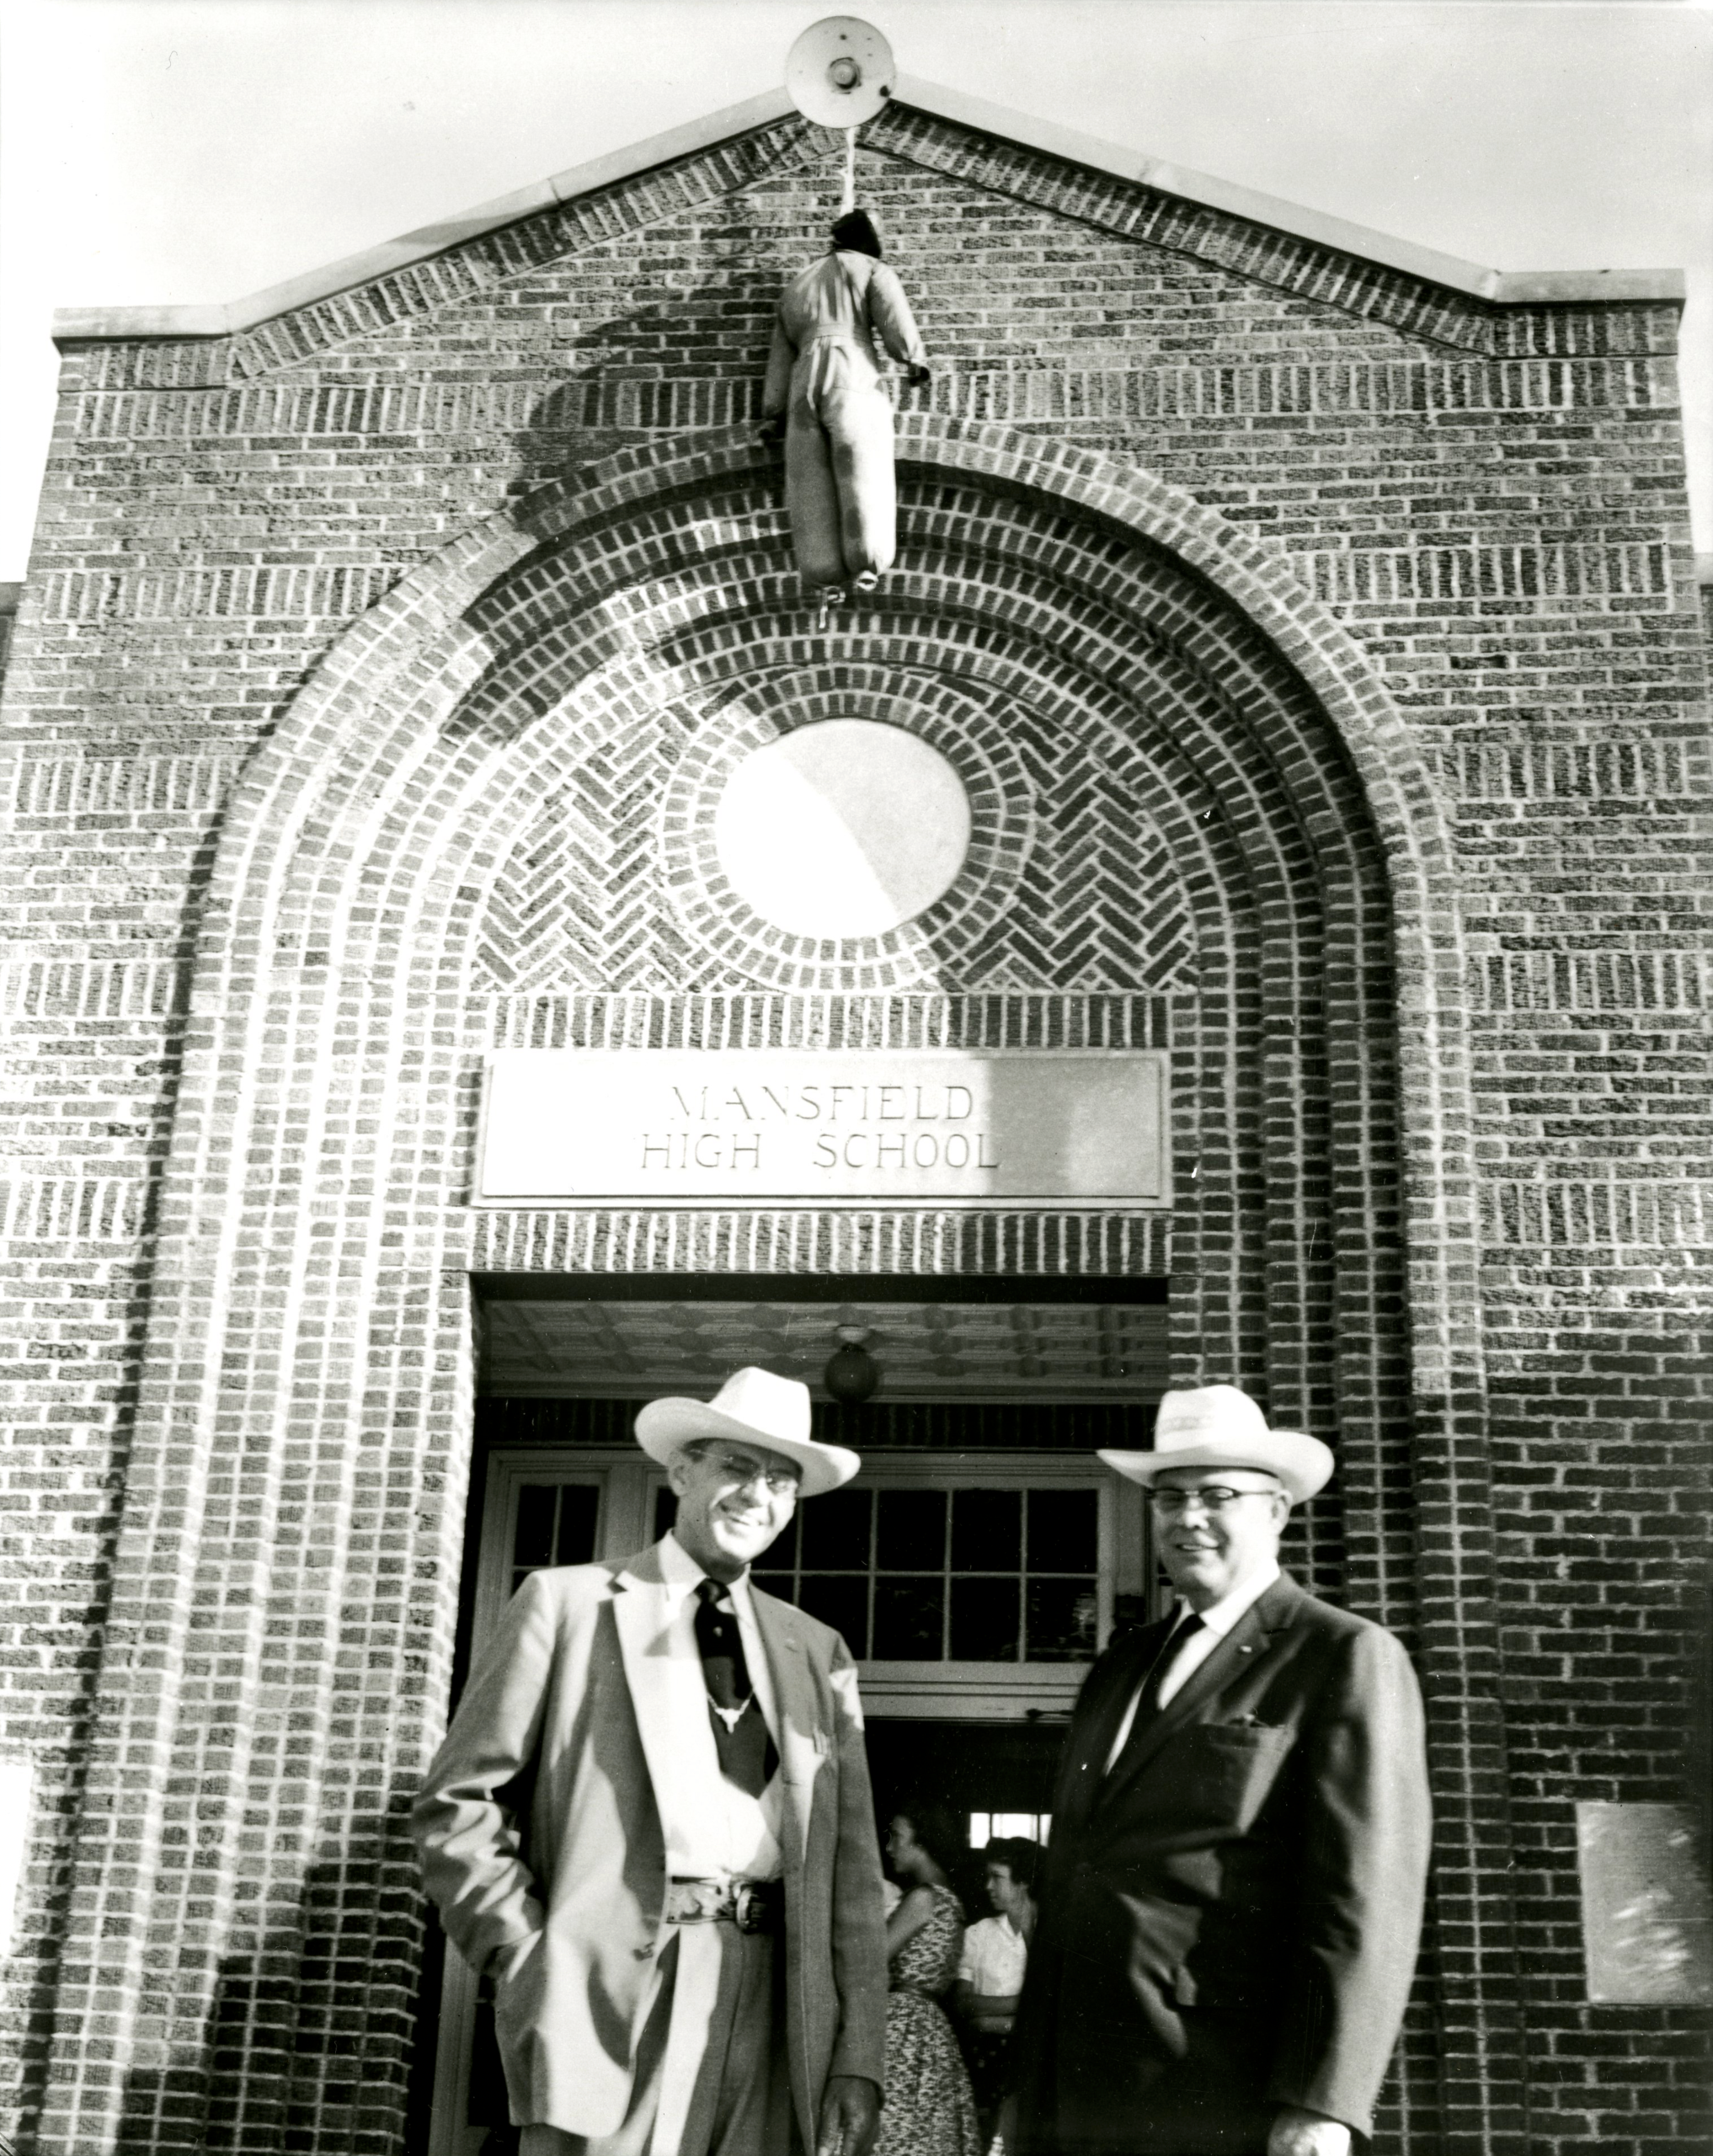
Another photograph from Mansfield – one that didn’t make it into the newspapers – tells the story in an entirely different way. The lighting is no longer crisp. The composition is purposefully amateurish. Where the photograph that has threatened to define Banks was ambiguous and poignant, this one is so on the nose that it borders on caricature. In it, Banks is no longer leaning against the tree out on the front lawn. He’s right on the steps of the high school, posing next to Rigler. The photograph is taken from below, and it cuts the men off at the waist. That’s done intentionally, so the top of the frame will capture the effigy directly above their heads. The two Rangers wear big smiles for the camera.
Texas State Library and Archives Commission
This is the context behind the statue. This is the reason why, at a time of heightened scrutiny of law enforcement, it was removed from Love Field the moment that context was brought back into public consciousness. Swanson had no idea his work would result in the removal of the statue. He wasn’t necessarily in favor of the decision. “I thought at the time,” he said, “and I still think it would have been better if they could add some context to it, to explain what the statue represented, both good and bad, and explore some of the history related to it. And maybe a few people would stop and read it and maybe understand a little bit more about it. That’s the point I was trying to make.”
At the time, Dr. Sonia Hernández, the George T. & Gladys H. Abell Professor of Liberal Arts II at Texas A&M’s history department, was more hopeful about the removal of the statue. In a phone interview earlier this month (during which she clarified that she was speaking only for herself, and not on behalf of Texas A&M), she explained, “Removing a statue doesn’t necessarily lead to justice or a more equitable society. However, it is a recognition, especially on the part of authorities or the state… We are paying attention and we need to be mindful of the kinds of stories that we value.”
Hernández hesitated to put all the focus on Banks. “It’s a Ranger and it’s the larger context. You get at the Rangers through one individual, through an agent. And I go back to the larger culture of impunity.” To some, recognition of the statue’s significance felt like a culmination of years of research and scholarship to acknowledge the full truth about the Rangers, starting with the Canales Hearings in 1919 and Américo Paredes’s 1958 book, With His Pistol in His Hand.
“I Mean, Who Wants Bad Publicity?”
Molina explained that he himself spearheaded the effort to return the statue to public display. “I wanted to make sure that the truth got told and that the statue was put back up,” he said. He started negotiating with the city in 2021 or 2022. In February 2023, he arranged for the Office of Cultural Affairs to loan the statue to TRAF, which would be responsible for finding it a new home. Administrative Action 235385, which made the loan official, says the contract expires on December 30, 2027.
The original agreement was to place the statue at a brand new museum and Hall of Fame devoted to the law enforcement agency, said Molina, but that project has been delayed. “I’ve always thought Texas Ranger baseball was the ideal place, and it just so happened that I had a conversation with a friend of mine who knew somebody there.” He estimated that it took six to nine months to go from that initial conversation to the unveiling earlier this month.
The only public mention of the new destination came at a Public Art Committee meeting on February 3. The move had already been decided. “He – ‘One Riot, One Ranger’ – will be moved to the museum-like setting at the Texas Ranger ballpark,” said the Committee’s Lynn Rushton-Reed. “He will be part of that museum that tells the story of the Rangers and how the Rangers baseball team got their name, so back in a museum-like setting.”
Last week, the Arlington branch of the NAACP issued a statement expressing “deep disappointment” in the team’s decision to host the statue just 14 miles from Mansfield. After the Public Art Committee meeting, the NAACP had “reached out to representatives of the Texas Rangers organization to express our concerns about honoring a historical figure connected to events that undermined civil rights and educational progress in our region. Despite those concerns being raised, the organization ultimately chose to move forward with the statue’s installation.”
United States Congressman Marc Veasey, whose district includes parts of Arlington less than two miles from Globe Life Field, has also come out against the statue. In a letter to Rob Manfred, Ray Davis, and team co-chairman Bob Simpson, Veasey wrote, “It sends a chilling message about which parts of history are being elevated and which sacrifices are being forgotten. Ballparks should be places where families gather, where children fall in love with the game, and where fans of every race, faith, and background feel welcome. Honoring a figure tied to resisting school integration — and doing so with imagery that evokes racist violence — sends exactly the wrong message about who belongs in that space.”
As a historian, Hernández is well-equipped to put the reemergence of the statue in context. “I was disappointed,” she said, “and perhaps not entirely shocked, given the developments in the last couple of years – widespread assaults on anything that is accurate, critical history, American history – and what’s been happening across institutions of higher education.” Still, she couldn’t help but express some surprise at the team’s decision, saying, “I mean, who wants bad publicity? Nobody wants bad publicity.” Swanson echoed her thoughts: “It’s a curious choice, this statue, I guess is what I would say in the end. I don’t know why they would want to associate themselves with a statue that has such a problematic history.”
“I Don’t Know How They Would Handle That”
In conversation, Molina stressed the need to look at the big picture. “The full context is really what is critical,” he said. “Because you’ve got to know what was happening the day before, the week before, the month before, a year before. And then, more importantly, what happened the day after, the week after, the month after, and years after.” When asked whether the Rangers planned on providing any additional context to the statue at the ballpark, Molina replied, “Well, that’s a good question. Not to my knowledge. I don’t think Texas Ranger baseball has any plans on that. But I may be speaking out of turn. I don’t know. Honestly, I don’t know.”
Swanson and Hernández both echoed the need for context. “I wish there was more information,” said Swanson. “I wish there was more context. I wish we could embrace the history of it, both good and bad.” Hernández gave the historian’s perspective on the danger of presenting the past through a “noncritical” lens: “Up through the late 20th century and into the 21st century, there’s been evidence-based scholarship on the dark chapters associated with this elite law enforcement unit…. There’s certainly great things about Texas. I am a Texan. But I think it’s also important to tell it like it is. And when you obscure or gloss over the not-so-great things about any historical figure, any historical site, any historical development, you’re doing a disservice to the greater American public.” The NAACP’s statement ended by “calling on the Texas Rangers organization and ballpark leadership to engage in constructive dialogue with community stakeholders regarding how history is represented.”
Despite the agreement that the statue should be part of a larger conversation, few seem to think it’s possible to provide the appropriate context for the statue at Globe Life Field. “I don’t know where you would do it,” said Molina. Said Hernández, “It is really difficult to complicate that history at that place. People are coming and going, especially children, young people, visitors. It’s going to be difficult to do that in a place like that… Can you separate history from heritage and have those deep, impactful conversations where people dialogue? Can you do that at a stadium or at an airport? I don’t think so.” Swanson put it more bluntly: “I mean, are they going to put up a plaque over by the beer stand that tells the rest of the story? I don’t know how they would handle that.”
“It’s not about being politically correct,” said Hernández. “It’s not about supporting one group over another. It’s the kind of nation that we can have, built on trust and honesty and respect for one another. And that’s a really basic way to put it, but I think it’s really important. You ask yourself, ‘By doing this one thing or by supporting this one thing, am I living up to that standard? Is this the kind of world that we want to promote?’ Really thinking about the next generation, especially at a ballpark where you take your kids.”
For now, at least, the point is moot. The ballclub has given no indication it will provide any additional context about the statue to the more than two million fans who attend home games each year. At D Magazine, sports editor Mike Piellucci described the unusually collapsed timeline of the unveiling. The team announced the 10:00 AM ceremony in an email sent at 6:01 PM the night before, saying only that it concerned “a new permanent non-baseball addition to the left field concourse,” and that reporters would be expected to leave by 10:30. No one would have time to do research or prepare questions. No one would get to ask questions anyway. Wrote Piellucci, “The organization concealed what it was unveiling because it knew what the reaction would be.”
Fans will necessarily view this most recent development within the larger context of the club’s other actions. The Rangers are the only major league team without a Pride night. The Rangers are one of just two teams that don’t provide paid maternity leave to employees. They have now installed this statue while taking great pains to avoid any discussion of its significance. Reasonable observers might deduce that the through line connecting these decisions is a disregard for marginalized groups.
“We recognize that the history of the Texas Rangers, like that of our state and nation, includes moments that must be confronted honestly,” said Molina at the unveiling. But no one can force the ballclub to explain why a statue so objectionable that it spent six years in storage is now an appropriate addition to Globe Life Field. Through its actions, the team has made it clear that it would prefer to sidestep the conversation entirely, and that it believes it can do so. When fans arrive on March 23, they will be armed only with what they already know and believe about the statue and the organization it represents. No doubt, many will see the statue the way the artist intended, as “a man that everyone respects and trustfully looks upon as law and order.”
Editor’s note: An earlier version of this piece erroneously identified Robert Wilonsky as Dallas’ aviation director at the time of the statue’s removal from Love Field. It has been updated to reflect that Mark Duebner held that role.