Archive for Featured Photo

Is Popup Rate a Skill?

When I wrote about Mike Soroka this week, I mentioned that he’s one of the best players in baseball at getting popups. Nearly 20% of the fly balls opponents have hit against him have ended up in an infielder’s glove, one of the best rates in baseball. It’s clear that this is a valuable skill for the Braves — a fifth of Soroka’s fly balls are automatic outs. But there’s a follow-up question there that’s just begging to be asked. Does Soroka have any control over this? Do pitchers in general have any control over how many popups they produce?

This is the kind of question where it’s important to know exactly what you’re asking. FanGraphs has a handy column in our batted ball stats, IFFB%, that looks like it cleanly answers what you’re looking for. Be careful, though! IFFB% refers to the percentage of fly balls that don’t leave the infield, not the percentage of overall balls in play. Let’s use Soroka as an illustration of this, because his extremely high groundball rate will make the example clear. Take a look at Soroka’s batted ball rates this year:

Mike Soroka’s Batted Ball Rates, 2019
GB/FB LD% GB% FB% IFFB% HR/FB
2.97 22.0 58.4 19.7 17.6 2.9

Soroka allows 19.7% fly balls, of which 17.6% are infield fly balls. In other words, roughly 3.5% of balls put in play against Soroka this year have been popups. For me, that helps contextualize what we’re talking about. Lucas Giolito has the highest rate of popups per batted ball in the major leagues this year among qualified starters, a juicy 7.4% (in a lovely bit of symmetry, teammate and other half of the Adam Eaton trade package Reynaldo Lopez is second). Eduardo Rodriguez is last among qualified starters at 0.5%. There’s a spread in how many popups players allow, but it’s not enormous.
Read the rest of this entry »


Franmil Reyes Has Power Everywhere

Hitting the ball over the fence in San Diego can be difficult, though not quite as difficult as it used to be after the team changed the dimensions in 2013. Similarly, hitting the ball out of the park to center and the opposite field is generally a more difficult task for hitters. Around 60% of home runs this season are pulled by batters, while only 15% of dingers are hit to the opposite field. These difficulties have proved to be of little consequence for 23-year-old Franmil Reyes.

The young slugger’s statistics can leave you slightly underwhelmed when compared to his imposing figure and powerful bat. Reyes has a 120 wRC+, which is good but not great, and his defense in the outfield keeps his WAR at 0.8 on the season. Reyes doesn’t walk a ton, he strikes out a bit too much, and he doesn’t add anything on the basepaths, but he can do this:

Fourteen of Reyes’ 19 homers have gone out to center or the opposite field. That figure is the most in baseball and two clear of Christian Yelich and Peter Alonso, and includes five homers to the opposite field. Ten of those 14 homers have come in Petco Park, one of the more difficult stadiums for lefties to hit homers, and they have the advantage over Reyes in being able to pull the ball to right field. Trying to hit homers to the opposite field is generally not advisable, but for a man of Reyes’ size and power, it’s a worthwhile strategy. And when Reyes hits the ball in the air to center or the opposite field, he hits the ball harder than anyone in the game, per Baseball Savant: Read the rest of this entry »


Colten Brewer, David Hernandez, and Ryan Yarbrough on Coming Up With Their Cutters

Pitchers learn and develop different pitches, and they do so at varying stages of their lives. It might be a curveball in high school, a cutter in college, or a changeup in A-ball. Sometimes the addition or refinement is a natural progression — graduating from Pitching 101 to advanced course work — and often it’s a matter of necessity. In order to get hitters out as the quality of competition improves, a pitcher needs to optimize his repertoire.

In this installment of the series, we’ll hear from three pitchers —Colten Brewer, David Hernandez, and Ryan Yarbrough — on how they learned and developed their cutters.

———

Colten Brewer, Boston Red Sox

“It started happening in the [2016] offseason that I got Rule-5’ed to the Yankees. When I got to spring training, they said, ‘Hey, the reason we got you is that we noticed some cut on your fastball; we like that.’ I was like, ‘Oh, really?’ I’d been five years with the Pirates, and they didn’t really use that analytical side to baseball. As a result, I didn’t really know much about myself until I got with the Yankees.

“That offseason I’d worked out at a place called APEC, in Tyler, Texas. They were using a Driveline system. Going to a new team, I wanted to show up in spring training in the best shape possible, so I spent a month and half there. That’s where the wheels started turning.

“In the spring, I started throwing more balls in to lefties, and was watching the ball work. From then on I started having natural cut on my fastball. I said, ‘I’m going to use this.’ With the Pirates I’d been more of a sinker guy — I thought arm-side run was better — but after I got to the Yankees I started ripping fastballs as hard as I could, and they were cutting. Read the rest of this entry »


Xander Bogaerts is Selectively Aggressive

When Xander Bogaerts played in the 2013 World Series as a 20-year-old rookie, it was easy to see the start of a promising career: he was a glove-first shortstop (though he played mainly third base in 2013, ceding short to Stephen Drew) with enough pop and size to eventually be an impact bat. Over the next four years of his career, though, that promise of power remained tantalizingly out of reach. At the end of 2017, Bogaerts’ career line was nearly exactly average (101 wRC+), but the extra-base hits never quite developed as projected. His .127 ISO was in the 19th percentile of batters with at least 2000 PA over that time period, and his slugging was hardly better (.409, 28th percentile).

Now, a league average bat at shortstop is still tremendously valuable. Bogaerts was worth 12.9 WAR over those four-plus years, a 3 WAR/600 PA pace that would make him a starter on virtually every team. Still, you could look at the promise of a 20-year-old Bogaerts, a 6-foot-1 live wire getting important at-bats on the biggest stage, and wonder why he hadn’t tapped into more offense. It had been four years, after all. Surely if he was going to fill out and add power, it would have already happened.

Two years later, that 2017 endpoint looks awfully conveniently timed to fit a narrative. Since the start of the 2018 season, Bogaerts has found another gear. He’s batting a scintillating .291/.366/.526, good for a 134 wRC+, and the power has miraculously appeared, with his .235 ISO ranking in the 84th percentile among qualifying batters. Still only 26, Bogaerts now looks like one of the best players in the game, full stop. The player fans and scouts saw glimpses of in 2013 is finally here.

What did Bogaerts do to tap into his enormous potential? Well, given that his power numbers have spiked across the board while his strikeout and walk numbers have barely budged (18.5% strikeouts and 7.2% walks 2013-2017 versus 18.1% and 10.2% thereafter), it would be easy to say he just started hitting the ball harder. He always looked like he had the potential to do that. A few pounds of muscle here, a little physical maturation there, a smattering of juiced baseball, and warning track power becomes home run trots. Take a look at Bogaerts’ average exit velocity from 2015 (the first year of Statcast data) to now, on all batted balls and also balls he hit in the air: Read the rest of this entry »


Max Scherzer Has Allowed More Groundballs, but Is That a Good Thing?

If you take one look at Max Scherzer’s player page, it is not hard to identify where he has improved.

Both Scherzer’s strikeout (33.4%) and walk (5.1%) rates remain excellent, as is the standard. But his FIP (2.13) — which finds itself at the top of the pitching leaderboard — has fallen by more than half a run. If the season ended today, it would represent a career-low. This FIP decrease is due to a drop in Scherzer’s home run rate. In 2018, 2.7% of plate appearances against Scherzer resulted in a home run; in 2019, that figure is 1.7%.

Contributing to Scherzer’s home run reduction appear to be two main factors: better luck and more groundballs. His 8.0% home run per fly ball rate would represent his lowest mark since joining the Nationals. Considering that we’re in an era of home runs galore, some regression there is likely expected, though the seemingly livelier ball complicates that question. But a potentially more sustainable change rests in the large increase in Scherzer’s groundball rate, which he’s seen jump from 34.3% in 2018 to 42.8% in 2019. Read the rest of this entry »


Depleted Phillies Lose McCutchen for the Season

On Tuesday, the Phillies snapped a five-game losing streak and maintained their razor-thin margin atop the NL East, but not before suffering a different kind of loss when they learned that Andrew McCutchen will miss the remainder of the season. The 32-year-old outfielder tore the anterior cruciate ligament in his left knee while trying to avoid being tagged during a rundown in the first inning of Monday’s game against the Padres. It’s a costly loss for the Phillies. Not only has McCutchen — the leadoff hitter in 59 of the team’s first 60 games — been one of the team’s most productive players, but Philadelphia’s outfield depth has been depleted by a variety of other means.

The play on which McCutchen got hurt was a strange one. After he led off the game by drawing a walk, Jean Segura popped up but lost his balance and fell to one knee in so doing. Rather than catching the ball, Padres second baseman Ian Kinsler alertly let it drop, then barehanded the ball on the first hop and threw to first baseman Eric Hosmer for the first out. That left McCutchen in no man’s land; he broke for second, then reversed towards first, threw on the brakes, then tried an ill-advised spin move to elude Hosmer. By the time he was tagged, Cutch was clutching his knee:

Rotten luck. “I didn’t feel it pop or anything,” McCutchen told reporters after the game. “Something felt uncomfortable, something that made me grab my knee and go down. I’ve had an ACL injury before and I know what that feels like. This didn’t feel like that.” Alas, the outfielder’s optimism proved to be ill-founded, as an MRI taken on Tuesday showed the tear.

Read the rest of this entry »


Powerhouse Dodgers’ Bullpen Misadventures Stand Out

Six in a row, 10 out of 11, 16 out of 19, 27 out of 35 — however you slice it, the Dodgers have been steamrolling everything in their path lately. They haven’t lost a series since dropping two of three to the Giants April 29 to May 1, and now own the NL’s best record (42-19) by a margin of 7.5 games. Their +96 run differential is nearly equal to the sum of those of the league’s second-ranked Cubs (+53) and third-ranked Diamondbacks (+46). Their offense owns the league’s highest wRC+ by a wide margin (117 to the Cubs’ 109), and their rotation owns the NL’s best ERA (2.88) and FIP (3.46) while also the most innings per start (5.89).

Which brings us to their bullpen. Sure, it hasn’t been a dumpster fire on the order of the Nationals’ (6.81 ERA, 5.08 FIP) or Orioles’ (5.84 ERA, 5.66 FIP), but there are only so many teams who can be that lucky. Through Monday, the Dodgers’ bullpen ranked 10th in the NL in ERA (4.71) and ninth in FIP (4.48). The former number doesn’t even account for the fact that the unit has allowed 43% of the runners inherited from the starters to score, the league’s second-worst mark; include all inherited runners and the rate falls to 39%, third-worst. While their relievers’ 7.6% walk rate is a league low, their 22.2% strikeout rate is the second-lowest, and their 1.37 homers per nine is mid-pack. Their clutch score — a measure of whether a player or team has done better or worse than expected in higher-leverage situations — of -2.54 is second-to-last in the NL, ahead of only the Nationals.

As you can see from those numbers above, the offense and rotation have largely papered over the bullpen’s problems. The week-long span from Sunday, May 26 through Saturday, June 1 — during which Dodger relievers combined for a 7.08 ERA and 6.64 FIP in 20.1 innings — illustrates the point in dramatic fashion:

  • Sunday, May 26 vs. Pirates: Caleb Ferguson entered with a seven-run lead and turned it into a four-run lead, though the Dodgers still won, 11-7.
  • Monday, May 27 vs. Mets: Joe Kelly entered with a five-run lead and failed to retire any of the three hitters he faced, the highlight of whom was a two-run homer by Adeny Hechavarria, the owner of a career .346 slugging percentage and a total of 29 homers compiled in eight seasons. When Kelly’s successor, Dylan Floro, got into trouble, manager Dave Roberts called upon Kenley Jansen for a five-out save, which he converted in the 9-5 win.
  • Read the rest of this entry »


Pitchers Plan, and Mike Trout Laughs

Imagine being a pitcher who has to face the Angels this year. It’s not hard to figure out which batter you most need to prepare for. When the Angels played the Cubs last night, Albert Pujols batted third, which is a lot less imposing in 2019 than it was in 2008. Shohei Ohtani had the night off, which meant that Tommy La Stella was the best non-Trout bat in the lineup. He’s having a good year, as Jay Jaffe noted, but unfortunately for him, he’s still Tommy La Stella. Cesar Puello batted fifth, and hey, good for him. Still, though — the scouting report was probably just Mike Trout written in various fonts over and over again.

It’s safe to say that every game the Angels play, the opposing team has spent a lot of time trying to work out a way to get Trout out. Los Angeles has a robust 109 wRC+ this year among non-pitchers, which sounds good until you realize that non-Trout Angels have a 100 wRC+. The team is scuffling — two games below .500 in a division where you might need 100 wins to topple the Astros, and potentially a little lucky to be there given their BaseRuns record. The pitching staff is essentially made of duct tape and fervent prayers — Ty Buttrey leads the staff in both fWAR and RA/9 WAR, and their starting rotation looks like a horror story told to kids to keep them from becoming Angels fans.

Amidst this chaos, this unending deluge of mediocrity, Mike Trout is putting together another masterpiece of a season. It’s boring to say, almost — his 180 wRC+ is both the fourth-highest in baseball and the lowest Trout has recorded in the last three years. Being one of the best players in baseball is old hat for him. Still, he’s improving his craft incrementally, slowly shoring up weaknesses and adding to strengths. His unintentional walk rate, a gaudy 19%, is the highest of his career. His strikeout rate, a minuscule 16%, has never been lower. Trout’s 2019 might be the best he’s ever hit, a crazy thing to say about undoubtedly the best player in baseball.

Baseball is largely a game of failure and limitations, which makes talking about Trout’s plate discipline feel somewhat surreal. Consider this — Trout has started making contact with basically everything he swings at in the strike zone. His zone contact rate of 94.9% is sixth in baseball and the highest of his career. That’s strange, because for the most part, guys who make contact with everything are contact hitters who sacrifice power to put the ball in play. David Fletcher and his .137 ISO top the list.

This makes a rough kind of sense — hitting everything you swing at in the strike zone means you are probably putting some tough pitches in play, and cutting down on your swing to make more contact means those swings generally have less behind them. That, at least, is the logic that constrains mortals. Mike Trout started hitting everything in the strike zone, and he’s still slugging .600. That slugging percentage might be selling Trout short — he has the highest xSLG (a Baseball Savant statistic that predicts slugging percentage from angle and speed of hits) of his career, a gaudy .643.

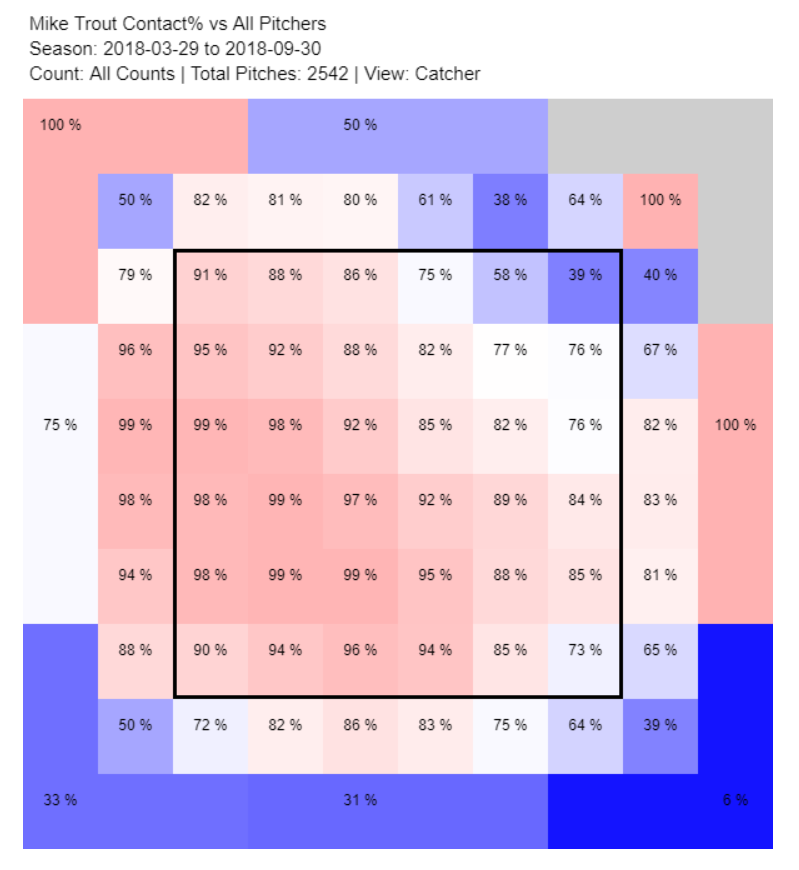
What does making contact with every pitch in the strike zone look like? Well, in 2018, Trout was great, but he was great while being only very good against high and outside pitches. Take a look at the upper righthand corner of this chart, the percentage of swings he made contact on by zone in 2018:

Pitchers know about this marginal weakness, and they do their best to exploit it. The book on Trout is to get him high and away. Take a look at where pitchers are attacking him in 2019:

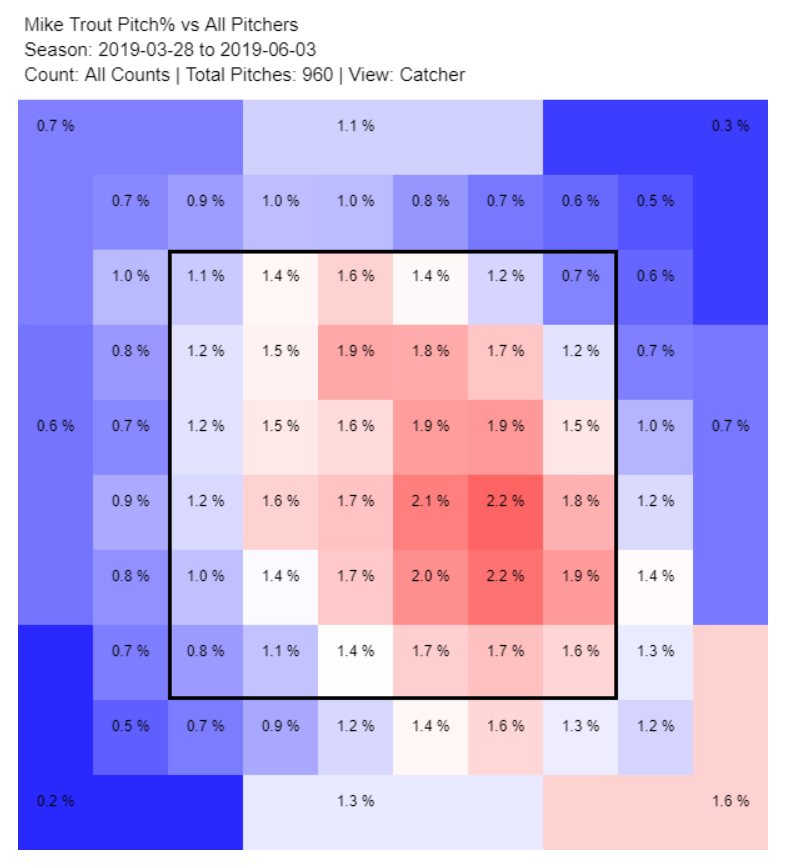
That’s good pitching right there. Find out where a hitter is most likely to get bad results, and aim for that spot. Maybe their focal point is a little too low, but the general idea of throwing away is certainly easy to see. Major league pitchers are tremendously skilled, and they spend countless hours perfecting their craft. That should work out to their advantage, right? Well, bad news, pitchers — this is Mike Trout we’re talking about here. Look at his contact rate in 2019:

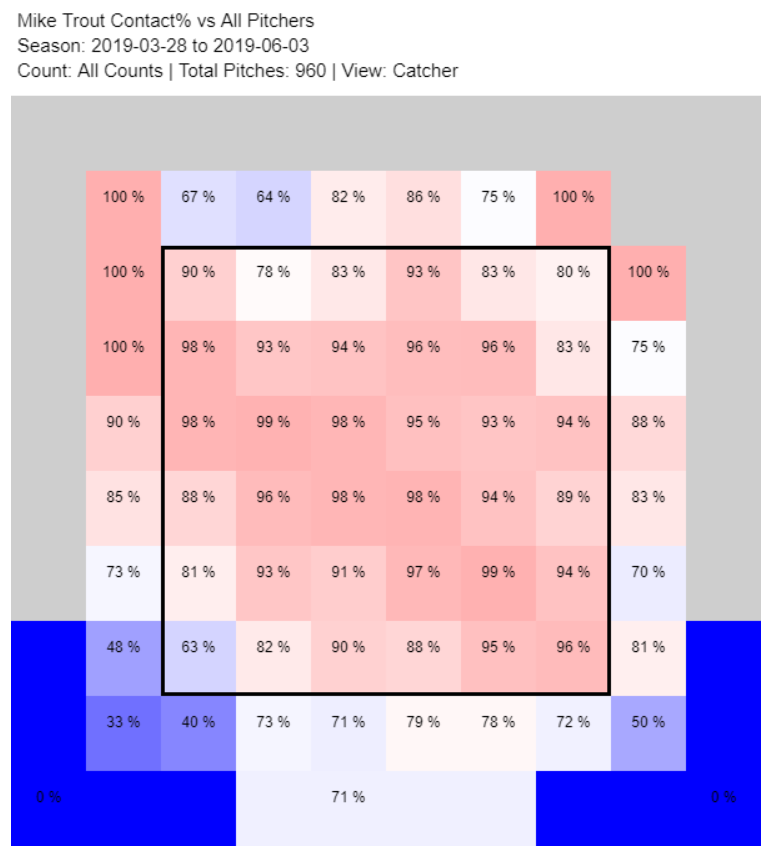
It would be one thing to protect a weak point in your swing with some defensive hacks. Plenty of good hitters punch outside pitches the other way, sacrificing power for contact on pitches that are hard to drive. Again, though, Mike Trout isn’t “plenty of good hitters.” He’s the best hitter in baseball. Trout is punishing outside and high pitches in 2019, doing a tremendous amount of damage when he puts the ball in play:

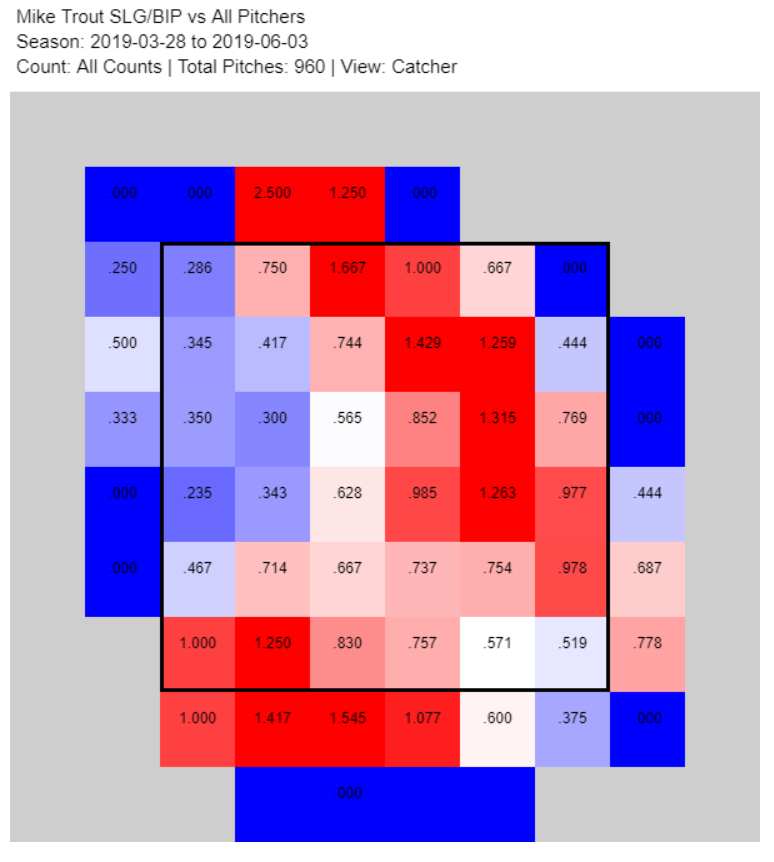
You’re reading this chart right — Trout is now getting his greatest production on balls in play in the very part of the strike zone where pitchers are attacking him most. That, in a nutshell, is what pitching to Trout is like. You might think you’re attacking a weakness, doing your research to put yourself in an advantageous position. Trout’s better at adapting than you are; he’s better than everyone. He reacts to your changes faster than he can be solved.

Pitch location isn’t the only part of Trout’s plate discipline pitchers have focused on this year. They’ve changed how they attack him on the first pitch of a plate appearance, and Trout is yet again using that to his advantage. For years, the book on Trout was that he was patient on the first pitch to the point of somnolence; he basically never swung at first-pitch breaking balls, for instance. Over the past few years, Trout has turned this trend around, becoming increasingly aggressive on the first pitch — he swung at 19.7% of first pitches in 2017 and 18.3% in 2018, the two highest rates of his career.

To combat this trend, pitchers are going out of the zone on first pitches more than they ever have. Trout is seeing strikes on 47% of first pitches, down from his career average of 55% and below the major league average of 51%. This adjustment was largely out of self-preservation. Trout slugged 1.061 with a .485 batting average when he put the first pitch into play last year. He hit five home runs on first pitches, a career high. Sticking with get-me-over first pitch fastballs was no longer an option.

In classic Trout fashion, though, he’s turned pitchers’ adjustments into another tool in his tool belt. Now that pitchers throw him fewer first-pitch strikes, he’s simply swinging less. He’s down to a 17% swing rate on first pitches this year while still swinging at 27% of pitches in the zone. He’s also missing less — he’s swung and missed at five first pitches this year, a 2% rate that would be his lowest since 2015, the last year of his extreme passivity on first pitches. Between this improved swing discipline and pitchers avoiding the zone like the plague, Trout is falling behind in the count 52.9% of the time this year, a career low and 5.2% below last year’s level.

2019 is arguably Mike Trout’s finest batting season so far. His xwOBA of .473 is the highest it’s ever been and 30 points higher than his wOBA, suggesting that he’s been unlucky this year to put up “only” a 180 wRC+, the third-highest of his career. He has the highest walk rate in baseball and a strikeout rate in the lowest 21% of qualified batters. He’s getting on base at the highest rate in his career despite the lowest BABIP in his career (excluding his brief 2011). The two changes pitchers have made to how they approach him this year sure don’t seem to have worked.

Pitchers will try to make other adjustments. They’ll start challenging him in the strike zone more on the first pitch — maybe with offspeed pitches, something that pitchers mostly haven’t tried yet. They’ll aim inside, where Trout’s power is down this year. They’ll continue to hunt holes in his game, small edges that they can use to blunt Trout’s effectiveness.

But until I see some evidence to the contrary, I don’t think it will matter. Pitchers can adjust all they want, try any gambit they’d like. For the most part, it seems like adjusting to beat Trout only plays into his hands. Someday, Mike Trout will grow old. He’ll slow down, get worse at recognizing pitches, stop instilling terror into opposing pitchers the way he does now. That day still feels infinitely far off, though. For now, he’s three steps ahead, putting up unreal numbers while shrugging off regression. Pitchers can plan all they want. Trout won’t stop laughing his way around the bases any time soon.


The Most Exciting Team in Baseball

As a baseball fan, winning feels great and losing feels awful. When teams win in dull fashion, fans are generally content to take the wins even if they aren’t all that thrilling. The Astros, Twins, and Dodgers are blowing teams out on a regular basis, but those wins aren’t causing too much consternation. But on the other end of the spectrum are teams that lose a lot of games and fail to provide much excitement during those contests. These are the bad teams that fall behind early and don’t give too much reason in terms of wins and losses to keep following the game. By combining a team’s winning or losing ways with how important at-bats tend to be, we can determine the most exciting team in baseball, as well as the most miserable club.

To determine how often teams have tension-inducing moments, we can take a look at Leverage Index (LI). Our glossary says “Leverage Index is essentially a measure of how critical a particular situation is. To calculate it, you are measuring the swing of the possible change in win expectancy.” A game’s LI starts at 1.0, and the more meaningful plate appearances gets, the higher the index rises; if plate appearances become less meaningful, the index goes lower. Leverage Index shows up on our Play Logs and is on the bottom of our Win Expectancy graphs. Here’s one for Game 3 of last year’s World Series:

The bars along the bottom identify the biggest moments of the game, even if something big doesn’t show up on the scoreboard. For teams, we are dealing with more than a thousand plays at this point in the season. If we take the average LI of every play, we can see if teams have a tendency to have a decent number of important moments during their games or if things are decided relatively early, with the players playing out games with little chance of changing the outcome. Read the rest of this entry »


Daniel Vogelbach Is Hitting Right (We’ll See About Left)

On May 8, Kyle Seager hurt his left hand. This was bad news for Seager and for the Mariners, but good news for Daniel Vogelbach. With Seager out, Ryon Healy moved from first to third base, covering for Seager; Edwin Encarnación, in turn, moved into the first base slot vacated by Healy, and Vogelbach — who had not previously had a path to much playing time — became the Mariners’ primary designated hitter. Since then, and despite a mixed May that dropped his wOBA from a terrific .481 through April 30 to a diminished but still distinguished .385 after the weekend’s action, Vogelbach has shown all the power that his brawn has always promised and the plate discipline that has always been his calling card to boot. His .313 ISO is now ninth in the game, and behind only Joey Gallo and George Springer in the American League.

Let’s start with the power, both because there aren’t too many people who can do the damage Vogelbach does when he really connects with a baseball, and because it provides a clue to what’s changed this year. When Vogelbach connects, as he did on May 27 at the expense of José Leclerc, the camera tends to pan so far up that it’s clear the operator, like everyone else in the ballpark, has no idea where the baseball is or where it’s going to land. All that is clear, for the few long seconds the ball is airborne, is that it’s gone an awfully long way. After this bomb (only the third in the history of the park to hit the third deck, and the first since Carlos Delgado did it way back in 2001), the Mariners put up a traffic cone and taped over the seat. That’s just fun to watch. Read the rest of this entry »