Archive for Featured

Opt-Outs, Uneasiness Abound During MLB’s First Weekend Back

July 3, 2019 was a pretty typical day for major league baseball. Cody Bellinger hit a walk-off home run in the 10th inning against Arizona to give the Dodgers their league-leading 59th win of the season in their 88th game. Last-place Cincinnati defeated first-place Milwaukee to bring all five NL Central teams within 4.5 games of each other. Stephen Strasburg struck out 14 Marlins without allowing a run. Mike Trout hit two dingers, because of course he did. There were close games and there were clunkers, thrilling displays and frustrating setbacks. You probably forgot about all of it.

This July 3 was, well, different. Temperatures notwithstanding, it might as well have been mid-February, as players from all 30 organizations gathered in their respective ballparks for their first official team workouts in months, after the global COVID-19 pandemic suspended the major league season. Players and staff rejoined their teammates only after first undergoing intake tests for the virus, with several wondering even as they took the field whether they were doing the right thing by attempting to play at all. Those circumstances made for a strange and chaotic first weekend of camp.

Longtime star pitchers David Price and Felix Hernandez announced on Saturday that they would opt out of the 2020 season, one day after veteran catcher Welington Castillo was also reported to have opted out. On Monday morning, Nick Markakis also informed his team he would opt out of the season. Their decisions bring the total number of major league players known to have decided against playing this season to nine. Read the rest of this entry »


Contributions to Variation in Fly Ball Distances

Back in early 2013, I wrote a guest article for Baseball Prospectus entitled “How Far Did That Fly Ball Travel?” In that article, I posed a seemingly simple question: Can we predict the landing point of a fly ball just after it leaves the bat? A more precise way to ask the question is as follows: Suppose the velocity vector of a fly ball just after leaving the bat is known, so that the exit velocity, launch angle, and spray angle are all known. How well does that information determine the landing point? I then proceeded to investigate the question, at least for home runs, with the aid of HITf/x data for the initial velocity vector and the ESPN Home Run Tracker for the landing point and hang time. Using a technique described in the article, that information was used along with a trajectory model to reconstruct the full trajectory and extrapolate it to ground level to determine the fly ball distance. The answer to the question was immediately obvious: The initial velocity vector poorly determines the fly ball distance.

This conclusion led naturally to the next question: Why? One obvious reason is variation in atmospheric conditions, especially wind. However, the data revealed that the variation in home run distance for given initial velocity was as large in Tropicana Field, where the atmospheric conditions are expected to be constant, as in the rest of the league. So that was eliminated, at least as the primary culprit.

The article then went on to consider variation in two other parameters that play a role in fly ball distance: backspin ωb and drag coefficient CD. Neither of these parameters were directly measured. Rather they were inferred, along with the sidespin ωs, in the procedure used to recreate the full trajectory. The analysis showed the following:

  • For a given value of CD, distance increases as ωb increases. This makes sense, since larger backspin results in greater lift, keeping the ball in the air longer so that it travels farther.
  • For a given value of ωb, distance decreases as CD increases. Again this makes sense, since greater drag is expected to reduce the carry of a fly ball. Interestingly, this was the first appearance in print of a suggestion of a significant ball-to-ball variation in the drag properties of baseballs.
  • There was a moderately strong positive correlation between CD and ωb, suggesting that the drag on a baseball increases with increasing spin, all other things equal. Although this effect is well known for golf balls and had been speculated for baseballs in R. K. Adair’s excellent The Physics of Baseball, to my knowledge this is the first real evidence showing the effect for baseballs.
  • Given that both lift and drag increase with increasing ωb and that they have the opposite effect on distance, it was tentatively concluded that at high enough spin rate there would be no further increase (and perhaps even a decrease) in distance with a further increase in spin.

Read the rest of this entry »


Sunday Notes: Kyle Boddy is Bullish on Hunter Greene

The Cincinnati Reds have been eagerly awaiting Hunter Greene’s return from Tommy John surgery. And for good reason. Prior to going under the knife 15 months ago he was hitting triple digits with his heater. Drafted second overall by the Reds in 2017 out of a Sherman Oaks, California high school, Greene is No. 77 on our 2020 Top 100 Prospects list.

According to Kyle Boddy, his return is nigh. Cincinnati’s pitching coordinator recently spent time with Greene in California, and he deemed the 20-year-old’s rehab “basically done.” Throwing in front of a Rapsoto, Greene was “an easy 97-plus [mph], reaching 100-101 when he was rearing back.”

More than a return to health is buoying the return to form. With the help of technology — “he’s really getting into the metrics and analytics” — and a former Chicago White Sox pitcher, Greene has made a meaningful change to his delivery. What had been “long arm action with a big wrap in the back” is now a shorter-and-cleaner stroke.

“That’s a credit to people like James Baldwin, who was the rehab coach and is now our Triple-A coach,” Boddy told me. “JB has worked with Hunter extensively, leaning on materials from Driveline Plus. Hunter has had a tendency to cut his fastball, so we’ve relied on a lot of video to show him how to fix that and get more carry.” Read the rest of this entry »


Will the Compressed Schedule Make Depth Starters More Valuable?

There are plenty of rule changes coming to baseball in the 2020 season. We’ve written about many of them: the universal DH, the extra-innings rule, and expanded rosters, to name a few. Today, I thought I’d take a crack at something less immediately evident but still meaningful: the denser schedule.

In 2019, teams played 162 games in 186 days. That meant the schedule was 13% off days, give or take. Four of them were clustered around the All-Star break, but for the most part, they were spread out evenly. Off days are a welcome respite in a team’s schedule, a break from the grind. Sometimes they’re necessary for travel, of course, but mostly they’re meant just to be time for players to recover from the grueling march to October. This year, 60 games in 66 days means only 9% off days.

For most players, an off day is simply that. For pitchers, however, days of rest carry greater meaning. A day off is a day closer to starting again. Imagine a schedule with 80% off days — a game every five days. Your ace could pitch more or less every game, give or take a maintenance break here and there. Conversely, in a schedule with no off days at all, every pitcher would take the same number of turns in the rotation.

Given an off day, teams can, in theory, squeeze extra starts out of their ace. In practice, it doesn’t quite work that way. It also doesn’t not work that way, however; seven pitchers made 34 starts in 2019, more than a fifth of the games on the schedule. Teams are logical about giving their best starters extra turns when they can. An extra Justin Verlander start beats a Jose Urquidy start, no offense to Urquidy. Read the rest of this entry »


Analyzing the Prospect Player Pool: NL East

Below is another installment of my series discussing each team’s 60-man player pool with a focus on prospects. If you missed the first piece, you’re going to want to take a peek at its four-paragraph intro for some background, then hop back here once you’ve been briefed. Let’s talk about the National League East.

Atlanta Braves

Prospect List / Depth Chart

The Braves have pooled the most catchers in baseball with seven (eight if you count Peter O’Brien and the faint memory of his knee-savers), several of whom are prospects. I think Travis d’Arnaud’s injury history and the implementation of the universal DH makes it more likely that Alex Jackson opens the season on the active roster. I don’t think this would save Atlanta an option year on Jackson since they optioned him in mid-March, and Atlanta’s bench projects to be very right-handed, so he might be competing with Yonder Alonso for a spot.

We’re probably an Ender Inciarte injury away from seeing Cristian Pache play in the big leagues every day. Aside from him, I doubt we see any of the recently-drafted position players (Drew Waters, Braden Shewmake, Shea Langeliers) playing in the bigs this year, and if William Contreras debuts it’s likely because a couple guys ahead of him have gotten hurt. Read the rest of this entry »


Breaking Bob: The 60-Game Season and the ERA Record

One of the greatest myths of baseball history is the asterisk supposedly added to Roger Maris‘ then-record 61 home runs in the 1961 season. As the story goes, Major League Baseball, aghast that Babe Ruth’s home run record could be broken by Maris in a 162-game season when Ruth’s Yankees only played 154 games, forced Maris’ record to wear scarlet punctuation in order to shame it in the record books. The only problem is that the Maris asterisk never actually happened. Commissioner Ford Frick, who held the job at a time when he was still expected to at least give lip service to the idea of being a steward to the abstract notion of baseball, was simply expressing his opinion; no asterisk ever appeared next to Roger Maris’ name or record.

The truth about baseball’s record book is that its entries have never had much in the way of purity. From changes in the baseball and the mound to whether players could or could not spit on the ball, numbers in one season never really mean exactly what numbers in other seasons do. Not even baseball’s greatest shame — enforcing a grotesque color line that robbed countless star baseball players of their turn in the majors — resulted in a culling of statistics from the game’s first century.

Records tend to be set in an environment conducive to setting them. No dead ball season features a player with a home run total in even the top 1,000 in history; there’s a reason that strikeout records, both positive and negative, are a feature of modern baseball, not antiquity. Bob Gibson’s 1.12 ERA in 1968 is currently recognized as baseball’s number to beat only because the dead ball era was deemed to be too different; Tim Keefe, Dutch Leonard, and Three Finger Brown each boast one better than Gibson’s. And Gibson’s record itself reflected the environment — The Year of the Pitcher resulted in baseball lowering the mound by a third and reducing the size of the strike zone for the 1969 season. Read the rest of this entry »


Will a Player Hit .400 This Season?

The 2020 season, assuming it happens and is completed, is sure to have some quirky statistics that will be tough to wrap our heads around. The home run leader might not even get to 20 dingers this year. A three-win season might lead all of baseball. And while batting average has fallen out of favor as the be-all, end-all of a hitter’s talent at the plate because walks matter and getting a double is better than getting a single, hits are an undoubtedly good pursuit for batters. As such, the aura of batting average still maintains some glow when contemplating the history of baseball. The pursuit of a .400 batting average in a shortened season due to a pandemic will not and should not be viewed with the same historical significance as Ted Williams’ run in 1941, or even George Brett’s 1980 campaign or Tony Gwynn’s strike-shortened 1994 season, but it would make this season a little more fun.

Ty Cobb, George Sisler, and Rogers Hornsby all put up batting averages above .400 nearly 100 years ago, while Ted Williams was the last player to hit that mark nearly 80 years ago. The list of players who have even hit .375 since then is a short one: Stan Musial’s .376 (1948), Williams’ .388 (1957), Rod Carew’s .388 (1977), George Brett’s .390 (1980), Tony Gwynn’s .394 (1994), and Larry Walker’s .379 (1999). The last player to hit above .350 was Josh Hamilton, who hit .359 in 2010. History has shown that if a very high batting average is your goal, the odds are very much stacked against you in a full season. Shrink the season down to just 60 games, though, and we might get a fighting chance. Read the rest of this entry »


Analyzing the Prospect Player Pool: AL East

Many species of shark, most commonly lemon sharks, give birth in shallow, nutrient-rich mangroves teeming with small sea life that can easily sustain their offspring while also insulating them from the predators typically found in deeper, open waters. Most young sharks spend years feasting in these hazy, sandy green mangroves until they’ve grown, then head out to sea. Some leave the safety of the roots and reeds early and enter the blue black depths at greater risk of a grisly fate. Many of them won’t make it. The ones that do will likely become the strongest of all the adult sharks.

Now that teams have announced their 60-player pools for the upcoming season, we can see how they’ve balanced rostering players who can help them compete this season with prospects for whom they’d like to ensure playing time, while avoiding prospects whose service time clocks they don’t want to risk winding. Below, I have analysis of the prospects in the player pools for the AL East clubs. I’ll be covering every division in the coming days, with some divisions requiring their own piece and others combined where appropriate.

Two of our site tools go hand-in-hand with this piece. The first is The Board, which is where you’ll want to go for scouting reports on all of these players (click the little clipboard), as this piece focuses on pathways to playing time and potential roles and strategic deployment rather than on scouting. Perhaps the more relevant visual aid are Jason Martinez’s RosterResource pages, which outline the player pools that have been dictated by all 30 teams in a depth chart format, and also include columns that indicate where the prospects in the pools rank within each club’s farm system.

A couple roster mechanics to keep in mind as you read: Teams are allowed a 60-player pool. They don’t have to roster 60 guys from the start; not doing so allows them to scoop up released or DFA’d players without cutting someone. Within those 60 players still exists the usual 40-man roster rules from which teams will field an active roster of 30 players, a number that will shrink to the usual 26 as the season moves along. Big league clubs are allowed a three-man taxi squad that can travel with the team but isn’t part of the active roster; that squad must include a catcher (this is clearly to mitigate the risk of some injury/COVID/travel-related catastrophe). Players not invited to big league camp, or who aren’t on the active roster (40-man players and beyond) when the season begins, will train at an alternate location, typically a nearby minor league affiliate. Lastly, only players in the 60-man pool (including prospects) may be traded during the season. Read the rest of this entry »


Four Things We Learned from 60-Man Player Pool Day

With players set to report to camp on July 1, yesterday was the day teams submitted their 60-man player pools to MLB. While there is certainly going to be considerably more maneuvering as teams set up their own camps (plus a satellite camp for those pool players not invited to major league camp), teams’ initial rosters can tell us a little about how clubs plan to operate over the next few weeks and potentially into the season. Here’s what we can say so far.

A 60-Man Player Pool is Not a 60-Man Player Pool

While we were perhaps expecting a 60-man player pool for every team, many clubs fell far short of that number. You can check every team’s initial selections on our Roster Resource Opening Day Tracker; those pages also project Opening Day rosters. Overall, teams put out rosters averaging 53 players. The Indians, Tigers, Royals, Astros, Angels, Yankees, Mariners, Rays, Rangers, Blue Jays, Braves, Reds, Marlins, Phillies, Pirates, Padres, and Nationals were all at capacity or were a handful of players away from reaching the 60-player limit. The Diamondbacks, Twins, and Giants didn’t even release rosters yesterday, while the Orioles, White Sox, Brewers, and Cardinals were all at 45 players or fewer. We will have to wait for full roster information on about half the teams.

Placement in the Player Pool is Pretty Permanent

Later this week, Jay Jaffe is going to analyze the roster rules contained in the 2020 Operations Manual and how they will affect the season, but one wrinkle in particular caught the attention of twitter yesterday, including The Athletic’s Levi Weaver. That wrinkle concerns how players are moved in and out of the 60-man pool depending on their 40-man status. Per the Operations Manual:

In the event a Club is at the limit and wishes to add a player to its Active Roster or its Alternate Training Site, the Club must select a player to be removed from the Club Player Pool by means of a bona fide transaction, as follows:

  • 40-man roster players may be removed from the Club Player Pool by an approved trade, waiver claim, return of Rule 5 selection, release, outright assignment, designation for assignment, placement on the 60-day Injured List, placement on the COVID-19 Related Injured List, or placement on the Suspended List (by Club), Military, Voluntarily Retired, Restricted, Disqualified, or Ineligible Lists.
  • Non-40-man roster players may be removed from the Club Player Pool by an approved trade, release, placement on the COVID-19 Related Injured List, or placement on the Military, Voluntarily Retired, Restricted, Disqualified, or Ineligible Lists. Injured non-40-man roster players will continue to count against the Club Player Pool limit unless removed through one of the permitted transactions listed above.

Read the rest of this entry »


FanGraphs Prep: Regression Towards the Mean

This is the sixth in a series of baseball-themed lessons we’re calling FanGraphs Prep. In light of so many parents suddenly having their school-aged kids learning from home, we hope is that these units offer a thoughtfully designed, baseball-themed supplement to the school work your student might already be doing. The first, second, third, fourth, and fifth units can be found here, here, here, here, and here.

Overview: A one-week unit centered around understanding the concept of regression to the mean. This can be a difficult concept to grasp but it’s important for any aspiring statistician to understand.

Learning Objectives:

  • Explain the difference between “true talent” and a statistic.
  • Use algebra to calculate probabilities.
  • Estimate future performance using a projection.
  • Identify and apply Regression to the Mean.

Target Grade-Level: 9-10

Daily Activities:
Day 1
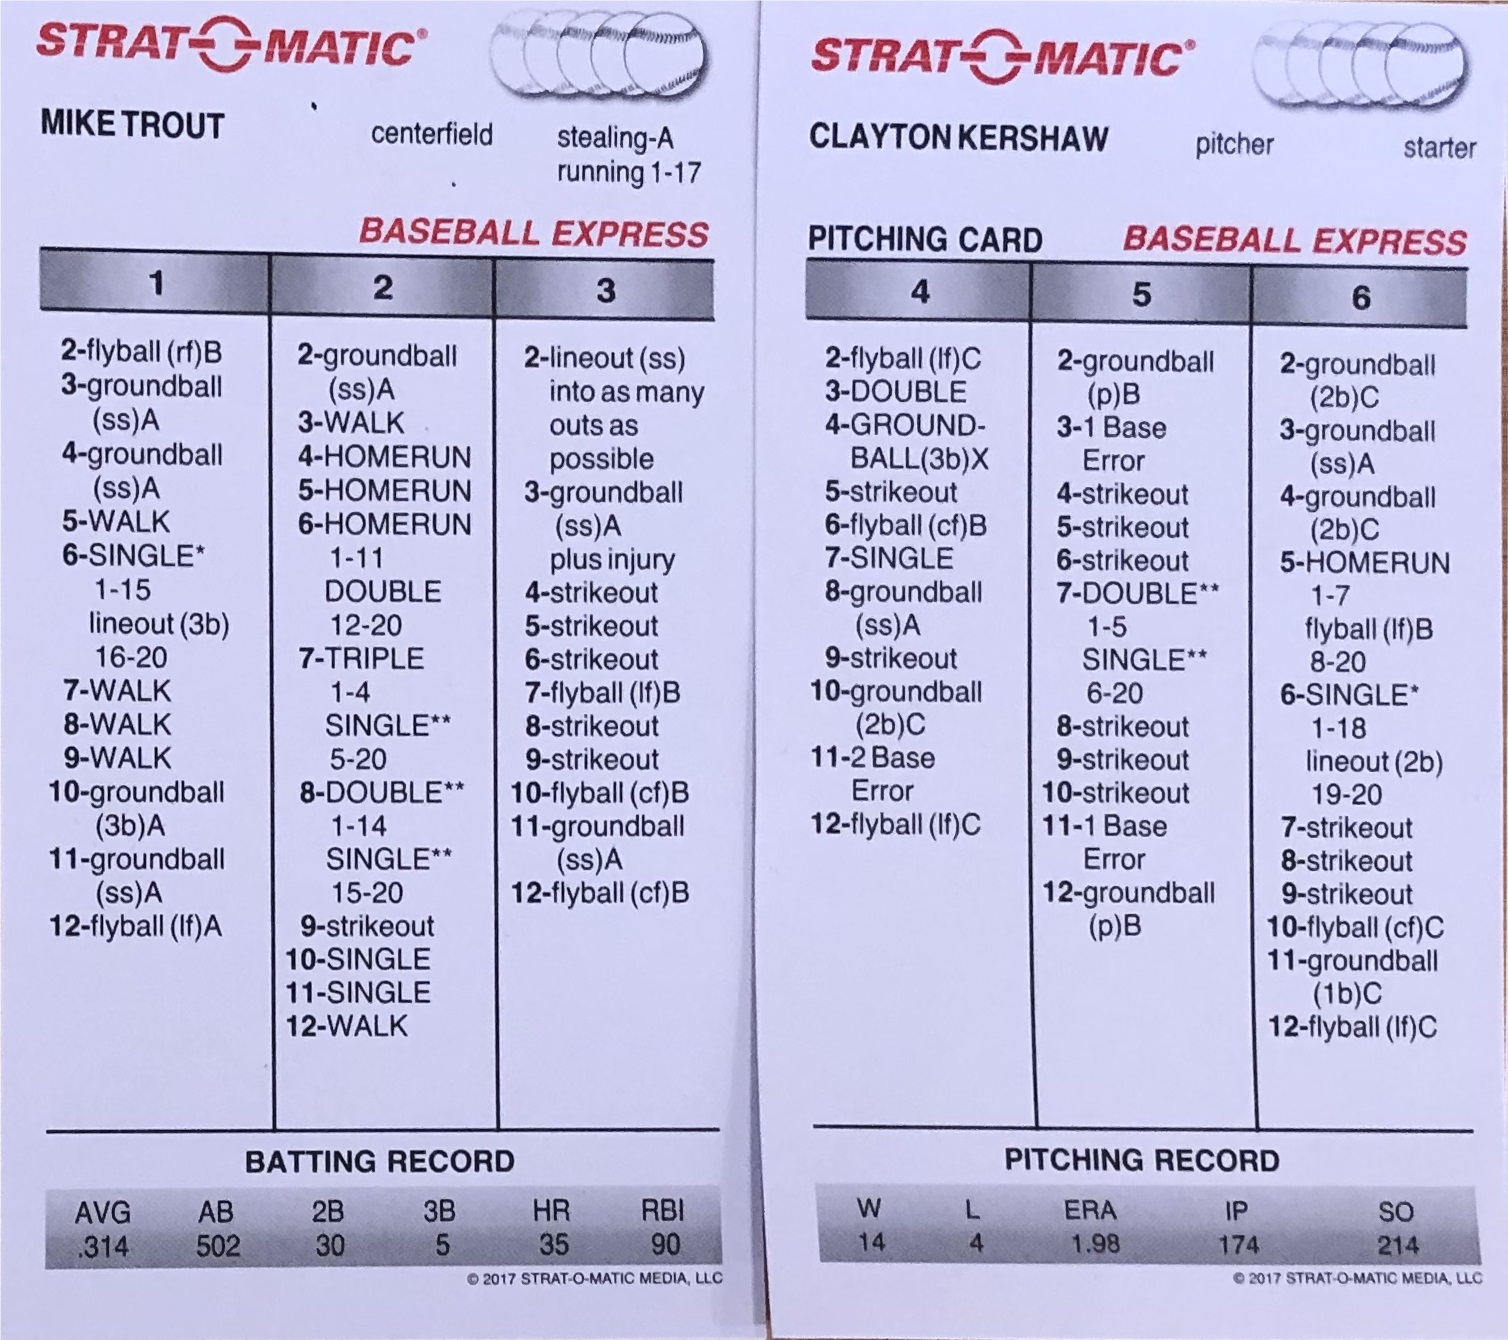
Strat-O-Matic is a two-player card-based baseball game. You start by making lineups and then play out a series of batter-pitcher matchups like the one below between Mike Trout and Clayton Kershaw.

Each matchup involves rolling three six-sided dice. The first one tells you which column to use and the next two determine the outcome, although sometimes we will need to roll an additional 20-sided die. For instance, if the first die roll is a 1, we’ll direct our eyes to the left-most column on Trout’s card. If the next two dice add up to 7, Trout has worked a walk. Read the rest of this entry »