Archive for Featured

2019 Positional Power Rankings: Catcher

After Craig Edwards and Rian Watt surveyed the current state of second and third basemen yesterday, our positional power rankings continue today with catcher.

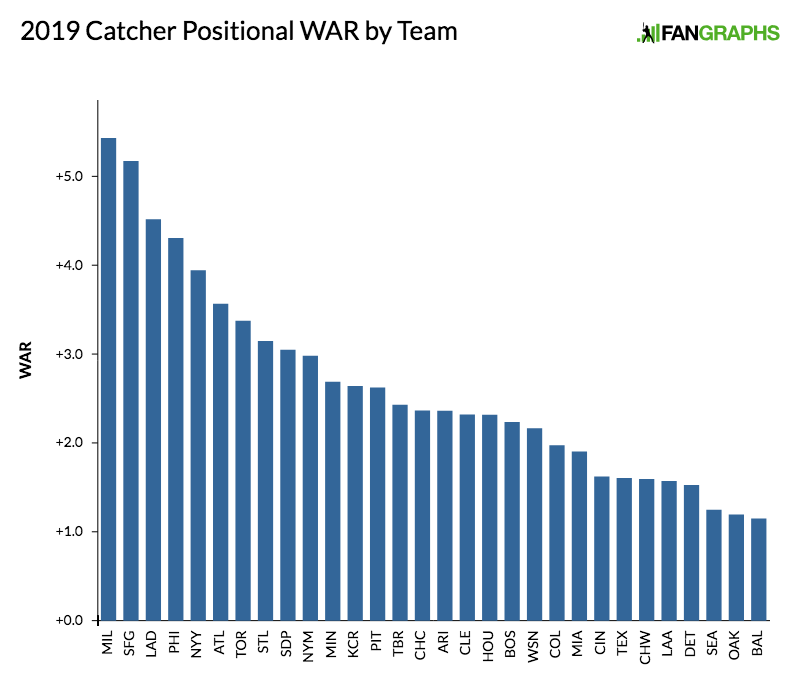
The catching position hit an 11-year low in wRC+ (84) and also dipped below 50 WAR for the first time in that same span (49.9). Just two guys topped 4.0 WAR, and neither Yasmani Grandal (4.9) nor J.T. Realmuto (4.8) reached a full 5.0 wins. Compare that to just five years ago, when five guys had at least 5.0 WAR and two of them rounded to eight wins: Yan Gomes (5.3), Rene Rivera (5.3), Russell Martin (6.5), Buster Posey (7.8), and Jonathan Lucroy (8.1). Part of the issue is that teams are much more open to splitting the duties among multiple players, which makes it tougher for even the top end to generate big numbers. In 2014, there were 23 catchers with at least 400 plate appearances, but that figure dipped to just 15 a year ago.

The 2019 pool has already lost a stalwart with Salvador Perez needing Tommy John surgery, although he hasn’t topped 1.0 WAR since 2014 and has surpassed an 89 wRC+ just once in that same time frame (103 in 2017). The position is aging and hasn’t backfilled with prospects quickly enough to replace the old guard. Looking at those top performers from 2014, we see that they are all still playing but managed just a combined 6.9 (nice) WAR despite four of the five logging at least 350 plate appearances.

Do not fret, though, the backfill is on the way! Danny Jansen debuted last year but will play out his rookie season in 2019. Francisco Mejia has essentially had sips of coffee each of the last two years and still holds rookie eligibility. Meanwhile, 10 other catchers made it into our Top 100 Prospects list, including three in the Top 50: Keibert Ruiz for the Dodgers (15), Sean Murphy for the Athletics (35), and Joey Bart for the Giants (41). Read the rest of this entry »


FanGraphs Pitch Framing

In 2008, when Dan Turkenkopf was the first to quantify the value of pitch framing, he noted that it appeared to be alarmingly important. Bill Letson was similarly astounded when he calculated the size of the effect in 2010. Max Marchi and Mike Fast each took a turn in 2011, finding large and highly correlated catcher values despite using different methods. Other sabermetric luminaries have contributed sophisticated methods and sanity checks, some of which I’ll touch on below. And yet, this terrifically important, seemingly well-established, and impressively repeatable defensive skill has been left out when calculating FanGraphs player WAR and ignored when Steamer forecasts pitchers and catchers. . . until now.

In what follows, I’ll briefly lay out a series of steps for calculating how many framing runs each catcher contributed as well as and how many extra strikes each pitcher was granted (or, in some cases, earned). This much has all been done and clearly described before thanks to Dan Brooks and Harry Pavlidis; that research was updated and expanded upon by Pavlidis and Jonathan Judge. I’ll then compare the values I’ve obtained to the ones created by Baseball Prospectus, StatCorner, and Sports Info Solutions and demonstrate (I hope) that those extra strikes really do result in extra strikeouts and fewer walks. Lastly, I’ll discuss what this means for Steamer forecasts.

Modeling the Strike Zone

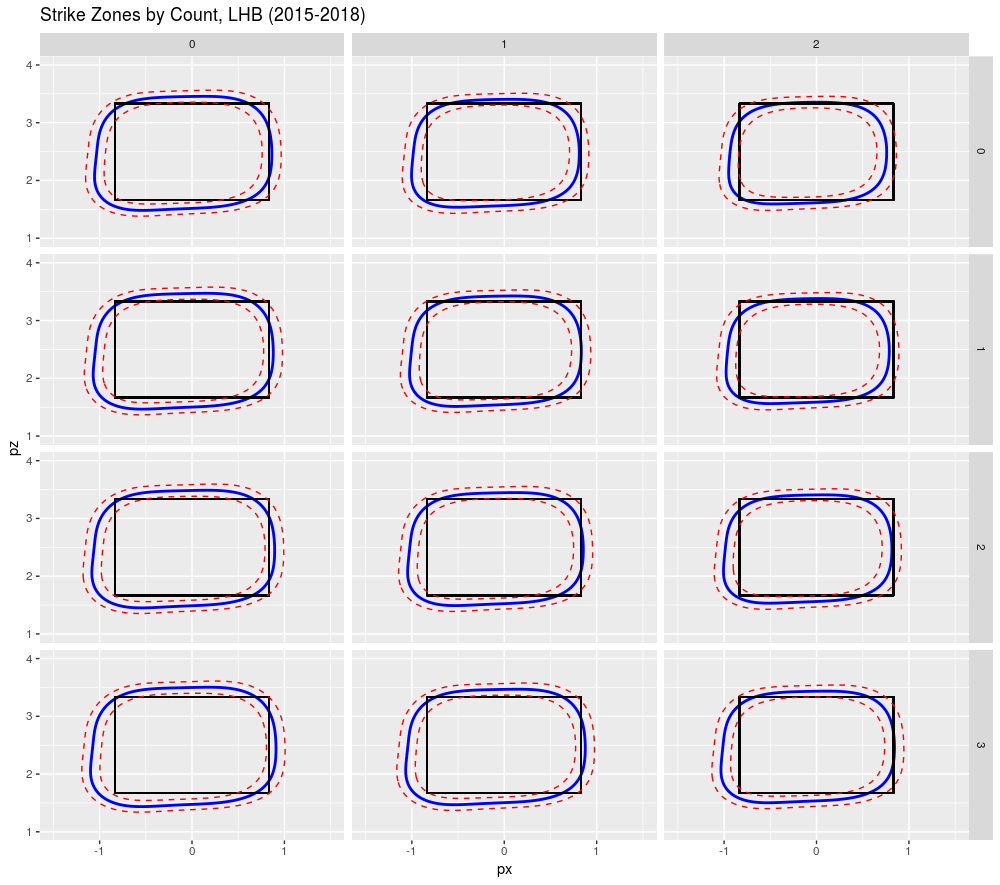
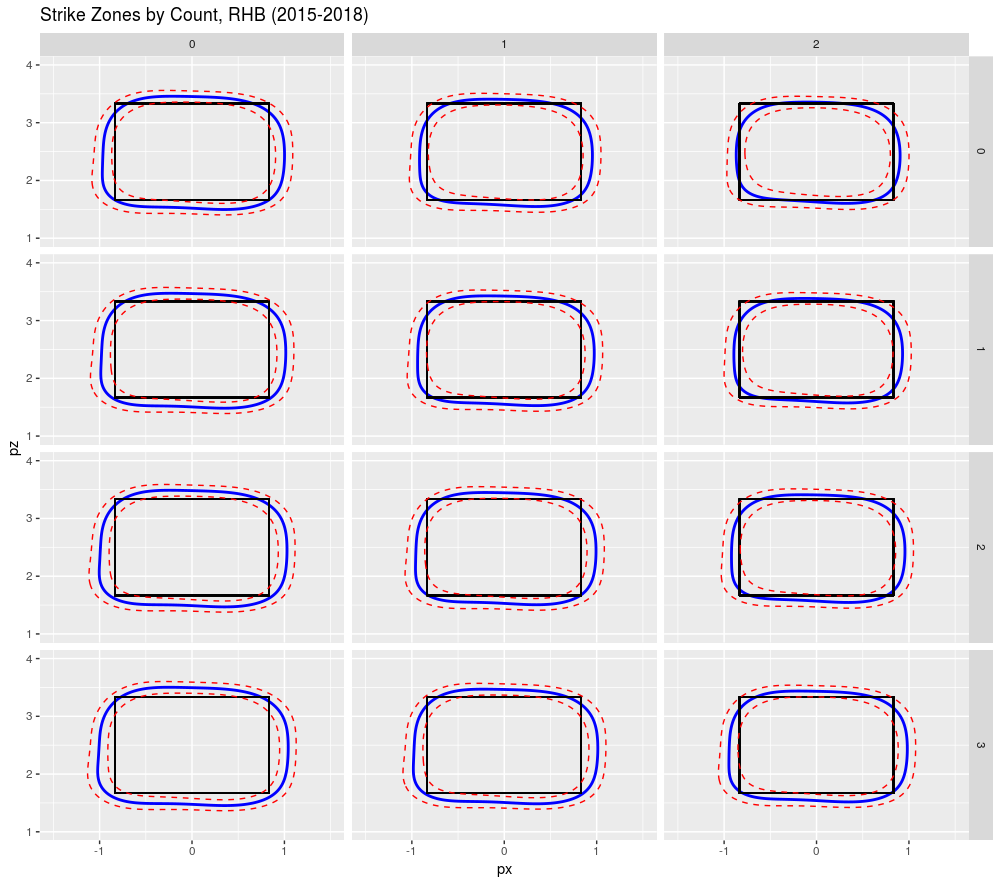
It all starts with the strike zone and I started by using generalized additive models to estimate the probability of a strike in any count, to either left-handed or right-handed batters at each location in and around the plate. On the first pass (shown below), I created strike zones averaged across seasons and, on the second pass, looked for changes in the strike zone by season. The blue contour lines in the images below show where strike calls are a coin flip and the red dashed lines show where we’d expect a 25% or 75% chance of a strike. If you’re read Matt Carruth or Jon Roegele, you’ll be unsurprised to see a small 0-2 strike zones (shown in the upper right facets) and large 3-0 strike zones (in the lower left).

Read the rest of this entry »


Mike Trout Leaves Money On the Table Again

Mike Trout is a better player than Bryce Harper and Manny Machado combined. He’s been more than twice as valuable as each of those players in their young careers. And yet Mike Trout is about to agree to a contract that, per ESPN’s Jeff Passan, will pay him like he’s one of the greatest players of this generation instead of potentially being the greatest player of this century, and one of the greatest baseball talents of all time. As first reported by Passan, Mike Trout and the Angels have agreed to a 12-year deal worth $430 million, with Bill Shaikan reporting the deal will come in at $426.5 million. Because Trout was already owed $66.5 million over the next two seasons, the contract is functionally a 10-year extension worth $360 million. Trout is essentially accepting something similar to the Harper/Machado deals two years in advance. This is not the first time Trout has made this choice, which is very much a personal decision, but it is one that has cost him potentially hundreds of millions of dollars.

In 2014, Trout was coming off an eight-win season, which itself came on the heels of two 10-win campaigns. His 29.2 WAR mark through his age-22 season was the best in baseball history. Before he signed a six-year, $144.5 million contract giving away three free agent seasons, Dave Cameron wrote about the potential for a contract extension, and expected a figure more than $100 million higher. When Trout actually signed, Cameron followed up:

You don’t need another 1,500 word explanation of why this is a hilarious steal for the Angels. Trout would have made something like $50 to $60 million in arbitration had he gone year to year, so the Angels are basically getting three free agent years for $85 to $95 million. This doesn’t come anywhere near Trout’s value, and Trout has left an enormous amount of money on the table. Even if his goal was to reach free agency again and sign a second monstrous contract, he still is worth so far more than the roughly $30 million per year he signed away three free agent years for.

That bargain five years ago made the current one possible. Because Trout had two more years left until free agency (instead of entering the market last offseason), he was limited to the Angels when it came to contract partners. Because the Angels’ risk of losing Trout wasn’t going to present itself for another two seasons, any new contract with him was going to come with a discount. In this case, the discount meant signing a deal like Harper and Machado’s instead of one like Alex Rodriguez’s.

After Harper and Machado signed their contracts, I attempted to compare the two deals because it can be difficult to put a 13-year deal and a 10-year deal for differing amounts into proper context. The present-day values of each contract is below, with the numbers translated into a 10-year deal, and Trout’s contract listed with just the extension (2021-2030), as well as with the two years Trout was already guaranteed (2019-2030). The numbers have been updated now that we know Trout is paid $36 million the next two seasons and $35.45 million each year beginning in 2021.

Present-Day Value of the Mike Trout Contract
Total Value Present-Day Value 10-Year Equivalent
Bryce Harper $330 M $220.8 M $305 M
Manny Machado $300 M $217.4 M $300 M
Mike Trout (2021-2030) $360 M $225.5 M $311 M
Mike Trout (2019-2030) $426.5 M $289.6 M $400 M

The Angels appear to have looked at Mike Trout and said, “We know we owe you about $65 million over the next few seasons. Keep that and we will give you the Harper/Machado contract right now.” Trout said yes, and now the Angels have one the best players in baseball history locked in for his age-29 through age-38 seasons. Even when you factor in the two years Trout is already owed, that $400 million is significantly below his value, assuming that Machado and Harper are worth $300 million. Those two years left until free agency meant a massive discount for the Angels.

When we call this deal a bargain, we can look at Mike Trout’s contract relative to Harper and Machado’s, and know that Trout is only receiving a little more money despite being a lot better. We can also look at potential future value. I love to look at comps and try to get a sense of a player’s future, but comps aren’t really fair for Mike Trout because there are barely a handful of players who even come close to his level of play. Consider Trout’s career trajectory by year, and the number of players ahead of him by WAR.

Mike Trout By Age
Age Season Trout WAR Players Better Since 1901
Through Age-20 10.8 Mel Ott
Through Age-21 21 NA
Through Age-22 29.2 NA
Through Age-23 38.5 NA
Through Age-24 48.2 NA
Through Age-25 55.1 Ty Cobb
Through Age-26 64.9 NA

Ty Cobb the only comp for Mike Trout. Ty Cobb! Trout ranks third right now through age-27 even though he hasn’t even played the season yet, and he needs just four wins to pass Cobb and Mickey Mantle. He’s already surpassed the average Hall of Famer. Maybe you think that the early start to Trout’s career inflates the numbers. Even taking away his first two seasons, from age-22 through age-26, the only players with more WAR are Mantle and Cobb. Even just looking at the last three years, which includes an injury-shortened 2017 campaign, only Babe Ruth, Mantle, Rogers Hornsby, Jimmie Foxx, Lou Gehrig, Tris Speaker, Alex Rodriguez, and Cobb are ahead of Trout. If Trout plays like any of those players, he’ll cost something like $4 million to $5 million per win over the last 10 years of the deal. If we wanted to conservatively estimate the current value of a win on the free agent market at $9 million without any inflation, Trout wouldn’t need to age like one of the 10-best players in history — aging like the 50th would still be a good value.

The deal is such a slam dunk for the Angels that it feels a little silly to talk about what it means in baseball terms. The Angels get to keep one of the best players in history. They can now plan for the future knowing they have Trout. It would have been fun to see what an all-in Angels team would’ve looked like in 2020 with Trout a pending free agent, but hopefully this deal means we get to see the fun of a franchise that is secure in its star ensuring that that star gets a ring. After all, Mike Trout in the playoffs is good for baseball.

When it comes to adjusting the biggest contracts in baseball history for inflation, this one is a little tough to assess. We have that $430 million, but we also have that $363.5 million that doesn’t kick in until 2021. To provide some historical context — as I did for Machado and Harper earlier this offseason and later updated — I’ve included two Trout contracts below. The first is the $426.5 million figure representing the total value of the money owed to Trout; the second is Trout’s extension, assuming 5% inflation in the following two seasons.

Biggest Contract in MLB Adjusted to 2019
Player Year Years Total Value ($/M) 2019 Adjustment ($/M) AAV 2019 ADJ ($/M)
Alex Rodriguez 2001 10 $252 M $592 M $59.2 M
Alex Rodriguez 2008 10 $275 M $448 M $44.8 M
Derek Jeter 2001 10 $189 M $444 M $44.4 M
Mike Trout 2019 12 $426.5 M $426.5 M $35.5 M
Giancarlo Stanton 2015 13 $325 M $393 M $30.3 M
Manny Ramirez 2001 8 $160 M $376 M $47 M
Albert Pujols 2012 10 $240 M $358 M $35.8 M
Bryce Harper 2019 13 $330 M $330 M $25.4 M
Ken Griffey, Jr. 2000 9 $116.5 M $330 M $36.6 M
Mike Trout (extension only) 2021 10 $360 M $327 M $32.7 M
Prince Fielder 2012 9 $214 M $319 M $35.4 M
Robinson Cano 2014 10 $240 M $310 M $31 M
Manny Machado 2019 10 $300 M $300 M $30 M
Kevin Brown 1999 7 $105 M $297 M $42.5 M
Joey Votto 2014 10 $225 M $290 M $29 M
Mark Teixeira 2009 8 $180 M $290 M $36.2 M
Joe Mauer 2011 8 $184 M $289 M $36.1 M
Mike Hampton 2001 8 $121 M $284 M $35.5 M
Clayton Kershaw 2014 7 $215 M $277 M $39.6 M
Todd Helton 2003 9 $141.5 M $277 M $30.8 M
Jason Giambi 2002 7 $120 M $276 M $39.4 M
Carlos Beltran 2005 7 $119 M $263 M $37.6 M
Nolan Arenado 2019 8 $260 M $260 M $32.5 M

When stacked up against comparable players and comparable contracts, Mike Trout was a humongous bargain in his last contract and will be one in his the next, but if we can play devil’s advocate a little, it’s tougher to determine how much Trout actually cost himself. Let’s say he had been a free agent last offseason like he would have without a contract extension. What would his contract have been? There’s a reasonable argument for 15 years and $600 million. Look at the Alex Rodriguez contract above. In another two years, might $500 million been on the table? That might have been what Trout was looking at, but what if last year the market didn’t quite develop as he had hoped, and he ended up with just $500 million? What if the top offer had only been $400 million after 2020? Does that seem so far-fetched given the way these past two offseasons have progressed?

Trout is now set to make around $460 million for the remainder of his free agent years. He jumped the gun twice and took a discount. The value he will provide will far exceed the money he is set to earn. It’s possible, however, because of the way spending has progressed, that Trout has actually cost himself little to no money by signing these extensions. Mike Trout was always going to be a bargain; we have a hard time wrapping our heads around the number he’s really worth. He’s the best player in baseball, and simultaneously the most underrated one. That’s a ridiculous feat, but with Mike Trout, we’ve grown accustomed to ridiculous feats.


2019 Positional Power Rankings: Third Base

You’ve read the intro. You’ve read about first basemen and second basemen. You know how to count. You know what time it is. As our positional power rankings continue, let’s talk about third base.


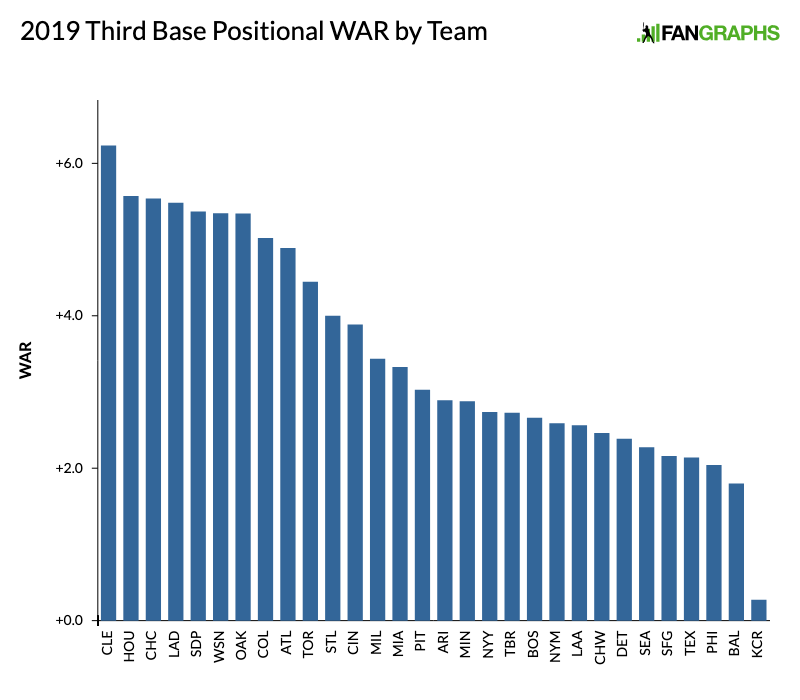
This, friends, is a very good time to like watching baseball men play a good third base. Fully half of the top 10 players by WAR last year were third basemen, and only three of those five men make the top five of our rankings. The 8th-ranked player on this list, Nolan Arenado, is projected for nearly five wins this year, and the 10th-ranked player is the consensus top prospect in the game. Your mileage may vary, but I see roughly four tiers here: An elite No. 1-8, any one of whom can at times threaten to be among the best players in the game; a very strong second tier No. 9-13, the top of which contains players who have been in the past or could be in the future very good; a perfectly solid and mostly indistinguishable third tier running from No. 14 to No. 29, containing every possible diversity of age, experience, upside, and talent; and then the Royals. Let’s dive in. This will be fun. Read the rest of this entry »


2019 Positional Power Rankings: Second Base

On Monday, Jay Jaffe kicked off our positional power rankings series by evaluating first basemen. If you need a refresher on the process or the concept behind the series, Meg Rowley wrote a handy explainer. Today, we stay on the infield and tackle second base.

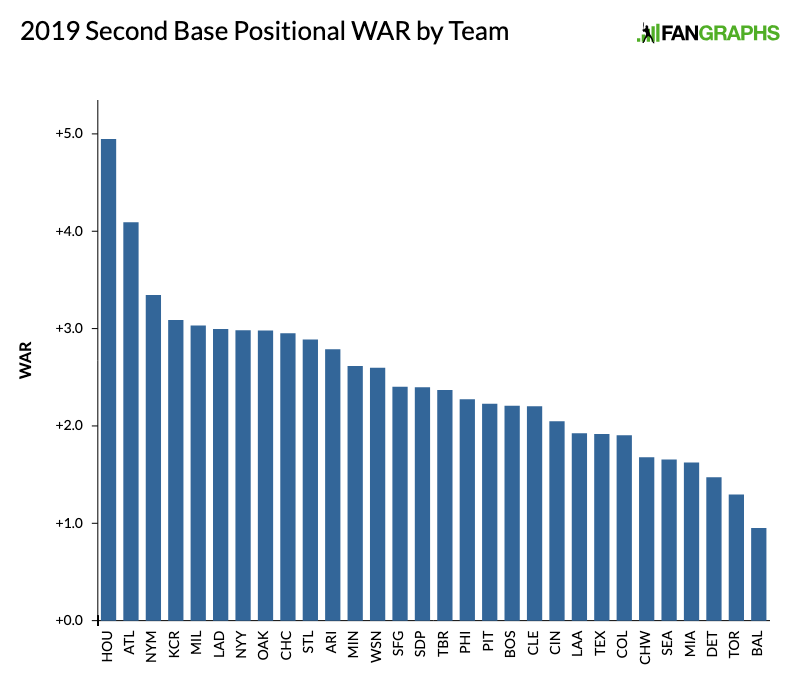
The stereotype surrounding second base is that these players aren’t good enough defensive players to man shortstop and aren’t good enough hitters to play third base. There are those that defy those conventions. Jose Altuve is one of the best players in the game. Javier Baez and Ozzie Albies can handle short. Robinson Cano has been one of the better hitters in baseball for a decade. Mike Moustakas probably should be a third baseman, but weirdly won’t be one this year. There are many, however, for whom those traditional designations fit. Only two teams have four-win projections at the position, with a bunch of high-floor three-win types. That doesn’t scream stardom, but there’s a lot of hidden upside in these projections. In addition to Albies, we see possible stars in Gleyber Torres and Luis Urias. Javier Baez only gets partial playing time at second. Scott Kingery, Carter Kieboom, Keston Hiura, Bo Bichette, and Nick Madrigal don’t play a huge role below, but they do represent talented young players who could help their teams to the top of these rankings in the years to come. Read the rest of this entry »


2019 Positional Power Rankings: First Base

Earlier today, Meg Rowley introduced this year’s positional power rankings. As a quick refresher, all 30 teams are ranked based on the projected WAR from our Depth Charts. Our staff then endeavors to provide you with some illuminating commentary to put those rankings in context. We begin this year’s series with first base.

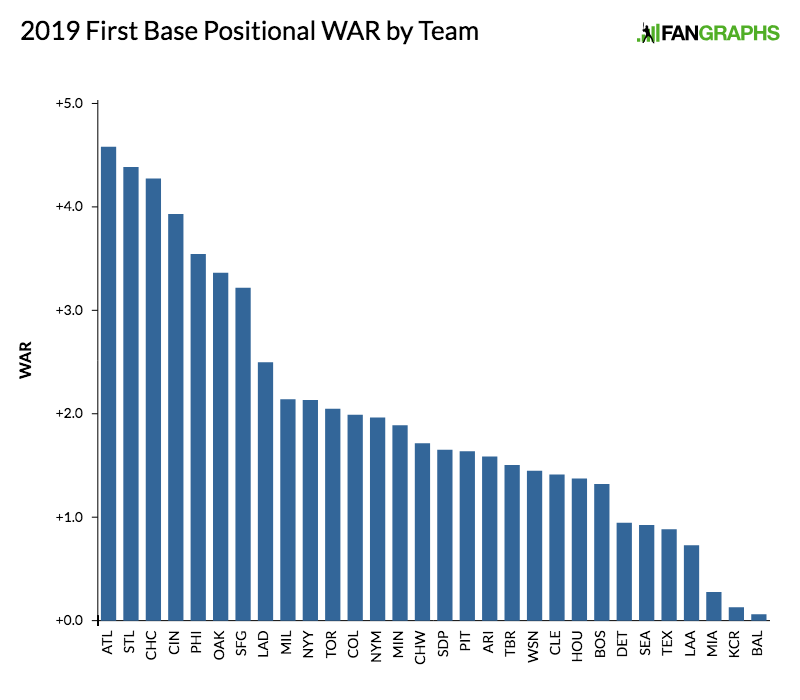
A year ago, first base looked to be a deep position, with a familiar set of stars occupying the top tier of the rankings, impressive debutantes such as Cody Bellinger and Matt Olson entering their first full major league seasons, and some long-toiling veterans such as Yonder Alonso, Justin Smoak, and Eric Hosmer appearing to have finally figured out how to mash at the level expected for the position. As a group, first basemen had combined for a 117 wRC+ in 2017 (their highest mark since 2011) and 70.2 WAR (their highest mark since 2009).

Things didn’t go as planned for the position’s denizens in 2018. Paul Goldschmidt, Anthony Rizzo, and Joey Votto all got off to slow starts. Bellinger and Olson weren’t quite as impressive as they had been as rookies, with the former spending a lot of time in the outfield to boot. Hosmer, the recipient of the offseason’s biggest free agent contract, was a replacement level dud, and Alonso and Smoak both regressed. Joe Mauer faded after his best season since moving from catcher, Miguel Cabrera got hurt before he could rebound from a subpar 2017, and Chris Davis, who had been mediocre in 2017, turned in a season for the ages — but in the wrong way. And so on and so on. All told, first basemen’s production sank to a collective 108 wRC+ and 46.9 WAR in 2018, their lowest marks by either measure in our splits, which only go back to 2002 for such things. Collectively, their slugging percentage dropped from .487 to .438, and their on-base percentage from .347 to .333. Read the rest of this entry »


2019 Positional Power Rankings: Introduction

Welcome to the 2019 positional power rankings! As is tradition, over the next week and a half, we’ll be ranking every team by position. This is always something of a funny exercise. You read FanGraphs every day (thank you!) and are well-versed in the goings on of the offseason, glacial though they may have been at times. You probably know that Bryce Harper is on the Phillies, and that Manny Machado is a Padre, and that Brian McCann found his way back to Atlanta. You probably recall that Craig Kimbrel, who was tied with Kenley Jansen for the best individual reliever projection in last year’s iteration of this series, is still unsigned. You almost certainly do not remember every 30-something free agent who ended up on the Texas Rangers, but that’s ok. I’m the managing editor of FanGraphs, and I’ve been surprised by a few of those guys while watching spring training action. All of that is to say, you know what’s going on. And yet the anticipation of the season, the sound of wooden bats, and those clear, sunny days, makes you want to read even more about baseball and what it might look like over the next seven months or so. This is our answer to that impulse.

This post serves as an explainer for our approach to these rankings. If you’re new to our rankings, I hope it helps to clarify how they are compiled and what you might expect from them. If you’re a FanGraphs stalwart, I hope it is a useful reminder of what we’re up to. If you have a bit of time, here is the introduction to last year’s series. You can use the handy nav widget at the top to get a sense of where things stood before Opening Day 2018.

Unlike a lot of season previews, we don’t arrange ours by team or division. That is a perfectly good way to organize an exercise like this, but we see a few advantages to the way we do it. First, the positional rankings allow us to cover a team’s roster top to bottom, with stars and role players alike receiving some amount of scrutiny, while also placing those players (and the teams they play for) in their proper baseball context. By doing it this way, you can easily see how teams stack up against each other, get a sense of the overall strength of a position across the league, and spot places where a well-deployed platoon may end up having a bigger impact than an everyday regular who is just ok. We think all of that context helps to create a richer understanding of the state of things and a clearer picture of the season ahead. Read the rest of this entry »


Sunday Notes: Chuck Cottier’s Memorable Pro Debut Was 65 Years Ago

Chuck Cottier made his MLB debut in a star-studded environment. Playing second base, he was in the Milwaukee Braves lineup alongside the likes of Hank Aaron, Del Crandall and Eddie Mathews. The first ground ball he fielded on that April 1959 afternoon came off the bat of Roberto Clemente, on a pitch thrown by Warren Spahn. Harvey Haddix, who a month later would take a a perfect game into the 13th inning against the Braves, was on the mound for Pittsburgh.

Cottier’s first professional game was also memorable. Just 18 years old at the time — he’d signed at 17 out of a Grand Junction, Colorado high school — Cottier was playing for the Americus-Cordele Orioles in the Georgia-Florida League. It was 1954, and the minor league landscape was different than it is today.

“The lowest league was class D,” explained Cottier, who is now 83 years old and a special assistant to the general manager with the Washington Nationals. “From there it went to C, B, A, Double-A, Triple-A, and many of the organizations had two teams in each classification. We had three Triple-A teams at one time.”

Displaying a sharp-as-a-tack memory, the venerable baseball lifer told me that his first-ever game was played in Fitzgerald, Georgia, in a ballpark with a skinned infield. One play in particular stood out. Cottier remembers a “big left-handed hitter named Thompson” smashing a one-hop line drive that hit him just above the wrist, caromed over his shoulder, and rolled all the way to the fence.

Several hours later, his ride stopped rolling. Read the rest of this entry »


MLB Announces Major Rule Changes for 2019 and 2020

I have a long history of abhorring of structural or rule changes in baseball. I wasn’t alive in 1969 to get upset, but going from two divisions to three seemed like an affront to everything that was right and decent in fifteen-year-old me. And a wild card? A team that can’t even win the division would make the playoffs? Somewhere in the WBAL-TV video archives is me in late 1994 arguing with Josh Lewin about how much I loathed the wild card. Hopefully it can’t be found.

Interleague play? Hated it. I still haven’t gotten to the point where I only mostly hate it. If I look deep into my soul, I still think of the Milwaukee Brewers as an AL East team with the best logo in baseball history and the Houston Astros as NL West stalwarts.

On Thursday, the announcement came down from Major League Baseball and the MLB Players’ Association that several of the significant rule changes proposed in recent weeks would now be implemented for the 2019 and 2020 seasons. Yet I flipped no tables over, and went on no weird Twitter rants that involved Norse gods smiting Rob Manfred under a vermilion sky (we’ll save that imagery for the CBA negotiations). I’m…happy? Apart from the decided lack of robots, that is.
First, the changes for 2019, in no particular order.

An Actual Trade Deadline, Not a Trade Deadline That Also Has This Weird Second Deadline With Secret Lists and Stuff

Baseball’s post-July 31 “bonus” deadline never really made all that much sense. It’s something we accepted because we were used to it, like how neon blue became the official color for raspberry-flavored candy for some reason. Why have a trade deadline if you’re going to have an additional one, before which some players can be traded, but only if they pass through a series of convoluted hurdles?

The August trade season was an opaque mess, full of waiver claims and revocable waivers and irrevocable waivers and pullbacks and teams trying to finagle a way to get prospects moved via players to be named later. It had largely become the “swap bad contracts” deadline and where’s the appetite for that?

The objections to removing this later deadline don’t make a lot of sense to me. I’ve heard a number of baseball and baseball-adjacent people wonder “What if you don’t know whether you’re contending or not?” or “What if something happens and you don’t have a Plan B in the minors?” Not these exact words perhaps, but you get the gist.

My answer: So? It’s good for the sport to have an element of risk in the decision-making process and it’s good for teams that plan their roster depth well to receive a benefit. One simple, straightforward trade deadline is the way to go. And really, if you need until the end of August to know if you’re a contending team or to receive the revelation that pitchers frequently become injured, you’ve got way bigger problems to worry about.

All-Star Election Day (Guest Starring: Extra Cash)

I’ll save the political parallels of election winners directly receiving cash bonuses for someone else!

All-Star voting has always been kind of weird, in that if you try to vote based on in-season performance, you end casting a ballot for an All-April team since the voting process starts very early and continues over a long period of time.

The All-Star Game has been the least interesting part of All-Star Week since interleague play started, but I do think there’s an opportunity here for baseball to create an event where they can market their top players. Hopefully upping the Home Run Derby prize to $1 million will prove a strong incentive for more top-tier sluggers to participate. Joey Gallo is already considering it.

MLB also snuck in the rule that for the All-Star Game, extra innings will start with runners on second base. Since this still won’t affect the real games, I’ll just hope this thing that nobody asked for, wants, or likes will die a quick death and just be a joke in 30 years, much like AfterMash.

Reduced Commercial Breaks

Anything that increases the baseball-to-no-baseball ratio is fine with me. The reduction from 2:05 to 2:00 in local games probably won’t be noticed, but the 2:25 to 2:00 in nationally televised games is a significant trimming. Saving a dozen views of the year’s horribly overplayed commercials in the World Series could do a lot for our collective mental well-being.

After 15 years, I still can’t completely forget the advertisement for Skin in which Ron Silver loudly reminds his daughter that her boyfriend’s father is the district attorney. If you weren’t old enough to remember the 2003 World Series, consider yourself blessed.

MLB/MLBPA Joint Committee

This isn’t really a rule change, but I’m hopeful that the MLBPA and MLB meeting years before the expiration date of the current collective bargaining agreement will result in more productive changes than we’ve gotten in recent agreements. Baseball’s revenue system is in serious need of modernization and it’s not something you can paper over by both sides agreeing to take money away from those rich, robber baron…uh…17-year-old international players. From incentivizing teams to win baseball games over subsidizing lower revenues, to gaming the service time clock, both sides have a lot of things to talk about. Rule changes aren’t likely to be quite as contentious as provisions that directly impact player compensation, but a constructive dialogue about what baseball should look like and how it should be played can only help to shape the harder conversations set to take place in 2021.

Visitation Rights Revoked

Baseball implemented a 30-second limit on mound visits before the 2016 season and capped the total number of mound visits per game without a pitching change at six before 2018. For 2019, this number has been further reduced to five visits, and while this won’t result in a significant change in total game times, it’s another moment where for the viewer, nothing is actually happening but some standing around and talking. Baseball isn’t a pub crawl, after all.

And coming in 2020…

Return of the 15-Day Injured List

The injured list (formerly the disabled list before the name change) will now return to being a 15-day list instead of a 10-day one; the minimum assignment period for pitchers sent to the minors will also increase to 15 days. The idea of the shorter injured list stint was to nudge teams into putting players with short-term injuries on the IL instead of keeping them active in the fear of having to lose them for a full two weeks, thereby risking further or worsened injury. In practice, some teams were using it as a taxi-squad, and baseball would prefer to not have to be the injury police to enforce whether or not injured list visits are due to chicanery. Unlike machinations such as openers or two-way players, exploiting rules meant to protect injured players isn’t what I consider in-game cleverness.

The LOOGYDämerung Beckons

Baseball’s rule changes frequently involve structural alterations to things like divisions and playoff spots or equipment. Changing how a player is allowed to be used on such a wide basis is a good bit rarer. There has always been some tinkering around the edges, like as the Pat Venditte rule, which is intended to keep baseball from degrading to an infinite loop as switch-pitchers and switch-hitters fight an endless battle for platoon superiority.

Going from a minimum of one batter faced to three, or until the half-inning concludes, is a significant change, and one I feel has been a long time coming, simply due to the nature of pitching vs. hitting in terms of how baseball itself is designed.

A left-handed pitcher can be rostered just for an ability to get out left-handed hitters as that’s all they have to do, but carrying a left-handed pinch-hitter to do nothing but hit righty relievers is much more difficult. There were always a lot more Randy Choates than Dave Clarks.

As players became more specialized, bullpens ballooned, and benches withered away. Knowing that a pitcher may have to pitch to three batters, or until the inning concludes, brings a bit of balance back to the issue as I see it. It makes the batting order more tactically relevant and instead of bringing in the lefty to face the lefty almost by reflex, managers will have to assess the risk-reward of bringing in that pitcher without the option to remove him easily.

One important thing to note is that people also greatly overestimate just how many one-batter stints there are in baseball.

Top 25 Seasons for One-Batter Stints
Year One-Batter Appearances
2015 1410
2012 1335
2014 1272
2011 1230
2016 1188
2007 1175
2010 1170
2013 1168
2018 1159
2006 1131
2009 1130
2017 1125
2008 1085
2005 1051
2001 1041
2004 1035
2003 1005
2002 1000
1999 991
1998 987
2000 978
1997 945
1993 920
1996 882
1995 856

Even in the season with the most one-batter appearances, 2015, teams still averaged only about eight a month. It’s too soon to be certain about the trend, but based on 2017 and 2018 at least, this type of usage may have hit its peak in 2011-2015.

I’m only half-joking when I say Bruce Bochy’s retirement would have reduced this number on its own. Three of the top four seasons in one-batter reliever usage in baseball history were Bochy-managed teams — the 2012, 2015, and 2016 Giants. There were 112 one-batter relief stints on the Giants in 2012 alone; only 15 other teams ever topped 70.

The players did not embrace this rule change, but agreed not to fight this particular adjustment. I suspect when we look back on this in 10 years, we’ll be surprised by how extreme people thought the change was at the time.

The 26/28 Man Roster

The size of standard active rosters will expand to 26. This strikes me as an eminently fair attempt to reverse the disappearance of benches. A team can still carry 13 pitchers (or whatever number is selected in the final rule) if it chooses to do so, but now American League teams will have at least a reasonably sized bench. My hope is that limits on resources cause innovation in both the bullpens and benches. If we see a wider variety of bullpen roles when combined with the three-batter rule and a comeback of situational hitters, I think this is a win.

Naturally, with a limit on pitchers, there needs to be a bright line to separate actual two-way players like Shohei Ohtani and Matt Davidson. Players will now have to be designated as either a pitcher or a position player in advance, and two-way players will have to meet certain criteria. The limit initially chosen of 20 innings pitched and 20 games of at least three plate appearances strikes me as a bit too steep. I have serious doubts that teams would try to “fake” a pitcher by allowing a .400ish OPS hitter to start ten games a year. For 2020 Ohtani, he’ll already have the required number of plate appearances from 2019 to qualify as a two-way player, but absent an injury exemption, until he gets the 20 innings thrown, he’ll have to be considered a pitcher, meaning he will take up one of the team’s pitcher slots for that period of time. After those 20 innings, he wouldn’t count against the team’s pitcher cap and could be reclassified.

Along with the three-batter rule, the pitcher limitation also seeks to improve the aesthetics of the game. I’ve long argued that baseball’s problem isn’t games that are long so much as it is games that are long and nothing is happening. A parade of constant reliever changes grinds things to a halt.

Where I’m not-so-excited is the effect on September rosters. I like seeing teams out of contention call up some of their minor leaguers to the 40-man roster. With 28 players on the roster, teams save on MLB salaries. If you think of some of that money going to the 26th-man during most of the season, it will likely function in many cases as a subsidy to older players from younger players. And this is sadly a theme of some changes the MLBPA and MLB have happily agreed to over the last decade.

Nolan Arenado Talks Hitting

Nolan Arenado is one of the best hitters in the game. The 27-year-old third baseman has won four consecutive Silver Slugger awards, averaging a a 127 wRC+, 40 doubles, and 40 home runs over that stretch. Ensconced in the heart of the Colorado Rockies batting order, he’s driven in 503 runs, the most in MLB by a comfortable margin.

Like many players, Arenado has evolved. Unlike one of his new teammates, he’s done so in a more traditional —less nerdy, if you will — manner. On Tuesday we heard from Daniel Murphy on how he transformed himself into an elite hitter. Today we hear from Arenado.

———

David Laurila: We first talked during your 2013 rookie season. How have you most changed as a hitter since that time?

Nolan Arenado: “When I’m going well, I’m good at staying on my back leg. I didn’t do that back then. I was a front-leg hitter. That’s why I wasn’t driving the ball out of the ballpark. I was good at putting bat to ball in 2013, but that’s it. I was just slapping the ball for a knock.

“I had to learn how to be quicker without jumping at the ball. I had to learn to control the middle-inside pitch, because they were beating me there. I was kind of drifting, and I was getting jammed. In 2014, I started focusing on getting the head out. Read the rest of this entry »