Last season, the Atlanta Braves platooned Brian McCann and Tyler Flowers behind the plate. Neither player was great, but the pair produced more than three wins, which put them in the top 10 for team catching totals. Atlanta had already re-upped Flowers with a one-year deal, but with McCann’s retirement, the club needed a replacement for his half of the duo. Enter Travis d’Arnaud, who agreed to a two-year deal worth $16 million, as first reported by ESPN’s Jeff Passan.
The McCann/Flowers combo worked well because the lefty McCann and the righty Flowers could platoon. That won’t be the case next year, as d’Arnaud bats right-handed as well. It should, however, provide more flexibility regarding rest and pitching matchups. Both players hit lefties well and are usable against righties, which means that manager Brian Snitker can decide who plays based on the best matchup with his own pitchers.
Flowers is one of the best framing catchers in baseball. Since 2015, his 77 runs above average are second only to Yasmani Grandal’s 100, though Flowers has 1,300 fewer innings.
But Flowers isn’t necessarily a guy you want to play 140 times. He’ll be 34 years old next year, he’s a poor thrower, and he doesn’t have much of a stick: After a hot April last year, he put up a 73 wRC+ the rest of the way. While the Braves were happy to bring Flowers back at a low salary, they needed another competent catcher to replace McCann.
d’Arnaud fills that void, and at a pretty fair price given his blend of experience and upside. On our Top 50 Free Agents list, Kiley McDaniel projected d’Arnaud would get two years and $14 million. Ben Clemens had this to say about him:
What you think of Travis d’Arnaud’s free agency is entirely a matter of perspective. Is he the player who the Mets released in May? Is he the cleanup hitter for a playoff team? Both are true, but neither paints a complete picture. It goes beyond this year, too: is he the former top prospect who compiled 6.2 WAR in roughly 700 PA in 2014 and 2015, or the injury-prone journeyman who totaled 2.4 WAR in a similar amount of time over the next three seasons, losing his job to a carousel of middling backstops in the process? Again, the truth lies somewhere between these two extremes. Put it all together, and d’Arnaud projects as a roughly average player, and average catchers entering their age 31 seasons aren’t typically in high demand. There’s still a whiff of pedigree to him, however, even after his inconsistent career thus far, and plenty of playoff hopefuls could use an average catcher, which means d’Arnaud will likely have his pick of destinations on a small-ish contract.
That d’Arnaud was able to beat the estimates is a testament to a thin catching market. Per our Free Agent Tracker, these were the top talents available this winter:
There weren’t too many full-time starters available. Jason Castro might have been a fit, given his lefty bat and decent projection, but d’Arnaud had more plate appearances last season than Castro the last two years combined. Add in the age difference between d’Arnaud and Castro, and it’s clear why the righty was a compelling option.
While Flowers’ season might have been cause for some concern with the Braves, d’Arnaud played well once he arrived in Tampa Bay. The graph below shows his 100-game rolling wRC+ over the last four seasons:
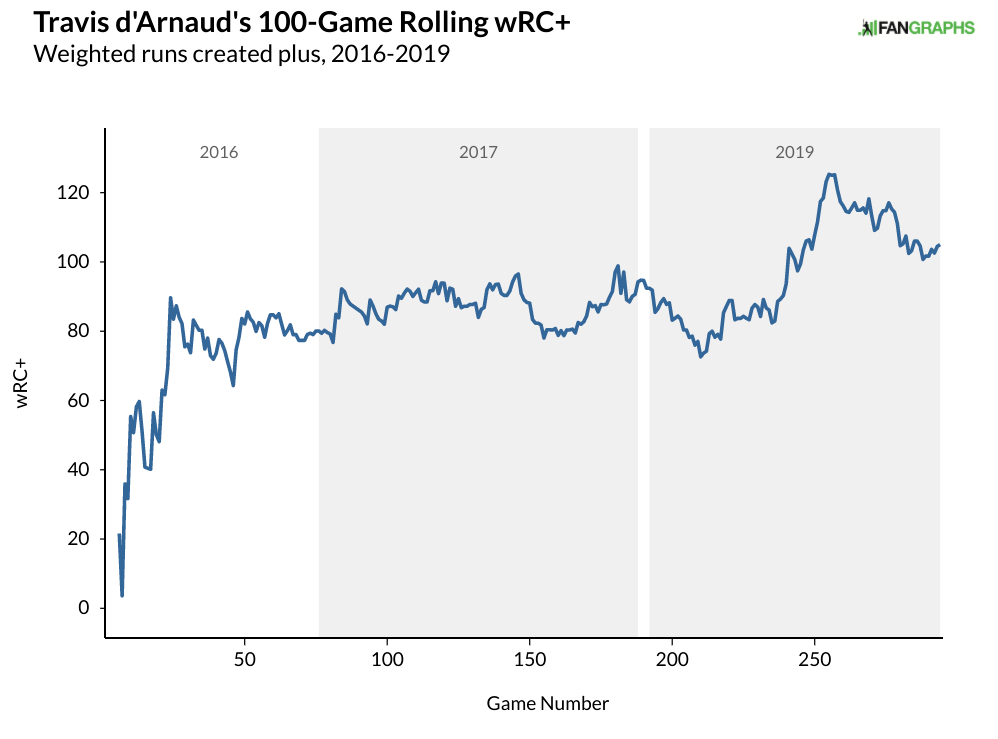
While d’Arnaud’s numbers in recent seasons don’t leap off the page, he was quite good at the plate in Tampa. Even with an underwhelming 67 wRC+ in September, d’Arnaud posted a 107 wRC+ with Tampa Bay across 92 games and 365 plate appearances, and his contact quality was even better than that. Because he didn’t make it to the Rays until the second week in May, d’Arnaud actually carried a pretty significant workload, playing roughly three-quarters of the time. With Flowers in the fold and no need to play first or designated hitter, d’Arnaud should get a bit more rest and perhaps see some improvement in his numbers.
d’Arnaud framing metrics were pretty good last year, though not as stellar as his early career figures in New York, when he was 41 runs above average. He missed nearly all the 2018 season due to Tommy John surgery, and it is difficult to tell if the decline in framing production stems from recovery, aging, or just random fluctuation. In any case, if d’Arnaud is a league average bat or his framing numbers rebound at all, this contract will be a bargain for Atlanta.
The Braves are off to a strong start this winter. They’ve solved their catching problem early on with Flowers and d’Arnaud and revamped their bullpen with the signings of Chris Martin and Will Smith.
They shouldn’t stop there. The team has yet to replace Josh Donaldson or his production at third base, they still need a starting outfielder and to push Nick Markakis to a part-time role. The Braves also need to augment their rotation. While Mike Soroka, Mike Foltynewicz, and Max Fried are decent options and Sean Newcomb, Bryse Wilson, Kyle Wright, and Touki Touissant provide depth, the club needs to replace the quality innings thrown by Dallas Keuchel and Julio Teherán. The Braves have decisively patched up the small holes on their squad: Now they must address the bigger issues.


 Jay Jaffe