Editor’s Note: As we approach the January 22 Hall of Fame announcement, we’ll be featuring a few pieces from Anthony Calamis and Adam Dore, members of Ryan Thibodaux’s excellent team that tracks public Hall of Fame ballot. This is the second such piece. Be sure to check out the ballot tracker, which is an indispensable tool for any Hall of Fame enthusiast.
To get the obvious point out of the way, the Cooperstown stage is going to be crowded at this year’s Baseball Hall of Fame induction ceremony on July 21. All signs point to the trio of Mariano Rivera, Roy Halladay, and Edgar Martinez earning induction and joining Lee Smith and Harold Baines — both of whom were elected to the Hall of Fame by the Today’s Game Committee this past December — in the 2019 Hall of Fame class. It is also possible that Mike Mussina will join them as well.
This year’s class will, in all likelihood, have the unique distinction of being the first class ever comprised of two or more first-ballot selections (Rivera and Halladay) to go along with one candidate (Martinez) who received at least 75% of the vote in his final year of eligibility. On two previous occasions, the BBWAA selected one first-timer and one other inductee whose eligibility window was set to expire: the 2017 induction class featured Ivan Rodriguez (first year on ballot, 76.0%) and Tim Raines (10th year, 86.0%), while the Class of 2009 consisted of Rickey Henderson (first year, 94.8%) and Jim Rice (15th year, 76.4%).
As of Tuesday morning, we have published 177 ballots in our Hall of Fame Ballot Tracker, and it is clear that Fred McGriff and Larry Walker have gained the most ground of any of the returning candidates since the last voting cycle. McGriff has picked up 34 votes so far from writers who did not include him on their ballots last year – against just two drops – while Walker has seen a net gain of 37 new votes as of this writing. McGriff is in his 10th and final year of BBWAA eligibility and will not get the call from Cooperstown next week. Walker, in his penultimate year on the ballot, had a case that appeared dead in the water, garnering just 21.9% of the vote in 2017, his seventh year on the ballot. Heck, his candidacy was probably written off by almost everyone, even with a 12.1% jump in 2018.
Net Gained Vote Leaderboard, 2009-Present
*Final Chance on Ballot
Elected by BBWAA
SOURCE: Ryan Thibodaux
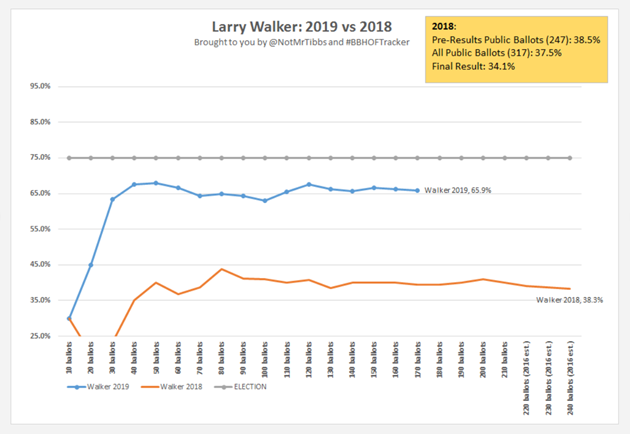
Just how far can Walker’s surge take him? Well, his current showing of 66.7% through 177 public and anonymous ballots is sure to falter, as ballots revealed early have historically been more favorable toward the vast majority of candidates than those revealed later or kept private. In order to determine the likelihood of the Canadian former slugger finishing with a portion of the vote high enough to set him up for a real possibility of 2020 enshrinement, I investigated how Walker fared on ballots of varying sizes last year.
Since 2017, I have kept a public spreadsheet detailing the trends in Hall of Fame ballots of varying vote quantities, and how each candidate fares when ballots are broken into five different size groups. The 10-player and 9-player ballots are categorized individually, while 7-8 vote and 5-6 vote ballots make up two separate groups; the remaining ballots, which consist of four or fewer votes, make up the fifth and final category. This sheet, made possible by Ryan Thibodaux’s work, breaks down each of the five size classifications into two additional groups: ballots including both Barry Bonds and Roger Clemens, and ballots that exclude one or both members of that duo.
For the sake of reducing space below, I’ve lumped ballot sizes into two basic groups: 10-player ballots and ballots which have fewer than the maximum 10 names checked.
On ballots with all 10 slots filled:
Ballots With All 10 Slots Filled
And ballots on which fewer than 10 names are checked:
Ballots With Fewer Than 10 Slots Filled
Four candidates have experienced an increase of at least 10% on 10-player ballots revealed prior to the announcement, with Omar Vizquel just off the pace. Walker is securely out in front of the pack, with a whopping 30% increase on such ballots from last year. Bear in mind that half of the 422 ballots cast in 2018 had awarded votes to 10 players. That Walker has appeared on over 80% of full ballots after receiving votes on just over half of them in 2018 is astounding. Having four names cleared from the ballot certainly opened up more opportunities for electors to cast a vote for Walker, as they may have done last year had the BBWAA allowed unlimited votes.
The even more jaw-dropping statistic is this: Walker’s vote share on sub-10 ballots has more than doubled since last cycle, up to 45.1%. Yes, that’s right. He appeared on just 19.4% of ballots that left at least one open spot last year, but has since seen that number skyrocket faster than the number of likes on a funny cat video gone viral. Walker has also gone 6-for-29 thus far on “Small Hall” ballots of six names or fewer. That might not sound like much, but that 20.7% is nearly identical to the 20.8% of all public sub-10 ballots that included his name. (For what it’s worth, Walker appeared on only two of the 44 publicized ballots that consisted of fewer than seven names last election cycle.)
What does all this mean for this year’s results? Consider the following: through the first 177 publicly revealed 2018 ballots, 53.8% of the 104 writers who checked 10 names cast a vote for Walker. That figure dropped down to 51.4% among all 317 public or anonymous ballots – including 173 full ballots – accounting for a rate decrease of 4.5% from the original vote share (I’m referring to the rate of change, which is different than simply the 2.4% decrease in percentage). Conversely, Walker only appeared on 16.9% of the 71 ballots that consisted of fewer than 10 names at the 177-vote mark, but that mark rose to 20.8% once all public ballots – 144 of which had fewer than the maximum number of slots filled – were uncovered. The rate of increase here was about +23%.
Let us make a few conservative assumptions:
1) The total number of ballots revealed in 2019 will be somewhere in the neighborhood of the 317 made public last year. Let’s say +/- 10 from that mark.
2) The previous year’s four-man induction class will lower the average number of candidates strongly considered by the voters, resulting in 10% fewer ballots with votes for 10 players. This would give a 45:55 ratio of full ballots against those selecting nine or fewer candidates.
3) Walker’s strong showing on full ballots thus far is inflated by early-exit-poll bias, and he will finish with a vote share that is just 90% of what it is currently on such ballots. Such a rate of decrease will get him 74.2% of the vote on public 2019 10-player ballots, just shy of election.
4) The 45.1% share Walker currently holds on smaller ballots will drop slightly by a net -2.0% (for an overall 43.1% vote share) despite increasing by 20% from this point last year and an overall change of +3.6%.
5) Points 2-4 factor in estimates for the portion of the voting body who chooses to keep their votes private.
Factoring in all of these assumptions, Walker would reel in a vote total of approximately 57.1%, which would represent a colossal increase of +23.0% in a single election cycle.
Last week, FanGraphs’ own Jay Jaffe explored the largest single-year gains in BBWAA voting history. In the event Walker does finish at exactly the aforementioned 57.1% figure, he would require an 18.0% increase in his final year of eligibility. Sounds steep, right? Perhaps, but gaining 18% in one year is far from unprecedented, and it would rank as just the 15th largest increase ever — tied with Ralph Kiner’s jump from 24.5% to 42.5% in 1967. It should be noted that a much more recent candidate, Vladimir Guerrero, jumped 21.2 percentage points, from 71.7% to 92.9%, in 2018.
Source: Ryan Thibodaux
Remember, I’m calling 57.1% of the vote for Walker a rather conservative estimate. There is certainly a chance he could come much closer or even exceed a three-fifths majority of the vote. In fact, the most recent model of Jason Sardell pegged 57% as the median estimate.
It certainly appears that we will have some drama on our hands in 10 months’ time when Walker hits the BBWAA ballot for the final time. A weaker ballot and the recent surges in vote totals for players late in their eligibility is sure to provide some additional excitement to the ballot tracking process next year. I would expect that every Walker fan will have run out of fingernails to bite come announcement day in 2020.
Even if Walker doesn’t get elected next year, he and fellow 2019 ballot-mate Fred McGriff might ultimately have a rather smooth road ahead of them. In the last two Eras Committee elections, we have seen three candidates who had gathered solid support during their tenure on the BBWAA ballot sail into Cooperstown upon their first introduction to one of these committees.
2018: Jack Morris, 14 of 16 votes, Modern Baseball
2018: Alan Trammell, 13 of 16 votes, Modern Baseball
2019: Lee Smith, 16 of 16 votes, Today’s Game
Each of these three former players received at least 40% of the BBWAA vote in at least one appearance on the ballot. Historically, many players who have received a relatively high vote share eventually made it to Cooperstown through some ideation of the committee structure. There are only 13 players – excluding those currently on the ballot – in Hall of Fame history who have accrued at least 30% of the overall Hall of Fame vote from the BBWAA who have not since been inducted to the Hall.
At least 30% of BBWAA Vote, Not In HOF
SOURCE: Baseball-Reference
(Disclaimer: Yr on Ballot refers to how many appearances on the ballot the candidate had made at the time his highest vote percentage was received. The BBWAA voting process has evolved greatly from a time when elections were biennial and the 5% minimum threshold did not exist. Some players appeared on the ballot more than 15 times while others were cast off prior to reaching 15 appearances. The * denotes players who appeared on the ballot before several more recent rule changes were instituted. For more on the evolution of Hall of Fame voting, see Jay Jaffe’s The Cooperstown Casebook.)
Note that only six of these players have ever even reached 40.0% of the vote, and just 4 of the 13 exited the ballot with a vote share above 35%. With McGriff currently tracking at 36.2% through 177 ballots, is it likely that he joins this group, considering that he has been favored by private voters more so than public voters each year since the massive purge of the voting body prior to the 2016 election. It is conceivable that the Crime Dog crosses 40.0% of the vote this year, and probable that he – like Morris, Trammell, and Smith – is easily elected by the next Today’s Game Committee, which will meet in December of 2021 to determine which candidates should receive a bronze plaque the following July.
I will touch only briefly on Mussina here, as fellow member of the Tracker team Anthony Calamis thoroughly explored Mussina’s chances for FanGraphs recently. Mussina ranks fourth – behind the three near surefire inductees – in votes on full ballots, missing only seven out of 102 tallied thus far. Along with the three most likely inductees and Curt Schilling, Moose has also gotten the nod on more than 75% of 9-player ballots as well as the 7-or-8-vote group. He is the only candidate besides Rivera – who remains unanimous – to appear on all 19 of the 9-player ballots to date.
At first glance, it would appear as though Mussina’s luck runs out once we get to the true “Small Hall” ballots, which I will label as those containing six votes or fewer – he is just 9-for-30 on those. If we eliminate the “Tiny Hall” 0-4 player ballot category — votes on these ballots are most likely to be awarded to the candidates with the highest vote shares (there is only one public ballot that has named exactly four players) — on which ballots Mussina has been shut out, his vote total share is 39.1% (9 of 23) on remaining Small Hall ballots.
As Calamis mentioned, the average number of votes per ballot is sure to drop precipitously among private voters, who notoriously are far less likely to cast a vote for Bonds and Clemens. In my estimation, a large number of private ballots will fit into the Small Hall demographic. I also believe that the current breakdown of 5-or-6-player ballots – 11 including both Bonds and Clemens (on which Mussina has failed to earn a vote), 12 excluding them – will begin to shift greatly towards the latter as more votes are made public; my guess is that trend will also hold true among private voters. If this is true, Mussina has a chance to remain close to the 75% mark (9 of 12) he holds on such ballots because, as Calamis indicates, he was the second-ranked ballot holdover behind Martinez in terms of 2018 vote percentage. It remains to be seen whether the man known as Moose will have enough gas in the tank to cross the proverbial finish line this year, or if he will have to wait it out until 2020.
Several other players will be covered in greater detail in a subsequent piece next week, but for now I will leave you with a brief overview of some other interesting trends gathered from my Ballots by Quantity sheet.
Scott Rolen, who ranks 12th on the Tracker in overall vote percentage, has gathered votes on 33 of the first 102 full ballots – not a bad showing for a second-year candidate who barely eclipsed 10% of the overall vote when all was said and done last year. However, Rolen has the rather puzzling distinction of being a paltry 4-for-75 on any other ballots, a mark which only bests Andruw Jones’ among candidates likely to remain on the ballot in 2020. Similarly, Rolen was polling at just 3.9% on less-than-10 ballots on all 2018 pre-announcement ballots.
I was rather stunned to see the remarkable consistency of first-timer Todd Helton’s vote distribution. Excluding the stingiest group of Tiny Hall ballots from the mix, Helton’s vote percentage has ranged from a lower bound of 17.4% to an upper bound of 23.1% in each of the remaining four size categories through the first 177 revealed ballots. Naturally, he has benefited substantially more from ballots of the anti-Bonds and Clemens variety.
For a candidate who received just an 11.1% vote share in 2018, eight new supporters for Billy Wagner so far is a step in the right direction (he was also dropped from one ballot, but that ballot included 10 names and Wagner is almost certainly going to earn that vote back in the coming years). Closers historically have received a small boost among the un-published ballots, so the possibility exists that Billy The Kid’s final percentage can be a few ticks higher than where it stands currently. I have long believed that 2020 would be the year that things could really begin to take off for Wagner. He will finally be able to stand alone as the top relief pitcher on the ballot and out of the shadows of Smith, Trevor Hoffman, and Rivera. Wagner will also – at least in the opinion of this observer – have the distinction of being the greatest reliever outside of Cooperstown, period.
If Walker can total 15.5% in his sixth year of eligibility and we are – just three years later – discussing how he might actually have a chance at 75% in his final year, perhaps hope is on the horizon for Wagner, set to reach the 15.5% threshold two years earlier. Only time will tell.