A lot has happened in the past week. When times were simpler, back when the Phillies signed David Robertson three lifetimes and somehow only two weeks ago, I raised the possibility that we might bring back the We Tried tracker for the trade deadline. It wasn’t a sure thing, because the trade deadline isn’t really the time for We Trieds. They tend to happen over the offseason, when news is slow and multiple teams are bidding on free agents – which is why Robertson had so many reported suitors – rather than when teams are trying to swing trades. Loose lips can sink the many relationships involved in trades, and in the aftermath of the draft and deadline, everyone’s too busy to reach out to a reporter with an unattributed attempt to assure fans they made an effort. At least that’s how it normally works. This deadline featured a record-setting number of trades, and a surprising number of We Trieds to go along with all the actual action.
I’m sure I didn’t catch every We Tried, mostly because I spent the entirety of the deadline with my head down writing up transactions, listening to intense film scores in order to push me to write faster. I didn’t have much time to comb headlines and social media, but I did have help from some friends. I offer special thanks to readers JD, Elizabeth, Joel, and Fox Mulder Bat Flip for sending We Trieds my way. If you’re aware of any that I missed, as always, you can let me know on Bluesky or by email at WeTriedTracker@gmail.com. Read the rest of this entry »
Ranked and briefly analyzed below are the prospects who have been traded during the loosely defined “2025 deadline season,” which for simplicity’s sake I consider all of July. Most of the deals these prospects were a part of have been analyzed at length on this site. An index of those pieces can be found here; you can also click the hyperlink in the “Trade” column below, which will take you to the relevant article. I’ve moved all of the 35+ FV and above players listed here to their new orgs over on The Board, so you can click through to see where they rank among their new teammates and read their full scouting reports, which have been updated where applicable. The Farm System Rankings, which update live, also reflect these changes, so you can see where teams’ systems stack up following the draft and the deadline. Read the rest of this entry »
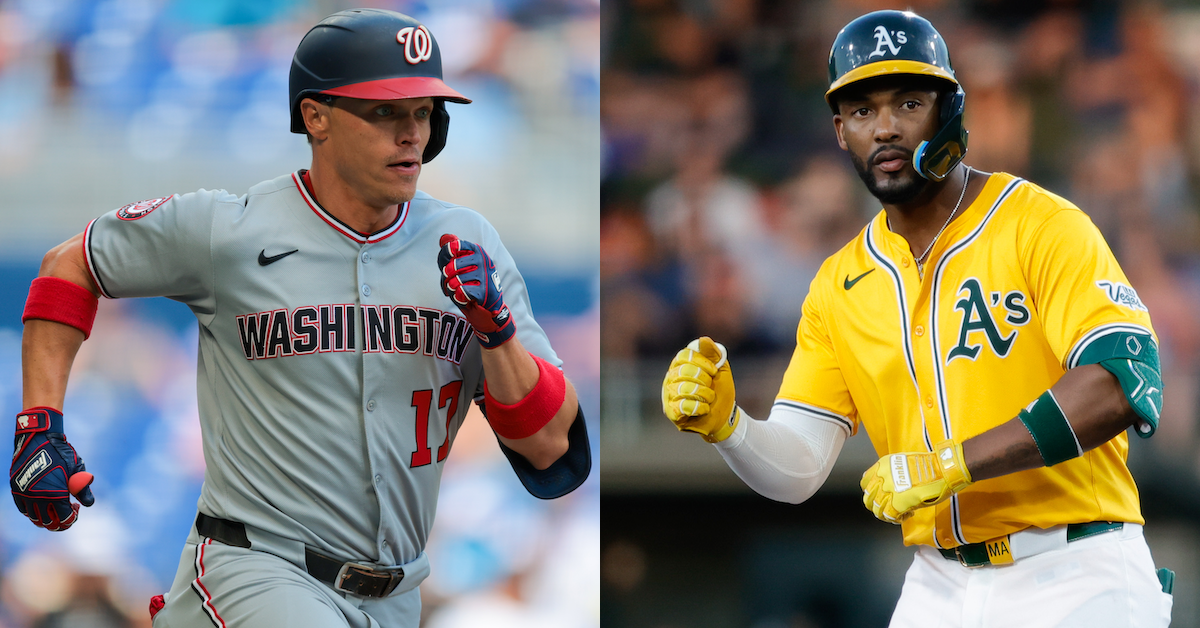
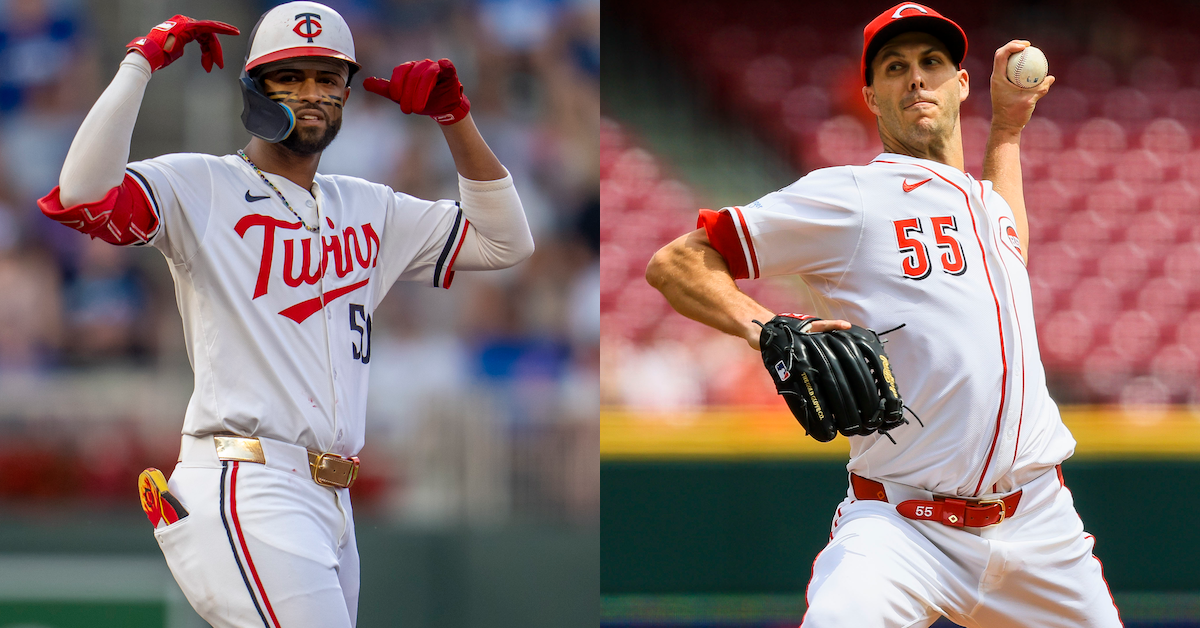
Well, here it is, folks. This is our final transaction analysis piece of the 2025 trade deadline, and we’re covering two outfielders who will now be in position to help playoff contenders. On Thursday, the Dodgers acquired outfielder Alex Call from the Nationals in exchange for pitching prospects Eriq Swan and Sean Paul Liñan. And the Reds traded with the A’s for veteran Miguel Andujar, sending back pitching prospect Kenya Huggins, so under no circumstances can we accuse Cincinnati of prospect hugging.
To the continued and possiblyeternalchagrin of Baseball Prospectus editor-in-chief Craig Goldstein, Call will not be simply taking over Michael Conforto’s spot in left field. Earlier on Thursday, the Dodgers traded the lefty-hitting James Outman to the Twins in exchange for reliever Brock Stewart, leaving a space for the right-handed Call as a fourth outfielder and likely platoon partner for Conforto. If you put the two trades together to compare apples to apples, you get Call for Outman (and Stewart for two prospects). Call is three years older than Outman, with roughly the same amount of service time. He’s hitting much better than Outman right now and allows the Dodgers to get another right-handed bat in the lineup, but he offers a bit less upside in the future.
Call is 30 years old, and he has a career 102 wRC+ in 920 plate appearances. He’s been significantly better this season, running a 118 wRC+. He doesn’t have wild platoon splits either. This season, he has a 124 wRC+ against lefties and a 115 wRC+ against righties. Over his career, those numbers are 110 against lefties and 97 against righties. Conforto has much better career numbers against righties, but this season, he only has a wRC+ of 85 against them. It wouldn’t be unreasonable at all to just plug Call in as the starting left fielder and call it a day, and it would make Craig so happy.
Call has a reputation for speed and defense, but it’s worth at least noting that his sprint speed has declined some this season, and his defense has graded out closer to average so far. It’s possible that he’ll get some of that speed back, as he’s less than a year out from a tear in the plantar fascia of his left foot. Regardless, he should be able to hold down all three outfield positions when called upon. With James Wood, Dylan Crews, and more recently, call-up Daylen Lile in the outfield, Call no longer looked like a part of Washington’s future. On the other side, the Dodgers have made a decent upgrade to an outfield that has come up just a bit short all season.
Swan is a 23-year-old right-handed starter, and at 6-foot-6 with a fastball that hits 100 mph and iffy control, he certainly looks like a Washington Nationals prospect. He didn’t put up good numbers in college, and he hasn’t put up good numbers in the minors due to wild walk totals, but did you hear me say that he was 6’6” and can throw a hundo? Swan’s 4.43 ERA and 4.34 FIP this season mark big improvements from 2024, but he’s still a big development project. Eric Longenhagen ranked him 13th in the Dodgers system with a 45 future value back in April, but he now downgraded Swan to a 40+ because he looks more likely to end up as a reliever.
That said, Swan could be a pretty good reliever. Right now, Eric has a 70-grade on Swan’s slider. He can hit the zone with it, and its whiff rate is approaching 50%. The fastball is sitting 96, but it’s playing down and he isn’t throwing strikes with it. It might end up as a pitch that’s only good for trying to attract whiffs above the zone. But that’s as a starter. If Swan ends up as a max-effort reliever, a plus-plus slider and a high-90s fastball could work just fine.
The Venezuelan-born Liñan is 20 years old, and you won’t read anything about him that doesn’t start and end with his changeup. Eric put a 55 present value on the pitch back in April, when he ranked Liñan 30th in the Dodgers system with a 40 FV. Liñan has moved around the minors a bit this season, beginning in Low-A, making two spot starts in Triple-A, then going down to High-A. He got shelled in one of those Triple-A starts, but even so, he’s got an overall ERA of 2.78 and FIP of 3.29 in 18 appearances and 14 starts across those three levels. He’s walking more than 10% of the batters he’s facing, but he’s also striking out nearly a third of them. It’s worth noting the environment, too, because they make Linan’s ERA- of 61 and FIP- of 74 look even better. Jeffrey Paternostro of Baseball Prospectus wrote a very fun article about how to evaluate Liñan back in May, and I strongly recommend it. For now the question is how Liñan will develop and whether he can come up with anything else to complement his changeup. Eric wrote up a new blurb for him today, so I’ll give it to you verbatim:
Liñan had a dominant start to his 2025 season and was promoted out of Low-A Rancho after just a half dozen starts. He made two emergency starts at Triple-A before heading to High-A Great Lakes, where he had been good (but no longer dominant) in 10 outings prior to the Alex Call trade. Liñan’s best pitch is his tail-action changeup, which moves enough to have overwhelmed A-ball hitters so far. He beats a lot of hitters with his fastball for a guy sitting 91-92, but Liñan’s command may not be fine enough for that to be true against big league hitters. Strike-throwers with great changeups like this tend to pan out in the fifth starter range, at least, and if Liñan can exceed this projection it’ll be because he’s either sharpened his fastball command to thrive with 40 velocity, or he’s found a much better breaking ball than the cutter he’s throwing now.
This seems like a pretty good haul for Call. He’s a good player, but he fits better in the Dodgers’ current plans than he does in the Nationals’ future plans. Swan and Liñan are genuinely intriguing prospects who could contribute in the majors, but they’ve both got a lot of developing to do.
Now let’s get to the other deal. After trading with the Pirates for third baseman Ke’Bryan Hayes and getting starter Zack Littell from the Rays, the Reds kept on adding, sending Huggins to the A’s in exchange for Andujar. Ari Alexander of KPRC2 first reported the deal. Andujar is a nine-year veteran, but he’s finally on the brink of free agency and is performing, which meant that at the deadline, the A’s could turn him into a pitching prospect, the highest level of reincarnation a being can attain according to the religion practiced by the baseball team in Sacramento.
Andujar is no one’s idea of a star, but he’s crushing left-handed pitching, and for a Reds team with a 79 wRC+ against lefties, sixth worst in baseball, he must look like a piña colada in the desert. Andujar put up a 129 wRC+ and 3.9 WAR with the Yankees as a 23-year-old rookie in 2018, finishing second in the Rookie of the Year voting behind some guy named Shohei Ohtani. In the seven years since, injuries and inconsistency have limited Andujar to fewer than two seasons’ worth of games, and he’s put up -0.4 WAR with a combined 86 wRC+. That said, Andujar has looked better recently. He’s running a 107 wRC+ in 2025 and a combined 105 wRC+ over the last three years. Andujar is batting .422 with a 186 wRC+ in 48 plate appearances against lefties this season. Those numbers will play in any lineup.
This season, Andujar has split his time between third base and left field. The Reds have gotten just 0.4 WAR from the third base position and 1.9 WAR from the three outfield positions, both of which rank 26th among all teams. With Hayes joining the club, Andujar won’t see too much time at third, but he can combine with Noelvi Marte, who has now been moved from third base to the outfield, to platoon with lefty batters Gavin Lux and Jake Fraley. Connor Joe or Will Benson will need to be sent down once TJ Friedl returns from the paternity list. It’s a lot of moving parts for a small upgrade, but it is an upgrade nonetheless.
The Reds drafted Huggins, a Louisiana Tech commit, out of junior college in 2022, and Eric ranked him 26th among the organization’s prospects this May, with a 40 FV. However, Eric now has a 40+ grade on him, because after recovering from Tommy John surgery that torpedoed most of his 2023 and 2024 seasons, Huggins looks more like a starter. His changeup improved in a major way, giving him a third pitch, but there’s more behind it. “This guy’s conditioning totally changed during his TJ rehab,” Eric said. “He’s not as big as Sean Manaea, but he’s built like young Manaea, just an absolute unit. The better conditioning might be why his delivery is more under control now and he’s throwing strikes.”
Huggins is 22, and after the injury, he’s in his third attempt at Low-A with fewer than 40 professional appearances under his belt. There’s still reliever risk here. However, he has a 3.69 ERA and 3.64 FIP through just over 63 innings so far this season in Low-A Daytona, which gives him an ERA- and FIP- of 87. “He’s a little behind the developmental curve and still at Low-A,” Eric said, “but Huggins hasn’t been shy about mixing in all of his pitches; he’s throwing his sinking changeup (which might end up being his best pitch) to righties, and he can land a backdoor slider for strikes reliably. He has a lot of No. 4/5 starter ingredients now.”
This is a minor deal, but it’s easy to see the appeal on either side. Andujar’s skill set is somewhat limited, but it fits in Cincinnati and he comes at a reasonable price. The injuries make it hard to know how much Huggins will be able to offer, but there’s certainly enough to dream on.
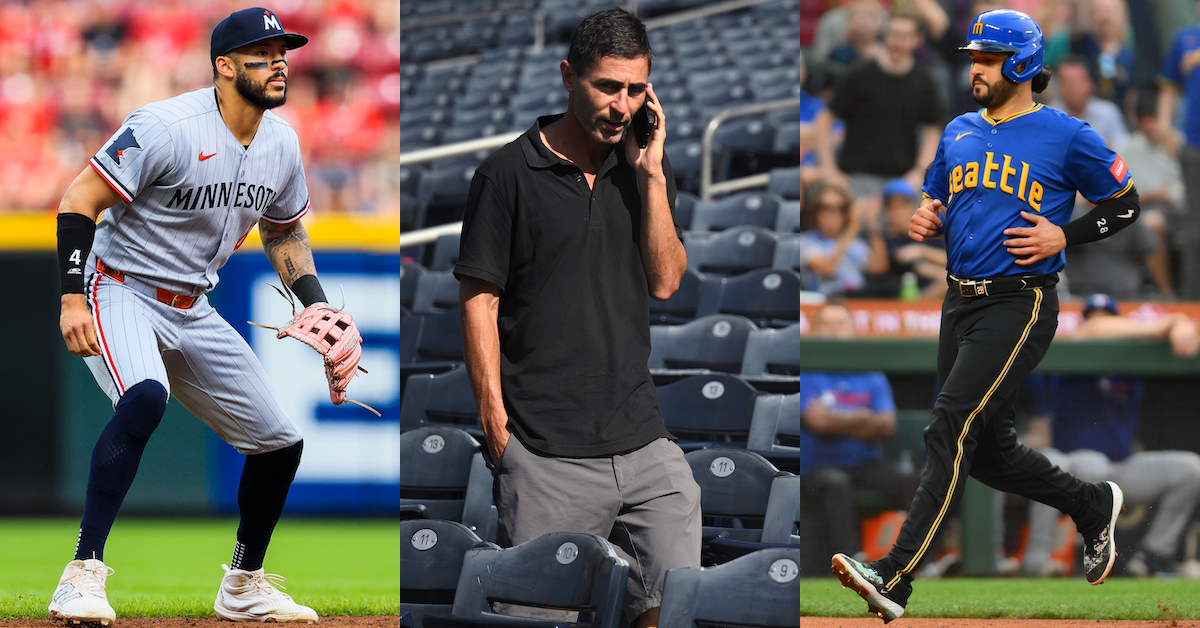
Katie Stratman, Orlando Ramirez, Steven Bisig-Imagn Images
Now that the deadline dust has settled – or at least, started to settle – it’s time to start making sense of it. The Padres, Twins, and Orioles were everywhere. Top relievers flew off the board. Both New York teams spent all day adding. But who did well? Who did poorly? Who was so frenetic that they probably belong in both categories more than once? I tried to sort things out a little bit. This isn’t an exhaustive list. There were 36 trades on deadline day, a new record, and more than a dozen before it. Nearly every team changed its trajectory at least a little, and this is just a brief look into the chaos. Here are the trends that most stood out to me.
Winner: Teams Trading Top Pitchers
This year’s crop of rental players was lighter than usual, but deadline activity didn’t slow. Instead, it simply spilled over into relievers under contract for a while. Mason Miller, Jhoan Duran, Griffin Jax, and David Bednar are under contract for a combined nine more years after 2025. That drove the prospect priceup onallfour. Having long-term control of relievers might be less valuable than at other positions, but it’s still valuable.
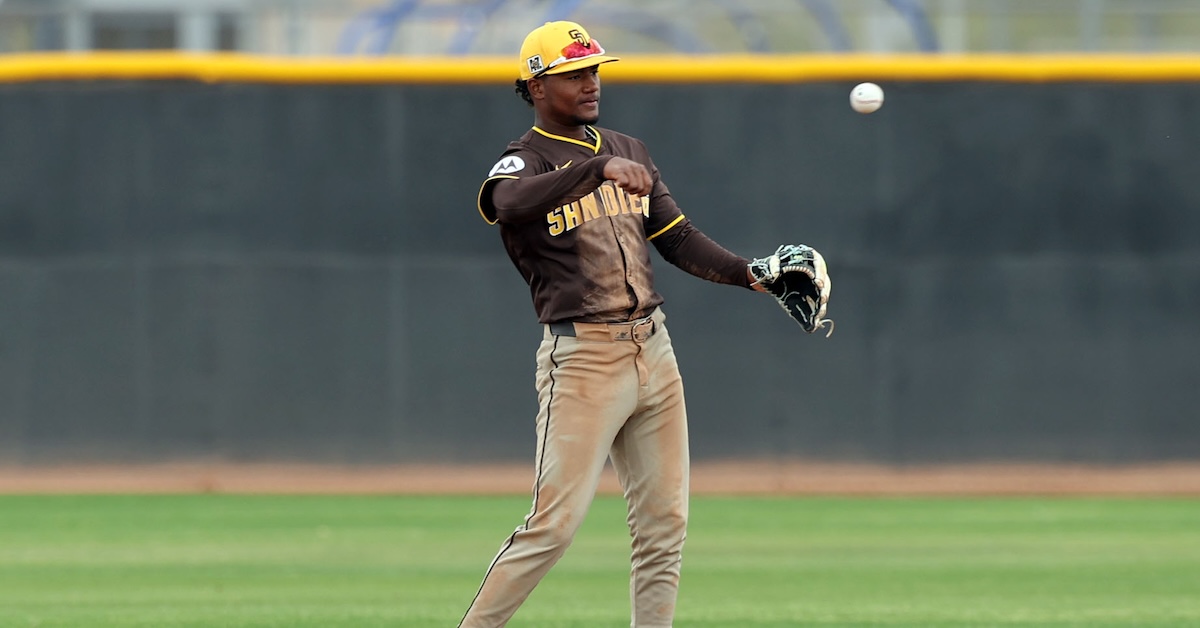
Most of the best prospects who swapped teams at the deadline were involved in a trade for top pitching. Leo De Vries, the consensus best player of the 2024 international signing period, was the big name here, but both the Phillies and Yankees offered up multiple good minor leaguers in exchange for Duran and Bednar. Taj Bradley, whom the Twins got back for Jax, is a former top prospect who won’t be a free agent until 2030. Read the rest of this entry »
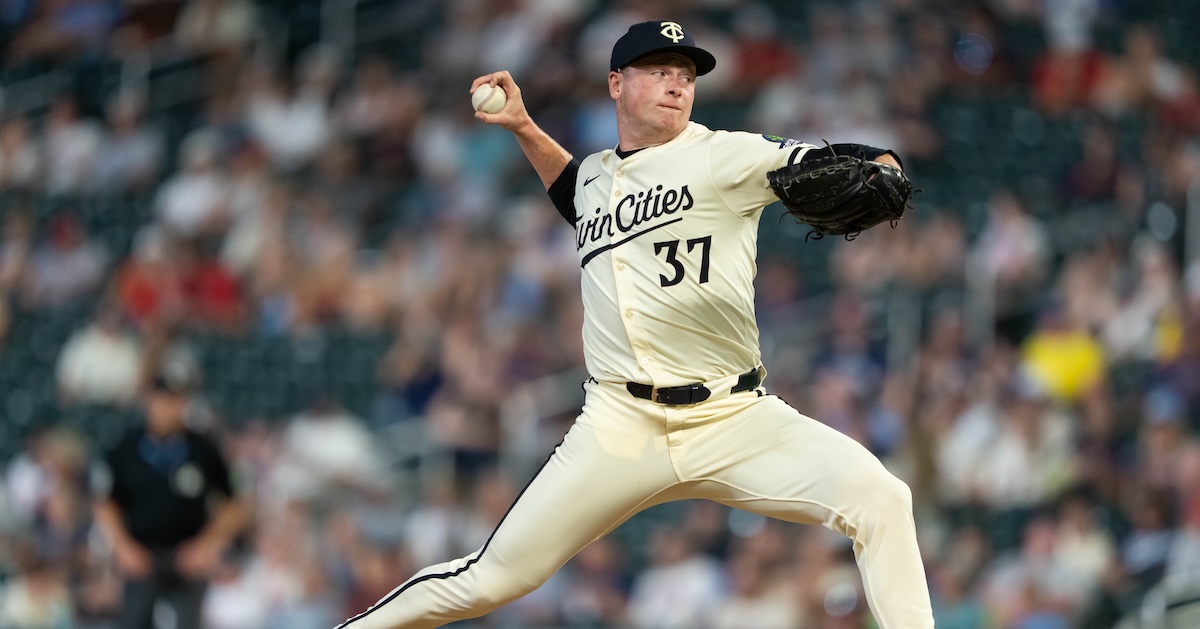
For Twins fans, the Louis Varland deal was something like the final straw. Parting with Willi Castro could be forgiven — his contract was up at the end of this season. Jhoan Duran and Griffin Jax — okay, they were under team control through 2027, but you could convince yourself that the deadline is the best time to part with a premium reliever, and look at the return. Dumping Carlos Correa and the majority of his contract on the Astros was definitely a feel-bad move, but it was also one that was requested by Correa himself after the Twins made clear that they were headed into a rebuilding phase, and the back half of that deal might look pretty bad from a production standpoint.
But giving up on Varland defied any reasonable explanation. He grew up in Minnesota, played his college ball there, and was brought into the Twins organization as a 15th rounder in the 2019 draft. From these humble hometown beginnings, he developed into a fire-breathing bullpen monster. Varland sits 98 mph on his four-seam fastball; he’s under team control until 2030, and wouldn’t even hit arbitration until 2027. If there was ever a perfect closer to bridge from one competitive Twins era to the next, it would’ve been Varland.
Instead, the front office sent him (along with Ty France) off to Toronto in exchange for outfielder Alan Roden and left-handed pitcher Kendry Rojas. On the merits, it’s a reasonable return; Roden can really rake, and Garcia is a legitimate pitching prospect close to the big leagues. Read the rest of this entry »
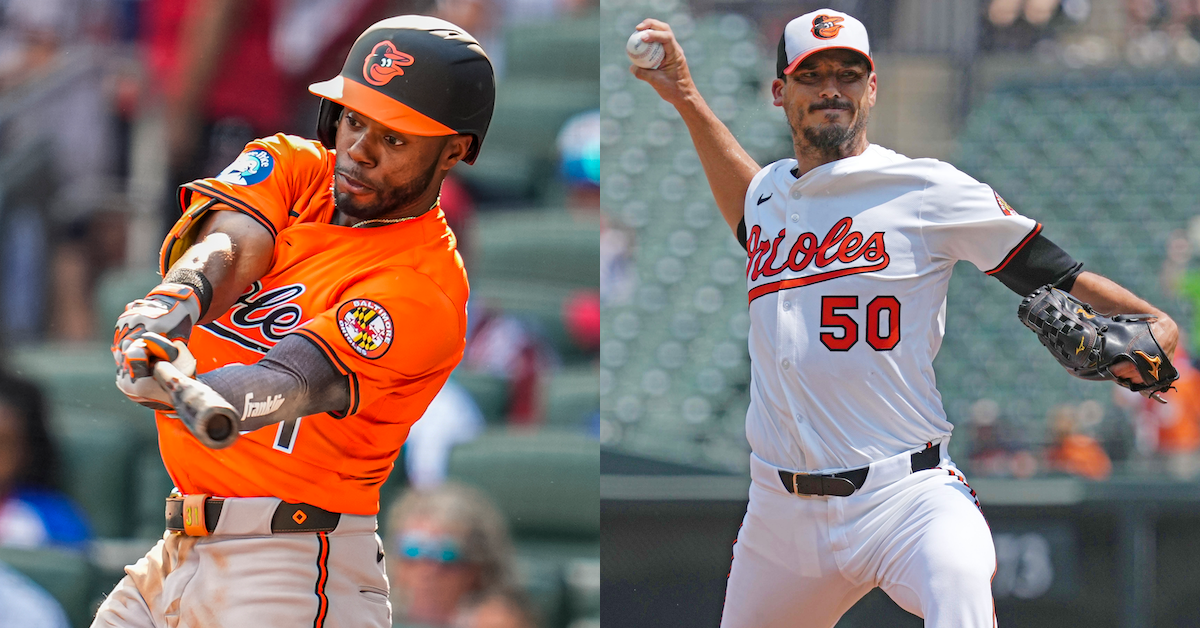
Though many predicted heading into the 2025 season that the Orioles’ weak starting rotation and general inactivity over the offseason would come back to haunt them, even Baltimore’s biggest skeptics weren’t prognosticating that the team would sit well under .500 and 7.5 games out of playoff position at the end of July. Such as it is, the Orioles spent this year’s trade deadline turning over roughly a third of their roster. Over the last week or so, the O’s have traded relievers Gregory Soto, Seranthony Domínguez, and Andrew Kittredge, along with infielders Ryan O’Hearn and Ramón Urías. Then on Thursday afternoon, Anthony DiComo reported that Cedric Mullins was on his way to the Mets; a few hours later, Jeff Passan broke the news that Charlie Morton would be joining the Tigers. The only healthy pending free agent who wasn’t traded out of Baltimore is Tomoyuki Sugano, and with Zach Eflin hitting the IL mere hours before the deadline, Sugano is now a load-bearing member of the rotation. Read the rest of this entry »
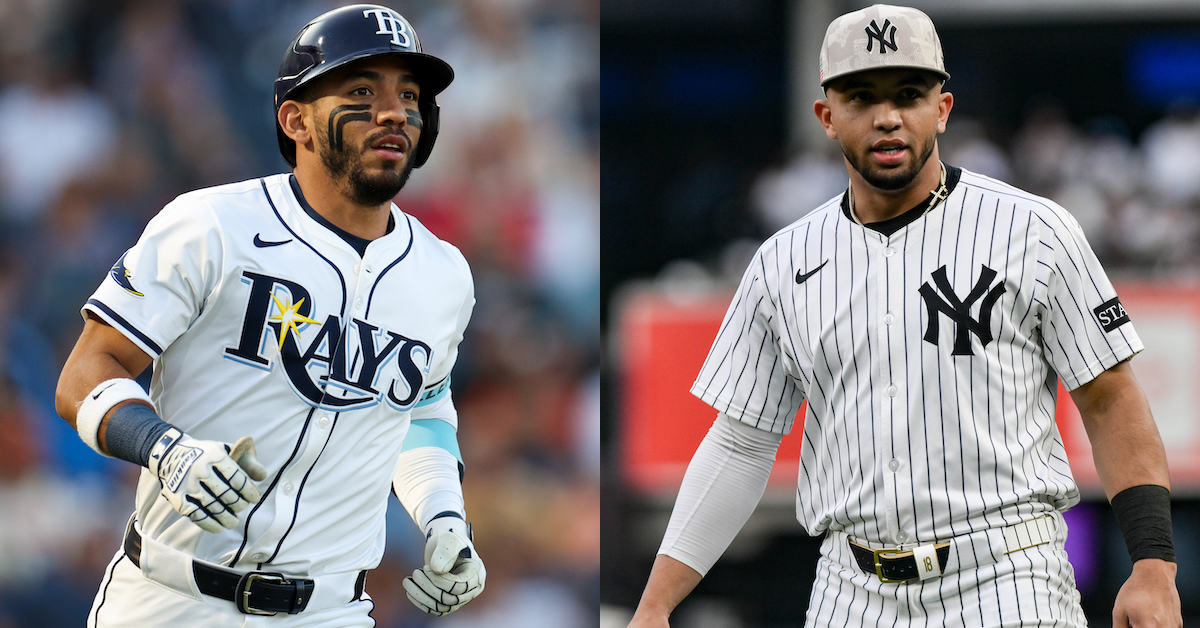
The Yankees had a busy deadline season. Whether trading for Ryan McMahon, patching smaller holes, or adding top relievers, they were in the news seemingly every day for adding to the 2025 club. As the deadline approached, they looked at their roster and decided that merely adding wasn’t enough. Thus, they finessed a roster reshuffle Thursday afternoon, acquiring utility infielder José Caballero from the Rays and trading utility infielder Oswald Peraza to the Angels.
Let’s start with Caballero. A plus-fielding, slap-hitting nuisance (complimentary), he has been a perfectly serviceable utility infielder in two-plus years of big league play. He has below-average raw power and a patient approach at the plate, which can result in some ugly strikeout numbers when pitchers challenge him early in the zone and he takes. Though he’s good at elevating the ball, it’s rarely with much authority, and he never quite worked out the Isaac Paredes trick of turning mediocre raw power into pulled homers. He was still a league-average contributor overall, though, because the rest of his game is excellent.
No matter which metrics you subscribe to, Caballero is a plus defender across the infield. He started playing the outfield this year and took to it quickly. He’s a pretty good bunter, if you’re into that; if you need someone to come off of the bench in a late-and-close situation and advance the runners, he’s your guy. Read the rest of this entry »
The Cubs approached the trade deadline with pitching as their top priority. They traded forMichael Soroka on Wednesday to shore up the starting rotation and added Andrew Kittredge to the bullpen later that night. That didn’t stop them from making a trade to improve their hitters: Getting in on the Twins’ Thursday fire sale, Chicago acquired utilityman Willi Castro for two pitching prospects, Ryan Gallagher and Sam Armstrong. And right before the buzzer, the Cubs also acquired left-handed reliever Taylor Rogers from the Pirates for outfield prospect Ivan Brethowr. This was the second swap Rogers was part of within a roughly 27-hour span, after he went from the Reds to the Pirates in Wednesday afternoon’s Ke’Bryan Hayesdeal.
The Cubs have one of the best lineups in baseball. They lead the majors in runs scored and the National League in wRC+. So they didn’t necessarily need to upgrade their offense before the deadline. Castro’s calling card is his versatility, and that’s the primary reason they acquired him. Just this year, he’s played every position but catcher and first base. Defensively, he’s probably a little in over his head at either of the premium up-the-middle positions — his career FRV at shortstop is -3 and -2 in center field — but he’s perfectly acceptable as a second baseman (2 FRV) or in either outfield corner (5 in left, -2 in right). In previous years, he was also slightly above average at third (2 FRV) before taking a step back this season (-3), though small-sample caveats certainly apply for his defensive metrics at any specific position because of how much he’s moved around. Only once has he logged more than 500 innings at an individual position in a season, and that was back in 2021 when he played 713 2/3 innings at second base with the Tigers.
That said, he is way more than just a multi-positional backup. At the plate, Castro has been solidly above average since joining the Twins in 2023; during those first seasons in Minnesota, he posted a combined 107 wRC+ and accumulated 5.4 WAR. This season, his offensive production has been slightly better — .245/.335/.407, 109 wRC+ — than in recent years because he’s tapping into his power more. He’s already smacked 10 home runs in 344 plate appearances after hitting a career-high 12 last year across nearly 300 more trips to the plate. That he is a switch-hitter only adds to his flexibility. He has been platoon neutral for his career, but he’s hitting left-handed hurlers much better this year (131 wRC+) than he has righties (100). Castro has been worth 1.1 WAR this season, a step back from his last two years despite his offensive improvements because his defensive value has declined. Some of this is due to a dip in his defensive metrics — his only plus position this season by FRV is left field — but it also has to do with the positional adjustment, as he’s spent more innings this season at positions further down the defensive spectrum; after playing 465 2/3 innings at shortstop in 2024 and another 211 1/3 in center field, he’s logged just 26 at shortstop this year to go along with a one-inning cameo in center. Read the rest of this entry »
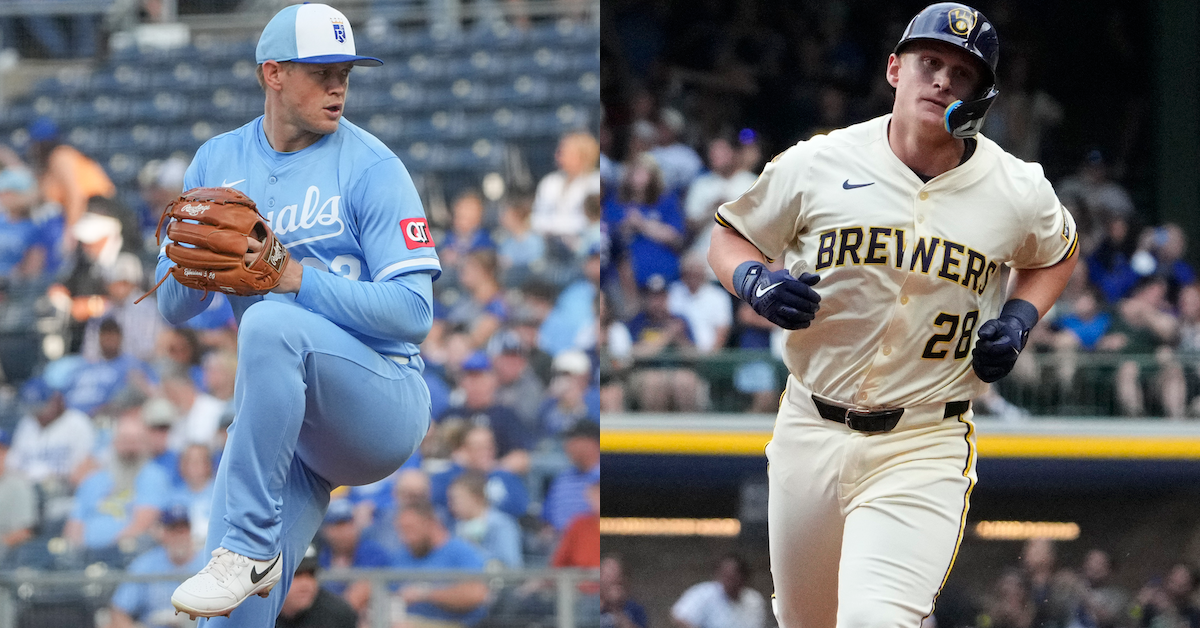
At the time of this writing, the Kansas City Royals’ playoff odds sit at 12%. They’re 54-55, 3.5 games back of the third AL Wild Card, packed in tight with a bunch of average teams chasing the major contenders, including the Rangers, Guardians, Rays, and Angels. (I’m going to go ahead and count the Twins out.) It’s a tough spot. You don’t necessarily want to go all in with a 12% chance of making the playoffs, but it’s a good enough shot that a sell-off would go down pretty poorly.
Threading this needle with precision, the Royals made a series of moves that filled key roster holes without gambling away any significant long-term pieces. The first of those went down yesterday morning, when they picked up two solid, controllable right-handers in Ryan Bergert and Stephen Kolek in exchange for backup catcher Freddy Fermin.
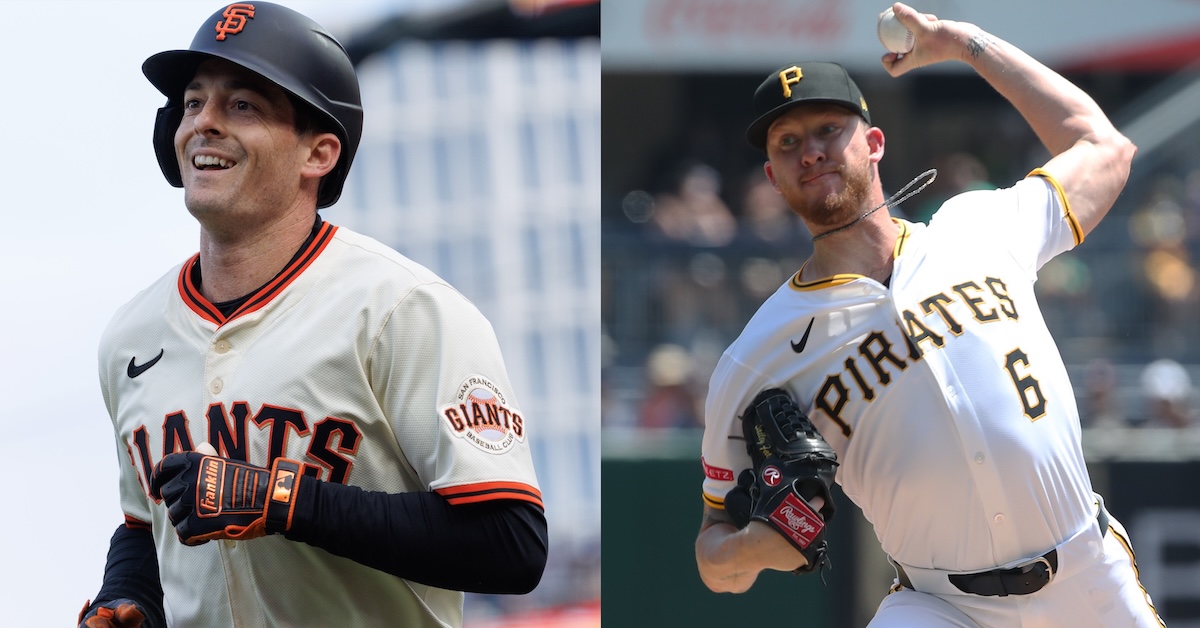
Later in the day, the Royals made two more trades. The first further shored up a depleted rotation; the second improved a truly abysmal outfield. First, they brought in lanky left-hander Bailey Falter from the Pirates, parting with up-and-down lefty Evan Sisk and Callan Moss, a first baseman with a .790 OPS in High-A who went undrafted in 2024. And a few minutes after the deadline passed, Jon Heyman reported that they’d picked up Mike Yastrzemski from the Giants for A-ball hurler Yunior Marte. Read the rest of this entry »