Archive for Featured Photo

Andrew Miller is Scuffling, and Also Great

Here’s a sentence that I didn’t think I’d be writing in 2019: Andrew Miller has accumulated -0.2 WAR this season. By FanGraphs’ version of WAR, he’s been less valuable than a replacement-level reliever. Here’s another sentence that makes a little more sense, but is at odds with the one I just wrote: Andrew Miller might be the Cardinals’ best reliever. Now, reliever performance is volatile and all, but we’re going to need an explanation. How can those two things be true at once?

Let’s start with Miller being below replacement level, because that would have been a surprising assertion before the year. Andrew Miller has faced 139 batters this season. He’s allowed eight home runs. 6% of his plate appearances have ended with the opposing batter trotting around the bases. That surely already sounds like a ton — indeed, Miller is second in the majors in home runs allowed per nine innings, behind only Josh Osich. You don’t need a sabermetric writer to tell you that’s bad.

As bad as 2.2 home runs per nine innings sounds, though, it might be underselling how wild Miller’s season has been on the home run front. Josh Osich is a great example of the kind of pitcher who normally leads the league in home runs allowed per nine. He’s a pitch-to-contact depth reliever who works by letting opponents put the ball in play and counting on his defense to make plays behind him. Now, that strategy mostly hasn’t worked — Osich has a career ERA of 5.11, and his FIP is 5.31, so it’s not as though he’s just been getting unlucky. Still, while Osich is homer-prone, he’s mostly just contact-prone, with the home runs a cost of doing business. Strike out only 19% of the batters you face, and there will be plenty of opportunities to give up home runs.

Andrew Miller’s case of the dingers isn’t like that at all. Miller is actually one of the least contact-prone pitchers in all of baseball this year. Only 51% of the batters he has faced have put the ball in play. That severely limits the opportunities they have to hit home runs. Osich, for comparison’s sake, has let 75% of batters put the ball in play. Miller is giving up home runs at a truly alarming rate considering how few opportunities he gives batters to put a ball in play. Read the rest of this entry »

Nick Kingham, Mark Prior, and Adam Wainwright on Crafting Their Curveballs

Pitchers learn and develop different pitches, and they do so at varying stages of their lives. It might be a curveball in high school, a cutter in college, or a changeup in A-ball. Sometimes the addition or refinement is a natural progression — graduating from Pitching 101 to advanced course work — and often it’s a matter of necessity. In order to get hitters out as the quality of competition improves, a pitcher needs to optimize his repertoire.

In this installment of the series, we’ll hear from three pitchers — Nick Kingham, Mark Prior, and Adam Wainwright — on how they learned and developed their curveballs.

———

Nick Kingham, Toronto Blue Jays

“I’ve been throwing a curveball since ninth grade, or maybe around 13 years old. I guess my dad originally taught it to me. But I never really had a good one. I threw a one-finger curveball for a little while. It was like a suitcase, you know? It kind of just spun and slowed down, and gravity would take it. Then someone told me to try spiking my finger. I’ve been throwing it that way ever since, probably for the last 15 years.

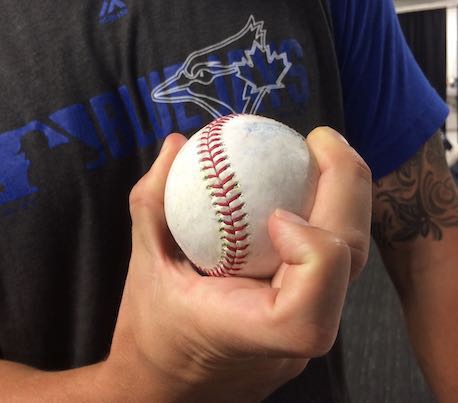
Nick Kingham’s curveball grip.

“It’s a standard spike. This is the horseshoe, the tracks go this way, and it’s right on there. Spike it up. There’s nothing… actually, I dig my nail into it. I set my index finger there and make sure that it has enough pressure. That’s comfortable to me. I like to have a secure grip on the ball. Read the rest of this entry »


The 2019 Replacement-Level Killers: First Base

Albert Pujols has shown some life at first base, but the Angels are still almost under water at the position (Photo: Keith Allison)

When it comes to replacement level, first base is a very different beast than catcher. In general, teams prioritize catcher defense and staff handling over offense, and even in this age of advanced analytics, there’s room to quibble over whether the available metrics — including the pitch-framing sort — capture enough of their value. As we lack a good staff-handling metric (catcher ERA remains inadequate due to sample-size issues), there’s a whole gray area that, among other things, allows teams, particularly contending ones, to convince themselves they’re getting enough value behind the plate.

First base is another story. Offense is comparatively easy to measure, and the expectations for the position are high. A contending team that lacks a heavy hitter at the spot, or at least an adequate one, is bringing a spork to a knife fight. At this end of the defensive spectrum, it shouldn’t be that hard to find alternatives, even if they possess relatively clunky gloves; in this day of shortened benches, you can generally find a utilityman to fill in defensively at first in the late innings. Particularly with so many teams within range of a Wild Card spot, the upgrades available as the July 31 deadline approaches make for some fairly slim pickings, and so some teams may prefer to shuffle through internal options.

Among contenders (which, for this series, I’ve defined as teams who are above .500 or have playoff odds of at least 10.0%, a definition that currently covers 18 teams), seven have gotten less than 1.0 WAR at the position thus far. Again, a closer look at each situation suggests that not all of them will be in the market for external solutions. Between early-season injuries and slow-starting veterans, some of these teams aren’t in as dire a shape as their overall numbers suggest, but that doesn’t necessarily mean they’re out of the woods. Note that I’m skipping over the Yankees, for whom an 0-for-4 from Luke Voit on Sunday was the difference between slipping below the threshold or clearing it. Read the rest of this entry »


2019 Trade Value: #1 to #10

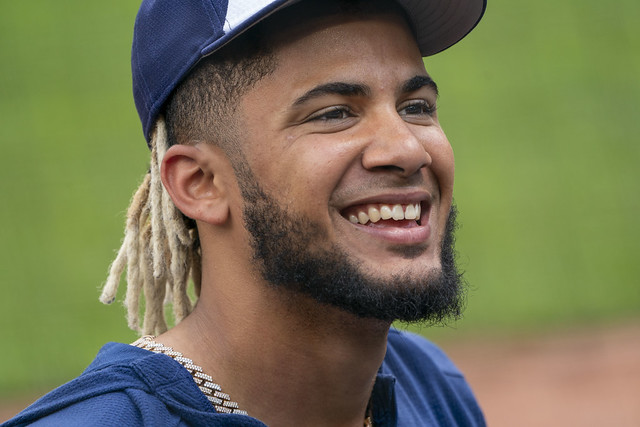
Fernando Tatis Jr. rocketed onto this year’s list and into the top 10. (Photo: Keith Allison)

As is the annual tradition at FanGraphs, we’re using a week around the All-Star Game — when the industry pauses to take a metaphorical breather — to take stock of the top-50 trade chips in the sport. For more context on exactly what we’re trying to do here, see the Honorable Mentions post linked at the top of the page.

For this post, I’ll present a graphic (by way of the wizard Sean Dolinar) breaking down each player’s objective skill level (represented, in this case, by a five-year WAR projection from ZiPS), contract/team-control details, rank in last year’s series, and then year-by-year details of age, WAR, and contract through the end of 2023, although a couple players have control beyond those five years, and some, you’ll notice, show projections for fewer years to reflect when those players reach free agency. For those readers who are partial to spreadsheets rather than blocks of text, I’ll also include all of the players we’ve ranked so far in grid format at the bottom of the post.

It should be noted that the ZiPS WAR forecasts influenced the rankings a bit. For players who were bunched together, it acted as an impartial tiebreaker of sorts, but the industry opinions I solicited drove the rankings.

With that said, let’s get to the final 10 spots on this year’s Trade Value list.

Five-Year WAR +22.1
Guaranteed Dollars
Team Control Through 2025
Previous Rank #18
Year Age Projected WAR Contract Status
2020 21 +3.3 Pre-Arb
2021 22 +3.8 Pre-Arb
2022 23 +5.0 Arb1
2023 24 +5.1 Arb2
2024 25 +4.9 Arb3
Pre-Arb
Arb

Vladito hasn’t been the otherworldly hitter many were hoping for or expected during his first taste of the big leagues, but no one I spoke with is worried. First of all, he’s running a .270 BABIP and underperforming his xwOBA by 17 points, suggesting he “deserves” to have a wRC+ over 100, which is still below his lofty pre-season projections, but not by much. And also, it’s been 66 games and he’s 20 years old.

Given his size and eventual move to first base, Vlad needs to mash, so his profile will be more sensitive to offensive performance than others might be, but the track record of the “that guy looks like a generational hitter” and “gets to the big leagues at 20” profiles is really strong. Vlad has an extra year of control over Gleyber Torres and Walker Buehler, so the projected five-win peak seasons are a push, and I lean to the extra year. Interestingly, there were concerns raised by executives about how all three of these guys will age; history tells us (I mean it feels like it does?) that at least one of them will turn out a good bit worse than we’re expecting. Read the rest of this entry »


This Week’s Prospect Movers

Below are some changes we made to The BOARD in the past week, with our reasons for doing so. All hail the BOARD.

Moved Up

Ronny Mauricio, SS, New York Mets:
We got some immediate feedback on Monday’s sweeping update, which included more industry interest in Mauricio. The average major league swinging strike rate is 11%. Mauricio has a 12% swinging strike rate, and is a switch-hitting, 6-foot-4 teenager facing full-season pitching. It’s common for lanky teenagers to struggle with contact as they grow into their frames, but Mauricio hasn’t had that issue so far.

Oneil Cruz, SS, Pittsburgh Pirates:
One of us was sent Cruz’s minor league exit velocities and they’re shockingly close to what Yordan Alvarez’s have been in the big leagues. Of course, there remains great uncertainty about where Cruz will end up on defense, and hitters this size (Cruz is listed at 6-foot-7) are swing and miss risks, but this is a freakish, elite power-hitting talent.

Marco Luciano, SS, San Francisco Giants:
This guy has No. 1 overall prospect potential as a shortstop with 70 or better raw power. He belongs up near Bobby Witt, who is older but might also be a plus shortstop while we’re still not sure if Luciano will stay there.

George Valera, OF, Cleveland Indians:
Valera is torching the Penn League at 18 and a half years old, and we’re not sure any high school hitter in this year’s draft class would be able to do it. His defensive instincts give him a shot to stay in center field despite middling raw speed, and his swing should allow him to get to all of his raw power, so it becomes less important that his body is projectable. He would have been fifth on our 2019 draft board were he playing at a high school somewhere in the U.S., so he’s now slotted in the between JJ Bleday and C.J. Abrams on our overall list. Read the rest of this entry »


Where are the 60 Home Run Hitters?

There have been a lot of homers in baseball this season. Perhaps too many, as Jay Jaffe wrote back in June. At its current pace, the majors will average 227 home runs per team, clobbering the 2017 mark of 204 and coming in way ahead of last year’s 186 mark. When Barry Bonds broke the single-season home run record in 2001, the major league team average was 182. When McGwire and Sosa dueled, it was 169. When Roger Maris broke Babe Ruth’s record, the team average was 152. So how is it that we have a 50% increase in home runs from the time Maris hit 61, and a 22% increase over last year, and yet still don’t have a player likely to hit 60 homers?

Here are this year’s home run leaders through Tuesday’s games along with their projected total, their current pace based on team games, and the number of homers per 700 plate appearances (which will be more important later):

MLB Home Run Leaders
Name PA HR Projected Pace HR/700 PA
Cody Bellinger 401 34 50 57 59
Christian Yelich 388 33 47 56 60
Mike Trout 402 30 48 51 52
Peter Alonso 394 30 45 52 53
Edwin Encarnacion 377 28 44 49 52
Josh Bell 408 27 39 47 46
Hunter Renfroe 304 27 43 47 62
Franmil Reyes 314 26 40 45 58
Max Muncy 381 25 38 42 46
Freddie Freeman 426 25 38 42 41
Mike Moustakas 382 25 38 42 46
Jorge Soler 395 25 37 42 44
Through July 16, 2019

Projections, which are admittedly somewhat conservative, expect there to be one 50-homer hitter at the end of the year (Cody Bellinger), as well as a handful of players with at least 40 homers. Even if we go by pace and the hitters hit exactly was well as they have up to this point, Bellinger and Yelich will have great seasons but fall a few homers shy of 60. Yelich and Hunter Renfroe are the only players on a 60-homer pace if they were to get to 700 plate appearances. While all the home runs being hit might make it seem like a 60-homer season should happen, the sheer number of homers in the game don’t actually dictate what the league leader might do. The graph below shows the average number of home runs by team per year along with the home run leader for that season: Read the rest of this entry »


Tyler O’Neill is Everything All at Once

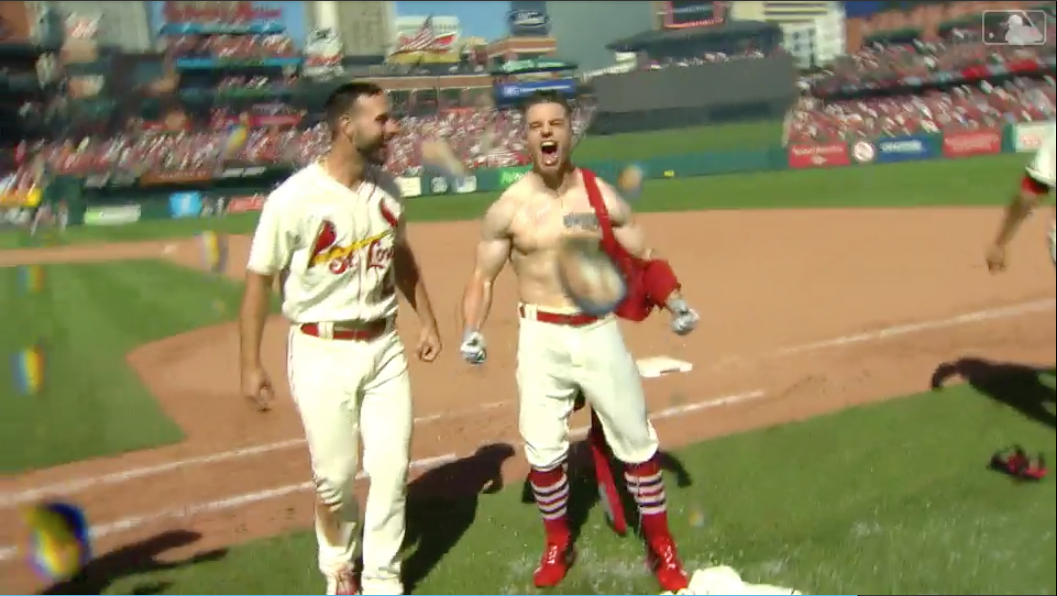
On an extremely superficial level, Tyler O’Neill looks like any other high-level prospect bouncing between the minors and the majors. After posting a 107 wRC+ in his first shot at Triple-A in 2017, he’s been excellent there over the past two years, putting up a combined 143 wRC+ in 427 PA. He’s been above-average in parts of two seasons in the majors — a 121 wRC+ over 232 PA. If the Cardinals didn’t have such an outfield logjam, he might have earned more major league playing time; indeed, the team traded Tommy Pham last summer in an attempt to find more plate appearances for O’Neill and Harrison Bader.

Look even slightly closer, though, and the narrative of O’Neill as average baseball player falls apart. Here is O’Neill, after his teammates tore off his jersey and undershirt following a walk-off home run. Even through the water droplets on the camera lens, his bulk is obvious:

How average can someone with biceps the size of most human beings’ legs be? Read the rest of this entry »


2019 Trade Value: #11 to #20

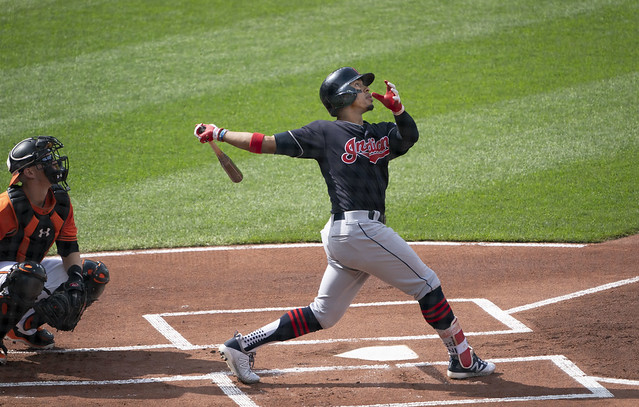
Francisco Lindor’s production (and smile) continue to rank highly throughout the industry. (Photo: Keith Allison)

As is the annual tradition at FanGraphs, we’re using a week around the All-Star Game — when the industry pauses to take a metaphorical breather — to take stock of the top-50 trade chips in the sport. For more context on exactly what we’re trying to do here, see the Honorable Mentions post linked at the top of the page.

For this post and the top 10 to follow, I’ll present a graphic (by way of the wizard Sean Dolinar) breaking down each player’s objective skill level (represented, in this case, by a five-year WAR projection from ZiPS), contract/team-control details, rank in last year’s series, and then year-by-year details of age, WAR, and contract through the end of 2023, although a couple players have control beyond those five years, and some, you’ll notice, show projections for fewer years to reflect when those players reach free agency. For those readers who are partial to spreadsheets rather than blocks of text, I’ll also include all of the players we’ve ranked so far in grid format at the bottom of the post.

It should be noted that the ZiPS WAR forecasts influenced the rankings a bit. For players who were bunched together, it acted as an impartial tiebreaker of sorts, but the industry opinions I solicited drove the rankings.

With that said, let’s get to the next 10 spots on this year’s Trade Value list.

Five-Year WAR +18.5
Guaranteed Dollars $46.0 M
Team Control Through 2023
Previous Rank #35
Year Age Projected WAR Contract Status
2020 27 +4.0 $7.0 M
2021 28 +4.0 $10.5 M
2022 29 +3.7 $12.5 M
2023 30 +3.5 $16.0 M

Snell signed an extension this winter that locks him up through his age-30 season, which would’ve been his first year of free agency. He really belongs as the last guy in the previous article, so you can see him on the tier with fellow possible/current aces German Marquez, Shane Bieber, Jacob deGrom, Jose Berrios, Chris Paddack, Aaron Nola and (given the late revelations I’ve since added to his blurb about the details of his contract) Max Scherzer. All of these guys rank from 20th to the low-30s, and could be put in almost any order. Most sources I spoke with moved them as a group and generally kept the same names at the top/bottom as I have, shuffling the order in the middle a bit. Once you take Scherzer off the table as the best pitcher in baseball, ZiPS essentially has Snell, Jacob deGrom, Marquez, Bieber, and Nola tied for second among those pitchers over the 2020-2024 term. Snell is the only lefty in the group, he’s on pace for his fourth straight year of 31 regular season starts, his velo has been stable year-to-year at an average of 95.7 mph, his 3.12 FIP over his last 58 starts is a sustained run of elite performance, and his extension is for reasonable money, for exactly as long as I’d be predicting No. 2 or 3 starter performance from him. Read the rest of this entry »


Concussions Have Pushed Francisco Cervelli’s Career to a Crossroads

It’s been a strange couple of weeks for Francisco Cervelli. The 33-year-old Pirates catcher, who hasn’t played since May 25 due to a concussion, was quoted as saying earlier this month that he was giving up catching due to the toll of multiple concussions, but on Saturday, he refuted that report. Either way, his career appears to be at a crossroads, and his situation serves to remind us just how vulnerable catchers are to such injuries.

Cervelli — whose surname means “brains” in Italian, hence the nickname “Frankie Brains” — began the season in a slump and was hitting just .193/.279/.248 when, in a game against the Dodgers, Joc Pederson’s broken bat struck him in the mask:

He was placed on the seven-day injured list, and after undergoing several rounds of tests, wasn’t cleared to resume baseball activities until late June. It was the sixth documented concussion of the catcher’s 11-year major league career; he suffered one with the Yankees in 2011, two with the Pirates in 2017, and two last year. While he served primarily as a backup during parts of seven seasons (2008-14) with New York — a period that included a near-full season exile to Triple-A and a 50-game Biogenesis-related PED suspension — he’s been the Pirates’ primary backstop since arriving in a November 2014 trade for reliever Justin Wilson, one that rates as quite the heist given that Wilson’s 1.5 WAR in his lone season in the Bronx (though Yankees general manager Brian Cashman did flip him to the Tigers for Chad Green and Luis Cessa, a move that’s still paying dividends). Read the rest of this entry »


2019 Trade Value: #21 to #30

Like Max Scherzer, deGrom’s contract has deferrals that affect his trade value. (Photo: Keith Allison)

As is the annual tradition at FanGraphs, we’re using a week around the All-Star Game — when the industry pauses to take a metaphorical breather — to take stock of the top-50 trade chips in the sport. For more context on exactly what we’re trying to do here, see the Honorable Mentions post linked at the top of the page.

For this post and the two to follow, I’ll present a graphic (by way of the wizard Sean Dolinar) breaking down each player’s objective skill level (represented, in this case, by a five-year WAR projection from ZiPS), contract/team-control details, rank in last year’s series, and then year-by-year details of age, WAR, and contract through the end of 2023, although a couple players have control beyond those five years, and some, you’ll notice, show projections for fewer years to reflect when those players reach free agency. For those readers who are partial to spreadsheets rather than blocks of text, I’ll also include all of the players we’ve ranked so far in grid format at the bottom of the post.

It should be noted that the ZiPS WAR forecasts influenced the rankings a bit. For players who were bunched together, it acted as an impartial tiebreaker of sorts, but the industry opinions I solicited drove the rankings.

With that said, let’s get to the next 10 spots on this year’s Trade Value list.

Five-Year WAR +12.6
Guaranteed Dollars
Team Control Through 2024
Previous Rank
Year Age Projected WAR Contract Status
2020 24 +2.5 Pre-Arb
2021 25 +2.5 Pre-Arb
2022 26 +2.7 Arb1
2023 27 +2.6 Arb2
2024 28 +2.3 Arb3
Pre-Arb
Arb

Paddack was acquired from the Marlins in 2016 for Fernando Rodney, a move that looks like highway robbery in hindsight. Paddack blew out his elbow three starts after the trade and wasn’t a big prospect at that time; he’d had gaudy numbers in Low-A at that point, but had signed for $400,000 in the eighth round and was a fastball/changeup type with feel and a below average breaking ball. Paddack has come on a lot since then and is basically a No. 3 starter in his age-23 rookie season, and looks like he’s traveling the James Shields path. Read the rest of this entry »