Archive for Featured

Bellinger, Devers, and MLB’s Most Improved Position Players

FanGraphs contains multitudes. Multiple flavors of Wins Above Replacement — one in which the pitching component is driven by FIP, the other by actual runs allowed (RA9-WAR) — for one thing. Multiple projection systems (Steamer and ZiPS) and ERA estimators (FIP, xFIP, SIERA). Multiple measures for defense, pitch selection, and plate discipline, borne of different data feeds. Multiple ways of measuring playoff odds and projected won-loss records. Multiple depth charts, now that we’ve brought Roster Resource on board. There’s a lot of cool stuff… if you know where to look.

One of the cool but relatively new and lesser-known features is our Season Stat Grid, introduced just over a year ago, and in the planning stages for longer (I know that I’m one of the people who lobbied for the tool). The grid allows the user to view 11 year worth of data in a single category, and to track and rank year-to-year totals and changes based on thresholds of plate appearances and innings. It’s hours of fun, and occasionally fuel for an article. So after highlighting the exceptional, breakout season of Rafael Devers and noting that — at the time it was written, at least — he had the majors’ largest year-over-year improvements in batting average, on-base percentage, and WAR, while ranking second in his gains in wRC+ and fourth in slugging percentage, I figured the topic was worth a league-wide look.

Towards that end, I chose 10 statistical categories where we might look for significant changes, namely the aforementioned five plus walk and strikeout rates, out-of-zone swing rate, fielding (UZR plus positional adjustment, if any) and, for a nod towards win expectancy, Clutch. To qualify, players had to reach 400 plate appearances last year and 300 thus far this year. I then took the top 30 players whose changes went in the right direction (higher in all cases except for strikeout and chase rates), awarding 30 points for first place, 29 for second, and so on. When two or more players were tied — even if it was just a virtual tie, where we can’t see what’s to the right of the displayed decimals — I split the points evenly among the tied; for example, James McCann and Yoán Moncada, who have increased their batting average by 66 points apiece, occupy the third and fourth spots and thus each get 27.5 points. I doubled the impact of WAR and wRC+ (60 points maximum), even though components of those are included elsewhere within the survey, on the belief that those two stats drive the lion’s share of our understanding as to who has improved.

Read the rest of this entry »


Did the Cardinals Get Robbed of a Chance at a Win?

On Wednesday night, the Cardinals trailed the Brewers 5-3 entering the eighth inning. As the home team, St. Louis went back out on defense to start the frame. Lefty Tyler Webb retired the Brewers on eight pitches. Before the Cardinals could take their turn at the plate in the bottom of the eighth, however, it started raining. Confusion and more rain ensued.

Now, the Brewers had come up to bat in the top of the eighth, so the Cardinals were supposed to get a chance to at least finish the inning, right? That’s what the press box in St. Louis was originally told, but that statement was clarified.

As for the rule, MLB’s website states:

If a regulation game is terminated early due to weather, the results are considered final if the home team is leading. If the home team is trailing, the results are considered final if the game is not in the midst of an inning when the visiting team has taken the lead.

The rule is fairly clear that since the Brewers began the eighth inning with the lead, once the game is terminated, the Brewers get the win. A suspension to pick up the game at a later date wasn’t an option for this game. As Derrick Goold indicated above, general practice is to let the home team get as many cracks at scoring as the visiting team. If the game were to continue, the teams would have had to wait until at least 11:30 or 12, when the rain got lighter and died down. The Cardinals remained at home for their next game while the Brewers made the trip back to Milwaukee with an offday before their game on Friday. While I can’t say whether or not the result was fair, or look up all the instances in which games were delayed and then continued and to which this rule might have been applied, we can go back and look at all the instances when a game was terminated. Read the rest of this entry »


The Best Bullpens in Baseball

After finishing up some research noting the wide gap between the quality of relief innings depending on the importance of the situation this season, it felt necessary to take a similar look at team performance. If teams were deploying less-good relievers in low leverage situations and good ones in high leverage situations, it could distort our sense of the quality of a bullpen when looking at overall numbers.

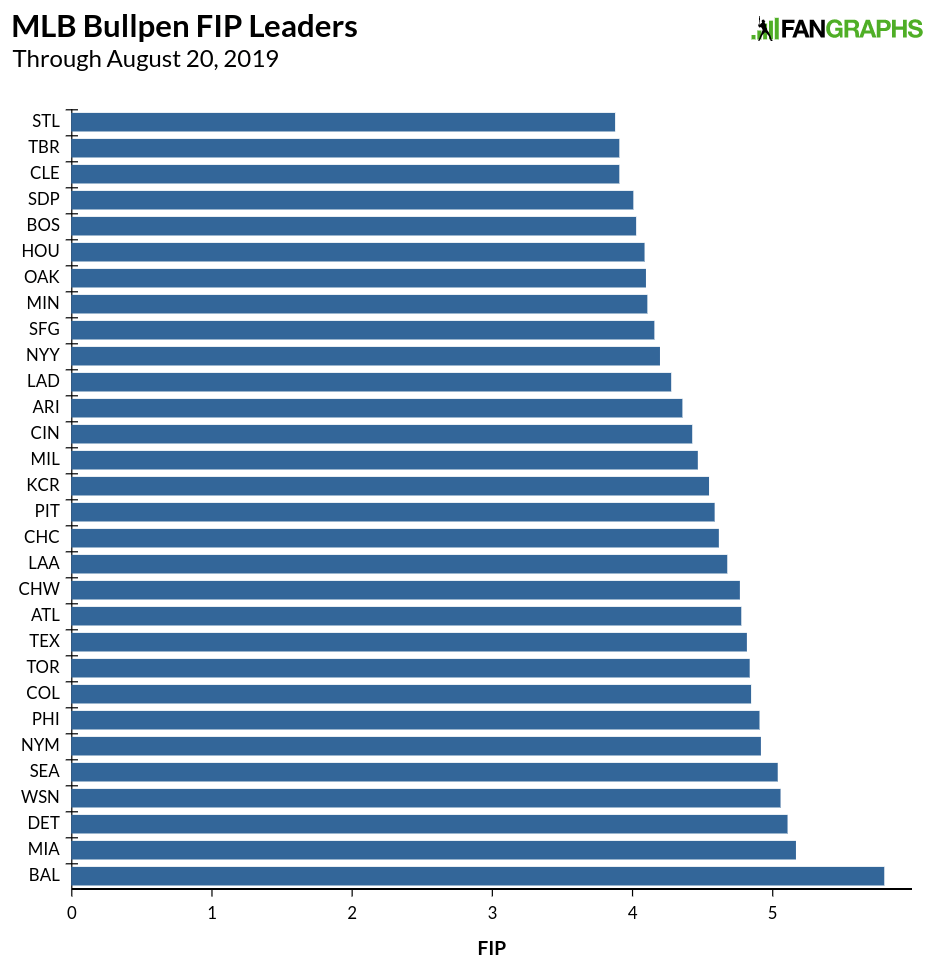
We’ll start with a pretty generic view of bullpens this year, with FIP by team:

The Cardinals have the lowest FIP of any bullpen this season, as the group as a whole has pitched very well. The Rays coming in second and first in the American League is somewhat of a surprise given their use of an opener in half their games; they are losing about 60 good relief innings and replacing them with around 180 good-but-not-as-good starting pitching-type innings. The teams fall down in a nice cascade the rest of the way, with the Baltimore Orioles providing a a very heavy base at the bottom of baseball.

But not all innings are created equal, and some of the innings pitched by bullpens are more important than others. If we separate meaningful innings (medium leverage and high leverage) from less important innings (low leverage), we can get a sense of how good a team’s bullpen is when it matters. This also could provide a better sense of which teams might be better prepared for the playoffs, given the consolidation of relief innings in October:

Read the rest of this entry »


The Real Reliever Problem

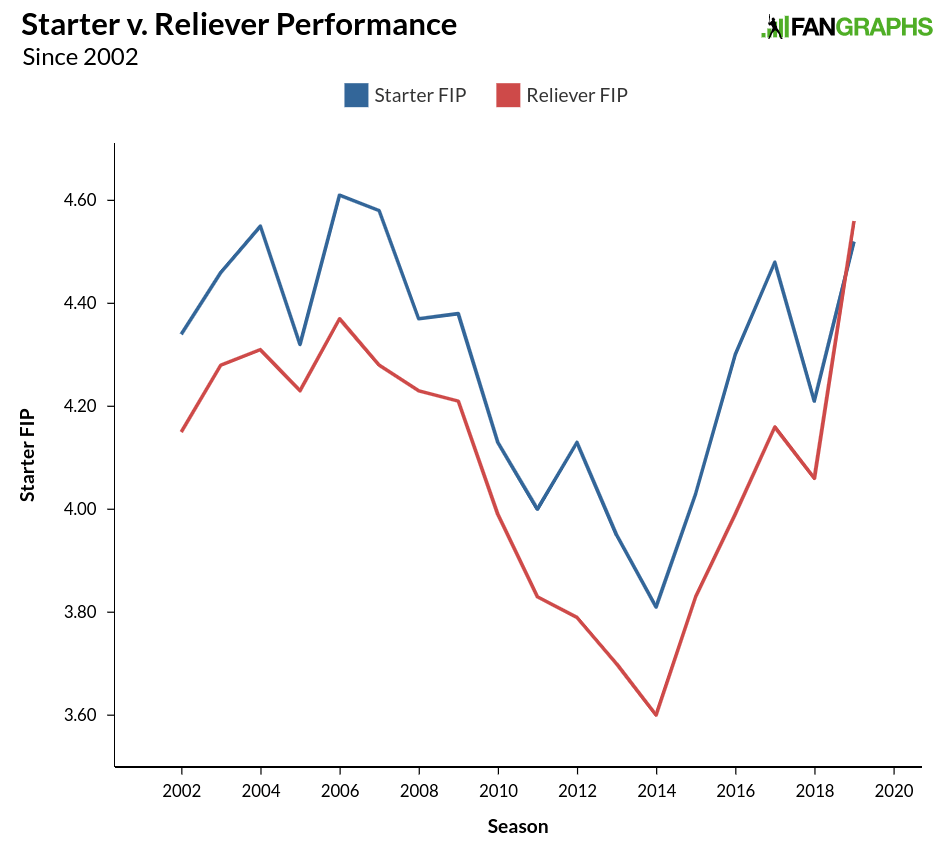
With so many variables, isolating specific trends in baseball can be tricky. Relievers have been pitching more and more innings. Strikeouts keep going up. The ball has been juiced, de-juiced, and re-juiced, making home run totals hard to fathom and difficult to place in context, both for this year and for years past. One noticeable aspect of this season’s play, influenced by some or all of the factors just listed, is that relievers are actually performing worse than starters. Our starter/reliever splits go back to 1974, and that has never happened before. Here is how starter and relievers have performed since 2002:

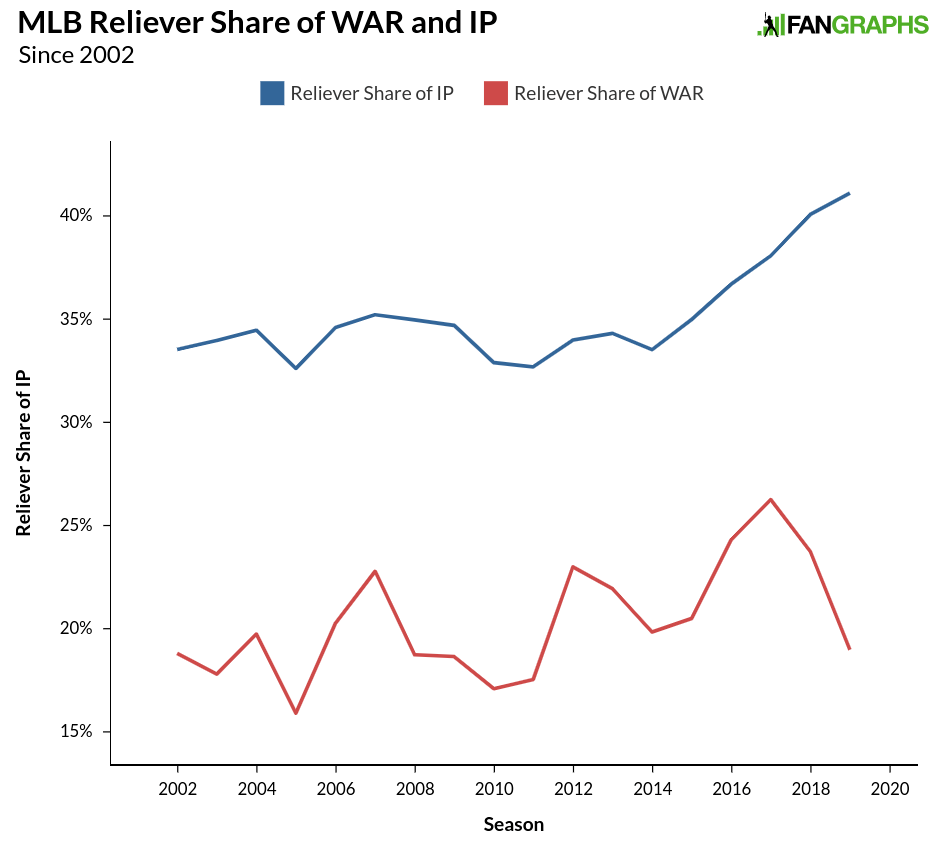
A healthy gap between the two roles has existed for some time, but seems to have taken an abrupt turn this year. Ben Clemens looked at the talent level between starters and relievers earlier this season in a pair of posts that discussed how starters are preparing more like relievers, as well as the potential dilution of talent among relievers. The evidence seemed to point toward the latter theory, though exactly how that dilution has affected performance comes in a rather interesting package. Providing some evidence for the dilution effect is the number of innings handled by relievers in recent seasons. While the idea of starters pitching better than relievers is a new one statistically, the trend of increasing reliever innings likely made this year’s change possible. Below, see the share of reliever innings and reliever WAR since 2002:

Read the rest of this entry »


We’ve Reached Peak Position Players Pitching

On Monday, Rays’ infielder Michael Brosseau took the mound. On Sunday, it was Brewers infielder Hernán Pérez, and before him, Diamondbacks catcher Alex Avila on Saturday, and Reds infielder Jose Peraza on Friday. On Thursday, which now seems so long ago — seriously, do you remember what you had for dinner that night? — it was Yankees first baseman Mike Ford. If you think that home run and strikeout rates have gotten out of hand, consider the tally of position players pitching.

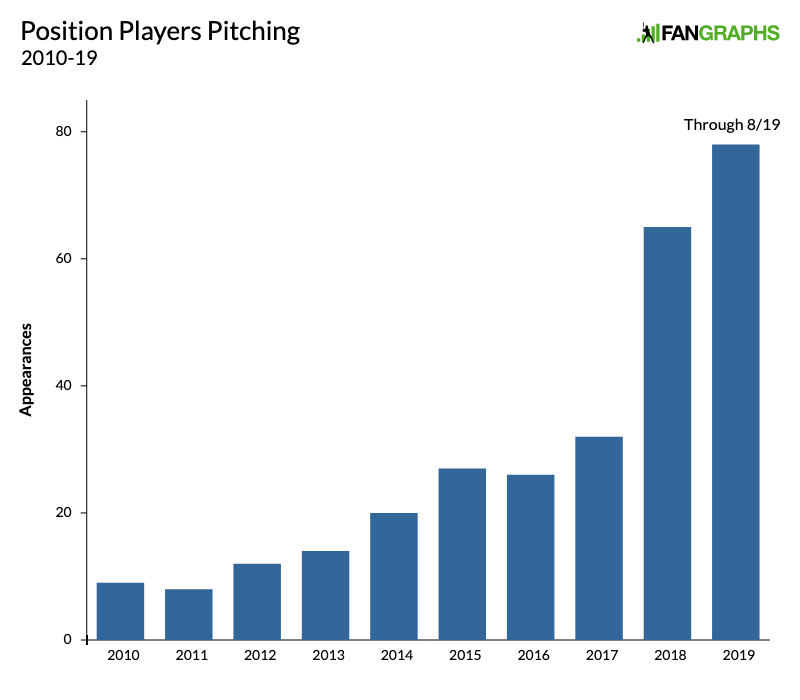
While teams are producing homers at a per-game rate 12% higher than the previous record (set in 2017), and while per-game strikeout rates are on the rise for the 14th straight season (up about 3% relative to last year), the single-season record for position player outings (65, set just last year, and no, that count doesn’t include Shohei Ohtani) fell earlier this month. Already, position players have taken the hill a total of 78 times this season; prorated to a full schedule, that’s 101 outings, a 55% increase on last year. And if things were to continue at the blistering pace we’ve seen since the All-Star break — 33 appearances in 39 days — the number would soar higher than the drive the Indians’ Carlos Santana hit off Ford:

Whew. Traditionally, a position player pitching appearance has been a break-glass-in-case-of-emergency desperation move (generally in extra innings) or a lighthearted farce that draws attention away from an otherwise unpleasant blowout. Through some combination of higher-scoring games, higher per-game totals of relievers, concerns about reliever workloads, and the reduced stigma of this particular maneuver, the rate of such appearances has accelerated. Like the barrage of homers and strikeouts, whether or not the higher frequency takes the fun out of it is rather subjective. To these eyes, the novelty is in the absurdity, like imagining a dog penning this article, and the bordering-on-routine nature of this year’s appearances has dimmed some of the luster. Even so, it’s an interesting enough subject to dwell upon for a few minutes.

For starters, here’s the progression for the past decade:

Read the rest of this entry »


Trevor Cahill, Marco Gonzales, and David Phelps on Crafting Their Curveballs

Pitchers learn and develop different pitches, and they do so at varying stages of their lives. It might be a curveball in high school, a cutter in college, or a changeup in A-ball. Sometimes the addition or refinement is a natural progression — graduating from Pitching 101 to advanced course work — and often it’s a matter of necessity. In order to get hitters out as the quality of competition improves, a pitcher needs to optimize his repertoire.

In this installment of the series, we’ll hear from three pitchers — Trevor Cahill, Marco Gonzales, and David Phelps— on how they learned and developed their curveballs.

———

Trevor Cahill, Los Angeles Angels

“I didn’t throw my [current] curveball until my second year in the big leagues. I used to throw the double-knuckle — I didn’t spin it; I would literally flick it — and that worked in the minor leagues. It was actually my strikeout pitch. But once I got up here, I couldn’t really throw it with the big-league ball. Not consistently.

“The seams in the minor leagues were bigger, and that made a difference. Plus, big league hitters are more patient. I used to throw that pitch in the dirt a lot, and get swings, but I had trouble throwing it for strikes. Big league hitters, if you can’t throw it for a strike, they see that spin and just spit on it.

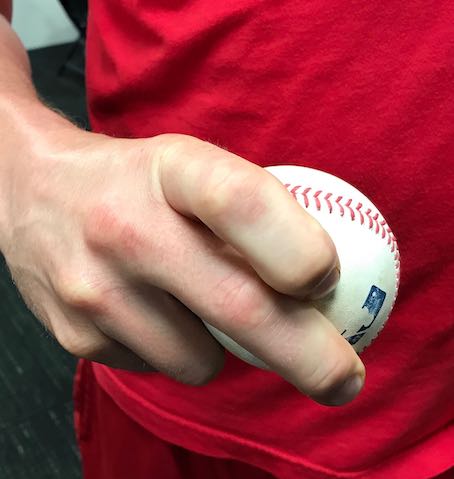
Trevor Cahill’s curveball grip.

“One day I was playing catch with Brett Anderson, working on his slider grip, which he spikes. I did that, and it was really good on flat ground, so that offseason I started working on it. Then my finger started coming up higher, so I was throwing a normal spiked curveball. In 2010, in spring training, I started using it against hitters. I’ve thrown it ever since. Read the rest of this entry »


One Pitch, Optimally Speaking

As I’ve chosen topics to research and write about over the past few months, I’ve let an obsession creep into my writing catalog — I’m fascinated by pitcher and batter behavior in 3-0 counts. Whether it’s three-pitch strikeouts after falling behind 3-0, Ronald Acuña aggressively hacking on 3-0, or even just Brandon Belt sneaking in a bunt, I can’t get enough of the goofy ways baseball gets distorted in that most extreme of counts.

What’s so fun about 3-0 is that context matters. For a lot of baseball, looking at things in a context-neutral fashion is the best way to analyze it. A double is a double is a double, and it doesn’t make sense to treat one with the bases juiced in a tie game differently than you would a leadoff double in the first inning when you’re assessing a player. Hitters have little control over balls in play, and absolutely none over who’s on base when they come to the plate. Pitchers, likewise, can’t control sequencing — that’s why concepts like wOBA and FIP do a better job predicting future results than RBI and win/loss record (or, fine, ERA).

But one place context does matter is the count. The world of 3-0 counts is only barely related to 0-2 counts. A pitcher’s arsenal is limitless at 0-2, constrained mostly to fastballs on 3-0. Conversely, a batter has no choice other than to defend the strike zone on 0-2, whereas 3-0 opens up myriad possibilities. That context is what makes the realm of 3-0 counts so fascinating to me. Today, I thought I’d take a theoretical approach to the subject. Read the rest of this entry »


Sunday Notes: Dodgers Prospect Jack Little is Stanford Smart

Jack Little may well become a big-league pitcher. Ditto a member of a big-league front office. Drafted in the fifth round this year out of Stanford University, the 21-year-old right-hander possesses the potential to do both. For now, he’s taking the mound for the Great Lakes Loons, the low-A affiliate of the Los Angeles Dodgers.

On Friday, I asked Little about the genesis of his low-three-quarter arm slot.

“That’s a good question, honestly,” replied the righty, who has a 2.05 ERA in 22 professional innings. “In high school I was more high three-quarters — a normal three-quarters slot — but then I kind of just naturally moved lower. It wasn’t intentional, I just did it.”

Success followed. Little began getting more swings-and-misses with his fastball, and unlike many pitchers who move to a lower slot, the movement wasn’t downward. “I started missing above barrels a lot more,” Little explained. “I became more deceptive, and while I’m not 98 [mph] — I’m only low 90s — it kind of gets on the hitter, and plays more up in the zone.”

His slider is his best secondary pitch, which didn’t used to be the case. Prior to moving into the closer role at Stanford in his sophomore season, Little’s changeup was his go-to off-speed. He subsequently became fastball-heavy, with his changeup in his back pocket, and his slider a reasonably reliable No. 2 option… this despite its being, as he now knows, markedly unrefined. Read the rest of this entry »


Here Are Some Recent Prospect Movers

We have a sizable collection of players to talk about this week because the two of us have been busy wrapping up our summer looks at the 2020 Draft class over the last couple weeks. This equates to every prospect added to or moved on THE BOARD since the Trade Deadline.

Top 100 Changes
We had two players enter the 50 FV tier in Diamondbacks SS Geraldo Perdomo and Padres C Luis Campusano. Perdomo is in the “Advanced Baseball Skills” player bucket with players like Vidal Brujan, Brayan Rocchio and Xavier Edwards. He’s added visible power since first arriving in the States and had as many walks as strikeouts at Low-A before he was promoted to the Cal League, which has been Campusano’s stomping ground all summer. He’s still not a great catcher but he does have an impact arm, big power, and he’s a good enough athlete that we’re optimistic he’ll both catch and make the necessary adjustments to get to his power in games down the line.

We also moved a D-back and a Padre down in RHP Taylor Widener and 1B Tirso Ornelas. Widener has been very homer prone at Triple-A a year after leading the minors in K’s. His fastball has natural cut rather than ride and while we still like him as a rotation piece, there’s a chance he continues to be very susceptible to the long ball. Ornelas has dealt with injury and swing issues.

On Aristides Aquino
Aristides Aquino was a 50 FV on the 2017 Reds list; at the time, he was a traditional right field profile with big power undermined by the strikeout issues that would eventually cause his performance to tank so badly that he became a minor league free agent. A swing change visually similar to the one Justin Turner made before his breakout (Reds hitting coach Turner Ward comes from the Dodgers) is evident here, so we’re cautiously optimistic Aquino will be a productive role player, but we don’t think he’ll keep up a star’s pace. Read the rest of this entry »


In 2019, Team Payroll and Wins Are Closely Linked

Over the last decade, we’ve seen a change in the demographics of baseball, with playing time shifting away from older, declining veterans toward younger players still in their prime. There’s a good reason for that, as each new generation of player entering the majors has been getting better and better relative to their older peers. Baseball’s owners have capitalized on this development — those younger, better players are also much cheaper. And teams have not reinvested those gains elsewhere on their rosters, as major league payrolls have stagnated the last few seasons while amateur talent expenditures have become hard-capped. Given the emphasis on younger players, it might be reasonable to believe that when it comes to fielding a winning team, payroll matters less than ever. But that hasn’t been the case this season.

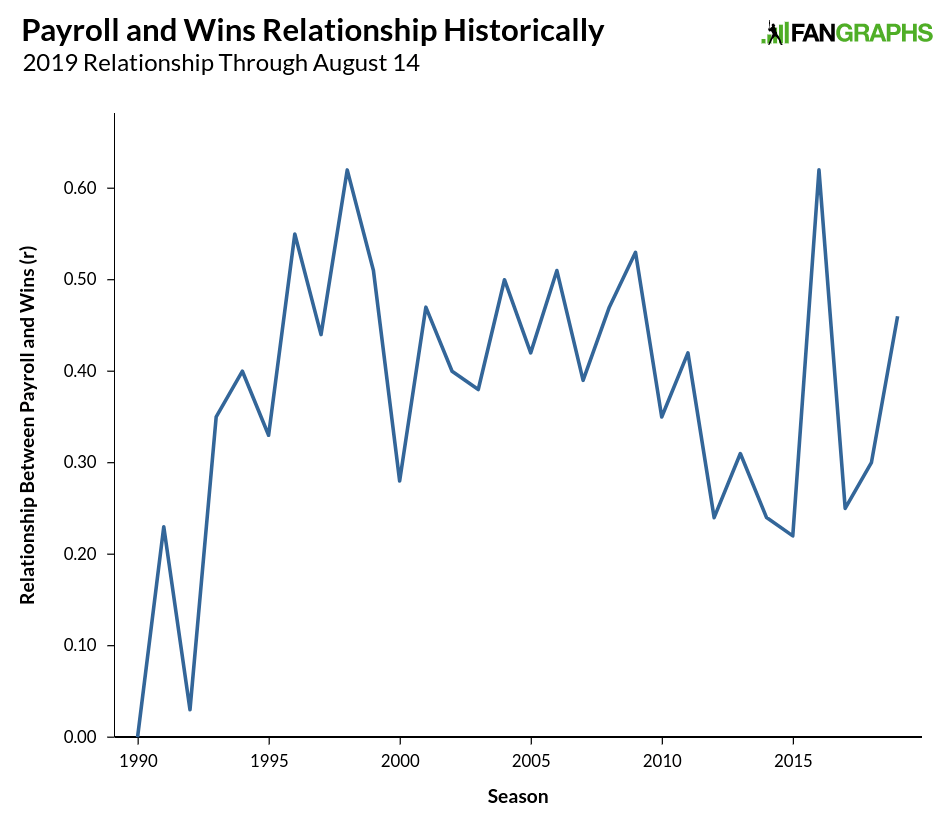
This piece marks the fifth season during which I’ve taken a look at the standings in August and compared them to Opening Day payrolls (2015, 2016, 2017, 2018) and for the most part, the relationship between Opening Day payrolls and wins has been relatively low. I’ve used the Pearson correlation coefficient “r” to track the strength of the relationship between the two and from the end of the strike through 2011, the average correlation per year was .45. In the last seven seasons heading into this season, though, the correlation coefficient between the two was higher than .31 only once, when it was a high .62 back in 2016.

In past years, I’ve noted that while individual season correlations have remained low, looking at either sustained spending or using Forbes franchise valuations to gauge a team’s overall financial might tends to show that the relationship between spending, wealth, and winning remains strong. That logic remains for this season, and indeed, the relationship between wins and payroll trails only that of 2016 season this decade:

Read the rest of this entry »