Cleveland Has One Piece of Their Outfield Figured Out

At this time last year, the Cleveland Indians were coming off a disappointing exit from the playoffs after getting swept by the Astros in the Division Series. Michael Brantley was on his way out the door as a free agent, soon to join the team that had ousted him from the playoffs in October. His departure left a gaping hole on Cleveland’s roster with no obvious internal replacements. Signing a free-agent outfielder seemed like an obvious need, but no significant move came. The Indians entered the season with the outfield trio of Jake Bauers, Leonys Martín, and the husk of Carlos González. Reinforcements arrived as the season wore on; Yasiel Puig came over in a trade with Cincinnati, and Cleveland’s 12th-ranked prospect Oscar Mercado made his major league debut.
Cleveland’s outfield is in nearly the same state now as it was in early November last year. Puig is a free agent and they have Bauers, Mercado, and Greg Allen penciled in as their starting outfield trio. Luckily, it looks like Mercado can be a long-term solution in center field.
Originally drafted by the Cardinals as a glove-first shortstop out of high school in the second round of the 2013 draft, Mercado struggled to hit during his first few years as a professional. Over his first four seasons in the minors spanning three different levels, he posted a combined 79 wRC+. The Cardinals shifted him to center field in 2017 and he enjoyed a breakout year at the plate, posting a 114 wRC+ in Double-A. Here’s how Eric Longenhagen described Mercado’s improved approach prior to the 2018 season:
Mercado has embraced his modest, but viable, pull-side pop and his approach is largely geared for contact in that direction. This narrow approach caused his strikeout rate (a career 13% entering the season) to spike, but Mercado is making loud contact for the first time in his career.
Mercado was traded to Cleveland at the deadline in 2018 and made his major league debut in May of this year. Through the ebbs and flows of his rookie campaign, he thrived when he stuck with the pull-heavy approach that got him to the majors.
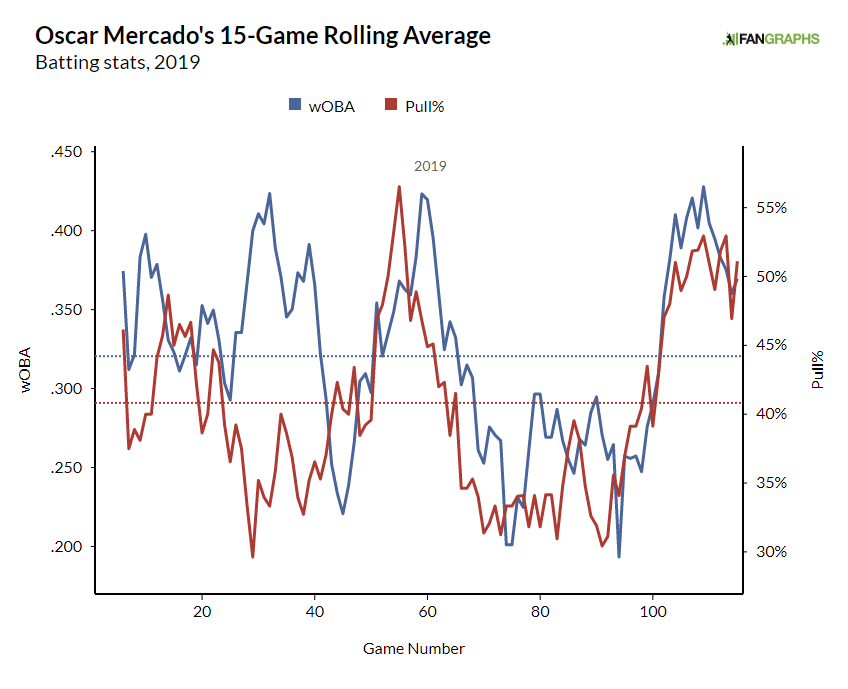
Beyond his initial success in May and June, Mercado’s wOBA looked intimately tied to his pull rate through the rest of the season. He really struggled in August when his pull rate fell to 32.5%, and he rebounded in September when he started pulling the ball almost half the time. Just look at his splits based on batted ball direction:
| Direction | GB% | FB% | Hard% | ISO | Exit Velo | Launch Angle | wOBA |
|---|---|---|---|---|---|---|---|
| Pull | 53.4% | 21.6% | 47.0% | .318 | 89.4 | 6.9 | .462 |
| Center | 35.5% | 41.9% | 41.1% | .115 | 86.8 | 12.4 | .299 |
| Opposite | 22.2% | 64.2% | 25.3% | .179 | 81.7 | 25.4 | .276 |
It isn’t surprising to see such a productive split when pulling the ball, but Mercado’s batted ball profile almost makes it too easy to understand why he is so successful when doing so. When hitting to the opposite field, his exit velocity plummets to 81 mph while his fly ball rate jumps up to 64%. The result is lazy fly balls to right field that are easily converted to outs. The same problem occurs when he hits the ball up the middle to a less-extreme degree. His bat just doesn’t have enough pop to support elevating the ball so often when he isn’t pulling it too.
With an aggressive, high-contact approach at the plate, he should be able to leverage his elite sprint speed into more hits. But putting that many balls in the air when hitting to the right side really limits his opportunities to utilize his best tools. His 97th percentile sprint speed and his good contact rate seem like a fit for an approach that uses all fields, but his swing is geared towards pulling the ball to left. Perhaps there’s some middle ground between these two, but it might require making some adjustments to his swing.
Defensively, the former shortstop has excelled in the outfield. DRS thought he was the sixth-best center fielder in 2019 with nine runs saved. UZR was a little less impressed with just 2.8 runs saved, and Statcast’s defensive metrics back this up. He was five outs above average and his elite reaction time was the sixth-highest among all outfielders. Additionally, his elite sprint speed definitely helped him cover up some less-than-ideal routes.
Cleveland hasn’t had a regular full-time center fielder since Michael Bourn from 2013-2015. Nine different players have accumulated more than 100 innings in center since 2016. Mercado’s 1.7 WAR was the best mark posted by a Cleveland center fielder since Tyler Naquin’s rookie year in 2016. The Indians have plenty of fringe candidates to fill their outfield, as Allen, Bauers, Jordan Luplow, and Franmil Reyes all profile better as corner outfielders or fourth outfielders. Meanwhile, Naquin and Bradley Zimmer have unanswered health questions that will likely prevent them from taking a full-time job in 2020. Mercado’s defensive chops in center should allow him to provide everyday value and his bat shows enough promise to help him stick long-term. That’s one outfield spot down and two more to fill.