When the 2019 major league baseball season opened, observers generally agreed with the projections that forecast the Baltimore Orioles’ pitching staff has likely to suffer like no other rotation in the American League East. Then again, not even the most pessimistic models could have predicted what the New York Yankees — and more specifically, Gleyber Torres — had in store for the Orioles in the teams’ first 12 games against each other.
First, let’s do a general body count after the latest six-game sweep the Orioles endured at the Yankees’ hands:
- New York launched 36 home runs in 12 games. That’s already the third-most home runs the Yankees have generated against the Orioles in a single season. They are 10 home runs short of their 2017 record with seven games to go.
- The Yankees’ tOPS+ against the Orioles this year is 127. Basically as a group when facing Baltimore, they own an OPS similar to Kris Bryant’s in 2019 (.967).
- The xwOBA of Yankees hitters against Baltimore is .393. This is like if the Yankees lineup were instantly turned into a 2019 version of Franmil Reyes, Mitch Moreland, or Justin Turner.
But the destruction would have never reached these levels if not for Torres. The sophomore infielder has launched 10 of his 12 homers this year against the Orioles, joining Joe DiMaggio, Aaron Judge, Babe Ruth, and Lou Gehrig as the only players with double-digit home runs in a season against the O’s.
His triple-slash versus Baltimore this year is a ludicrous .465/.531/1.233 in 50 plate appearances and his tOPS+ sits at 275 in 2019 when he faces Baltimore.
In other words, Torres has really gone out of his way in order to bash Orioles pitchers. Just for context, if Torres didn’t play again this year against Baltimore, he would own the best tOPS+ of any Yankee hitter in history with at least 50 PAs against any ballclub in a single season:
Best tOPS+ for a Yankee Hitter vs Any Team in a Single Season
SOURCE: Baseball-Reference
We really don’t know what happened in 1936 between DiMaggio and the St. Louis Browns (his tOPS+ was a bit lower than Torres’ but he had 108 PAs), but fortunately these days we can dive into Torres’ carnage and play the good old “blame game” but with advance stats.
Did Orioles pitchers really deserve this struggle, or is it just the case of a batter who seems to be ascending into the elite?
To answer this, we’re not going to analyze the 20 hits the infielder has connected versus the Orioles this year. Instead, we’ll just focus on the 10 home runs, and check velocity, type, and location of the pitches Torres took yard while we compare it to the results of similar pitches in the Statcast era.
1) Alex Cobb split fastball down and in.
Pitch location:
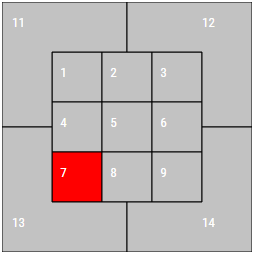
This was the first homer of the season for Torres, and it was no-doubter. It had a 105 mph exit velocity and a projected distance of 400 feet. The pitch was an 87.3 mph split fastball. down and in to the inner part of the zone for a right-handed batter.
Verdict:
The location of this pitch is right in Torres’ wheelhouse, so it’s safe to say this was a mistake. Additionally, splitters in that zone have not borne good results for Cobb historically. Since 2016, that pitch in that specific zone has a .629 xwOBA allowed versus right-handed hitters. When he locates it somewhere else, that numbers goes down to .326.
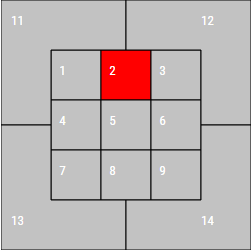
2) Mike Wright fastball up in the zone.
Pitch location:
This was a fastball at 94.6 mph that left the bat with a 101.9 mph exit velocity and was projected for 390 feet.
If you look at Torres’ past home runs, you will see that this is the first (and only) home run he has gotten with a fastball in that specific zone. He has 18 swing-and-misses, four swinging strikeouts, and three hits against those types of pitches. If you add the velocity, this was his first hit versus an upper fastball in the zone with at least 94 mph.
Verdict:
Maybe Wright doesn’t have an elite spin rate to go up there regularly (that pitch was at 2259 rpm), but you can’t blame him for trying this in an 0-2 count. Until that day, he had only allowed three home runs pitching there with his fastball. He also has allowed an xwOBA of .283 with his heater in that zone. The idea and the execution were good on paper, but Torres had other plans. This one is all Torres’ “fault.”
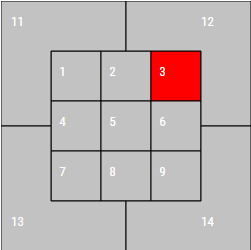
3) David Hess fastball up in the zone.
Pitch location:
This looked a lot like the Wright pitch. A 95-mph heater up in the zone that came back at 104 mph projected at 408 feet. Again, high fastballs have not been Torres’ favorite in the major leagues. This was, according to Baseball Savant, his fifth hit off a fastball in that specific zone and just his second home run. Also, he has swung and missed 21 times at similar pitches and suffered four swinging strikeouts.
Verdict:
Just a day after Torres collected his first home run in the majors against a fastball up in the middle of strike zone, he decided to launch his second career homer against a fastball up and in for strike. Just like Wright, you can’t blame Hess for going up there with good velo and a decent spin rate (2294 rpm on that pitch) in a 3-2 count. Until that day, he had only allowed one homer on his fastball in that zone. Now he has three (Clint Frazier also punished him there later in May). In my book this one was also a Gleyber Torres magic trick.
4) David Hess middle, middle fastball.
Pitch location:
Do we have to explain this?
Torres crushed this fastball at 89.9 mph right at the heart of the plate and sent it home at 108 mph, projected at 427 feet, the fourth-longest home run of his career in the majors.
Verdict:
In 2019, you can’t expect good results if you throw a middle-middle 90-mph fastball with below-average spin rate (that one had 2158 rpm). Just for context, since 2017, fastballs in the heart of the plate with a velocity between 89 and 91 mph and with a spin rate between 2100 and 2200 rpm have a very spooky .445 xwOBA. It’s just not good a pitch. This one is definitely on the pitcher.
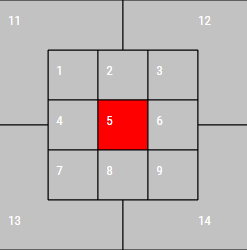
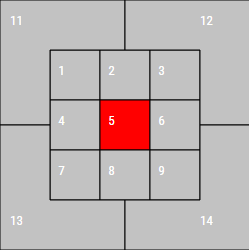
5) Andrew Cashner changeup middle out (but in the zone).
Pitch location:
Destruction. This 84.8-mph changeup located in the middle/out part of the plate was demolished by Torres, who sent it out at 104.9 mph to center field. The shot projected at 432 feet, which ranks as the third-longest home run of the youngster’s career.
Verdict:
Cashner was in a 3-1 count and didn’t want to issue a walk, so he decided to use his best secondary pitch in the zone after he saw what Torres had done against the fastballs of a couple of his teammates. Of course the pitch landed in Torres’ hot zone (middle/in), but at least he failed with the secondary pitch he uses more. Cashner has an acceptable .311 xwOBA with his changeup since 2015 versus right-handed batters, and that was the first homer he had allowed to a righty with that pitch in that specific zone in his major league career.
It was good choice in my book, but the execution was a little bit flawed, and Torres was just too hot. There was more than one responsible on this one.
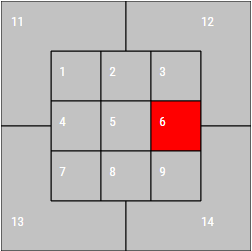
6) David Hess slider down and in (out of the zone).
Pitch location:
This was an 83.3-mph slider slightly out of the zone down and in that ends up in the stands with a 93.5 mph exit velocity, projected at 351 feet.
Verdict:
This was all Torres and Yankee Stadium. In a 3-1 count, Hess couldn’t sell him a fastball again in the zone. Instead he went with his money pitch down and a little bit in, and he suffered the first home run with his slider in that zone in his major league career. It was just a tough break if you consider that those types of hits (balls between 92-94 mph exit velocity and between 27-29 degrees launch angle) have been recorded 957 times in the Statcast era and only 58 of them have turned into a homer (6%).
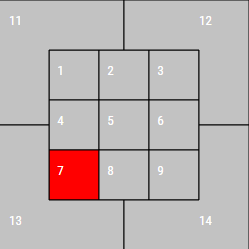
7) Andrew Cashner middle-middle curveball.
Pitch location:
Torres was entering “God Mode” at right about this moment. An 81.2-mph curveball at the heart of the plate was blasted to center field at a 100.2 mph with a projected distance of 415 feet.
Verdict:
I have to give this one to Torres. Cashner was down in the count and just wanted to get back with a curveball in the zone. Yes, maybe it was a pitch too noble for a guy so inspired, but it was a perfectly fine selection to try to come back in the at-bat. That was just the second homer of Torres’ career against a curveball and the very first homer Cashner has allowed on a curveball in a 1-0 count in the majors. Of course, Cashner’s curveball isn’t a great pitch (.332 of xwOBA since 2015), but a man has to work with the tools he has.
8) Mychal Givens slider down and in (in the zone).
Pitch location:
This was an 85.3-mph slider down in the zone to open up the at-bat against a hitter with seven home runs in 2019 versus the Orioles. The result was a hit at 94.2 mph that turned into a 384-foot homer.
Verdict:
Givens has a solid slider with a career .284 xwOBA allowed, but Torres didn’t care. He just tagged that baseball on the very first pitch and gave Givens his first homer allowed on his slider in 2019.
Yes, you could argue that the pitch hung a bit and stayed in the strike zone too long, but this was just the second time Givens has allowed a long ball with a slider in that zone in his major league career.
This is just Gleyber Torres being hotter than the gates of hell. Look no further.
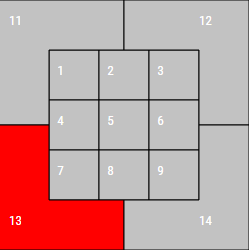
9) Dan Straily slider down and away (in the zone).
Pitch location:
Torres already had three games with multiple home runs against Baltimore when he started this game. Straily threw his money pitch at 85.3 mph in a reasonably good zone, and Torres blasted a 102.4-mph home run projected at 424 feet.
Verdict:
Straily believes in his slider. He owns a .267 xwOBA with that pitch since 2015, so that trust isn’t unreasonable. Then again, before facing Torres in the third inning, he already had allowed two homers against that pitch courtesy of Thairo Estrada and DJ LeMahieu. Despite that, he decided to go in the zone in a 1-2 count against a hitter that was looking for his ninth homer against his team this year. That was not wise. This home run has two fathers in my book, as it wasn’t the pitch location for the count or the hitter.
10) Gabriel Ynoa’s fastball away.
Pitch location:
At this point there is no way Torres gets something in the zone, right? Well, Ynoa decided to test him with a 92.9-mph fastball away at the edge of the strike zone, and Torres returned the favor with an opposite-field home run of 377 feet and at 101.5 mph.
Verdict:
This one is all Gleyber. You could ask why they were throwing strikes to him, but the Orioles were already down 6-2 in the fifth inning. Ynoa threw a fastball to a specific zone where Torres didn’t do real damage in his rookie season. Then again, this Torres seems different. This was his first homer against a fastball in that zone in his major league career and only his second hit.
Final review:
The Baltimore Orioles may have an underwhelming pitching staff right now, but these things that Gleyber Torres did against them were not entirely their fault. At only 21 years old, the Venezuelan infielder seems to be rapidly learning and reducing his holes at the plate while growing more power in different areas of the strike zone.
Yes, Baltimore pitching helped, but more than that it seems like Torres decided to use the Orioles to make a statement to the baseball world.
A statement that is just beginning to unfold.


 Jay Jaffe