Below is an analysis of the prospects in the farm system of the Oakland Athletics. Scouting reports are compiled with information provided by industry sources as well as from our own (both Eric Longenhagen’s and Kiley McDaniel’s) observations. For more information on the 20-80 scouting scale by which all of our prospect content is governed you can click here. For further explanation of the merits and drawbacks of Future Value, read this.
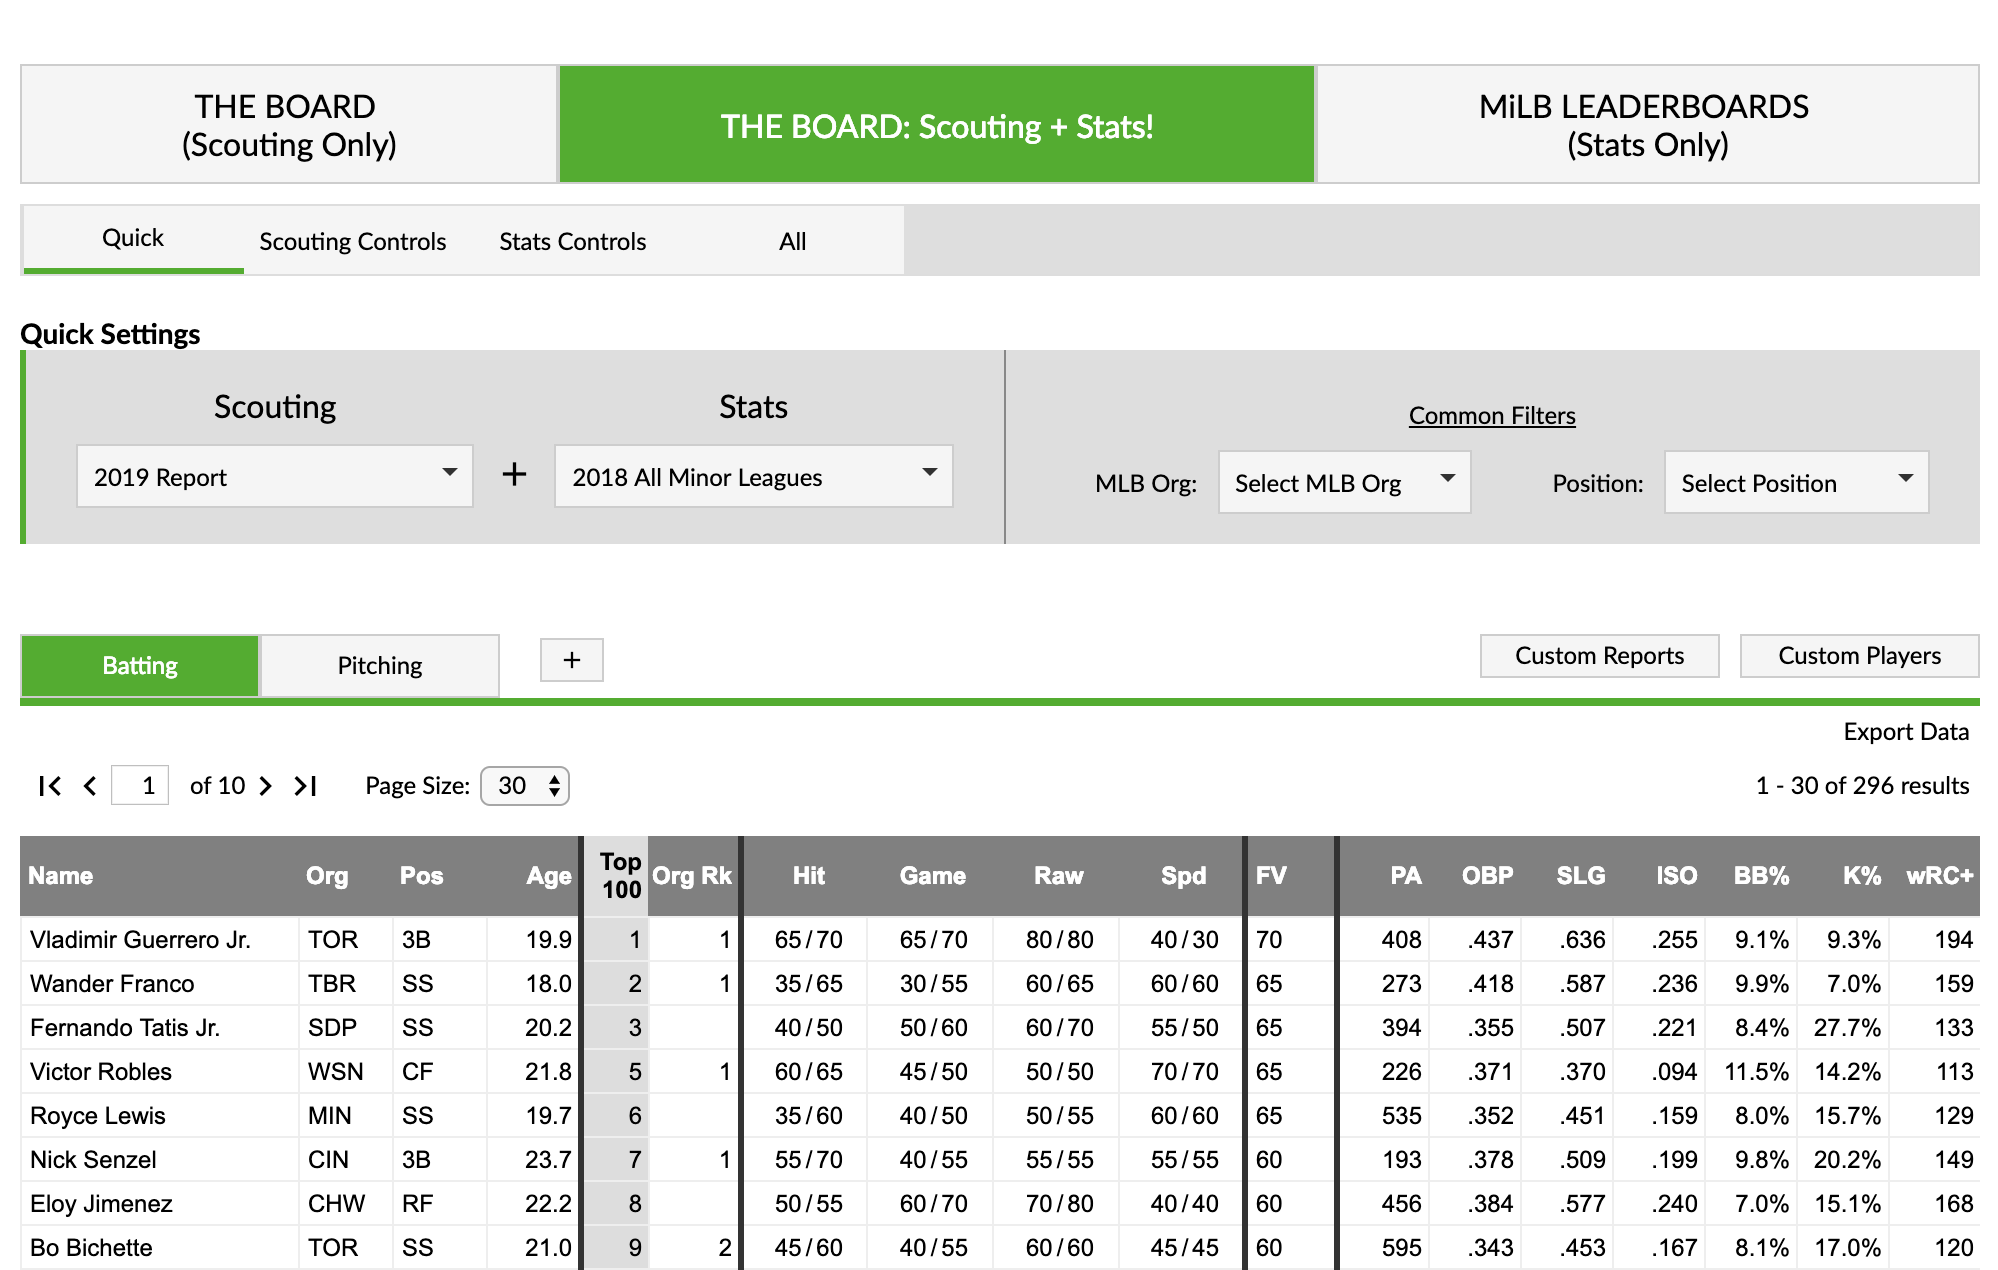
All of the numbered prospects here also appear on The Board, a new feature at the site that offers sortable scouting information for every organization. That can be found here.
Other Prospects of Note
Grouped by type and listed in order of preference within each category.
Kyler Murray
Kyler Murray, CF
Murray is a supreme athlete who was a top-10 draft talent after having not played baseball full-time for several years. He has 70 speed, 55 raw power, and plus bat speed that played surprisingly well in games given the layoff. Last fall, the whole sport-watching world got to see how good of an athlete he is on the football field, and it now looks unlikely that Murray will have a baseball career of any consequence due to his preference for football. We had a 45 FV on Murray before the draft, and he’d be fourth or fifth on this list if he’d have stuck with baseball. But part of what we think about when we FV someone is their trade value, and because it doesn’t seem likely that he returns to baseball (and if he does his chances of success are low due, again, to the layoff), that trade value is akin to other 35 FVs at this point. Murray had a good chance to turn into a 50 FV by midseason if he had shown some progress with pitch selection in a hypothetical 2019 Hi-A campaign.
Exciting Longshot Arms
Eric Marinez, RHP
Wandisson Charles, RHP
Ismael Aquino, RHP
Marinez is a converted third baseman who threw just two innings last year but was pumping mid-90s gas with ease in those two innings (and during instructs), and he has nascent breaking ball feel. He’s a sleeper to develop into a good two-pitch reliever. Charles is a 6-foot-6, 220 pound beast with elite arm strength (95-98, touching at least 99) but zero feel for pitching. He’ll snap off the occasional plus slider in the 86-90 mph range, but he’s relatively undercooked for 22. Aquino is 20 and sits 93-96, but it’s a relief-only delivery.
Possible Role Players
Cobie Vance, UTIL
Tyler Ramirez, LF
Dairon Blanco, CF
Luke Persico, 1B/OF
Vance is an athletic multi-positional player with max-effort 55 bat speed. He made several highlight reel defensive plays in the fall. Ramirez has performed at Double-A for multiple years but we think he’s limited to left field and lacks the bat to profile there. He might hit enough to prove us wrong but we think it’s more likely he becomes a star in NPB or the KBO one day. Blanco is an 80 runner and potential fifth outfielder. Persico has good feel for the zone and some contact skills. He’s not a great fit at third base but has played there and might be a righty bench bat who can play the corner positions.
Young Latin American Talent
Danny Bautista, Jr., OF
Yerdel Vargas, SS
Kevin Richards, CF
George Bell, Jr., OF
Bautista is the most well-rounded of this group but doesn’t have any plus tools and might max out as a bench outfielder. Vargas was once a strong 40 FV on here but hasn’t developed as hoped, in part due to injury. Richards is carpaccio raw but is a 70 runner with a good frame. He might fill out and suddenly have some pop. Bell is similar to Richards but has less speed.
Pitching Inventory
Brady Feigl, RHP
Kyle Finnegan, RHP
James Naile, RHP
Norge Ruiz, RHP
Clark Cota, RHP
Feigl has solid average stuff and some feel, and is likely a long relief type but has some chance to be a backend starter. Finnegan throws in the mid-90s and has an above-average split and could be a middle reliever. Fastball and curveball spin rates are usually correlated with one another but Naile has a low-spinning, sinking heater and a 2800 rpm curveball, so who knows what going on there. He could be a middle reliever. Ruiz is a kitchen sink righty with average stuff, sometimes cruises in the high-80s, works backwards, and is generally a bit of an enigma but could be an inventory multi-inning piece. Cota has a Mark Melancon looking delivery, a fastball/curveball/changeup pupu platter repertoire, and surprising feel that could lead to him being a solid middle reliever.
System Overview
In the Moneyball days, Oakland pressed a market inefficiency in the draft, generally scooping up under-tooled college prospects with higher probabilities of success and lower upside. Over time, they’ve slowly shifted to favoring upside with their biggest amateur expenditures. They took prep righty Trevor Cahill in the second round in 2006 and signed Michael Ynoa, a 16-year-old righty, for a then-record $4.25 million bonus in 2008. One could argue that they should value upside as much as any club, as their small payroll means that a couple of stars emerging at once could open a window that causes them to push their chips in for a multi-year run, whereas one or two stars doesn’t change the Yankees’ team-building calculus as dramatically.
Their 2017 first rounder, sixth overall pick Austin Beck, was arguably the highest risk/upside proposition yet, a prep hitter with the shortest track record of any of his peers, taken at a pick where anything short of a multi-year regular is a failure. Oakland is also tied to top players in the 2019 and 2020 July 2nd classes, in Dominican shortstop Robert Puason and Dominican center fielder Pedro Pineda, respectively. Even in the universe of 15- and 16-year-olds, these two are seen as top-of-the-market talents because of their upside, with more risk and upside than other elite peers according to most scouts. Lefties A.J. Puk and Jesus Luzardo are elite prospects who are close to the big leagues right now, but also came with their own risk factors, as Puk, the sixth overall pick in 2016, was maddeningly inconsistent and appeared headed in the wrong direction as the draft approached before needing Tommy John early last season, while Luzardo is a shorter lefty with a Tommy John surgery as a high schooler. Two of the three pieces in the Sonny Gray haul — Jorge Mateo (consistency, makeup) and James Kaprielian (injuries) — were also seen as upside/risk types and haven’t returned value yet, but 2019 will go a long way to defining that trade. It has been a slow but interesting shift for the club most closely associated with one extreme of the acquisition spectrum to have moved almost as far to the other end.
