Archive for Featured

Brandon Belt, Bunting Fool

Brandon Belt isn’t having a particularly good year. For once, I don’t just mean that his counting numbers are unimpressive; he’s long been a player whose production has outstripped his reputation, as light-slugging first basemen tend to be, and playing in San Francisco’s extreme scoring environment hasn’t helped. From 2012 to 2018, he produced 3.4 WAR per 600 plate appearances, All-Star-level production, despite never really hitting for power or average.

This year, his defense has dragged him down near replacement level (note to the Giants: Belt really shouldn’t play the outfield), but his hitting isn’t up to his usual standards either (a 107 wRC+ that equals last year for his worst full-season rate). Even as Belt’s production wanes, though, he’s actually getting more fun to watch. Why? Well, you never know when he’s going to drop down a bunt, regardless of situation, and bunting for a hit is among the most fun plays in baseball.

When you picture the ideal player to shift against, Brandon Belt is almost a perfect match. He’s left-handed, pulls a ton of his groundballs, and isn’t fast enough that a second baseman in shallow right field might not have time to throw him out on a grounder. When shifting exploded in frequency from 2014 to 2016, Belt was the kind of player who gave teams a reason to do it. In 2015, 54% of the balls he put in play were against a shift, up from 14% in 2013. By 2016, that number climbed to 78%, and it’s bounced around 80% ever since.

At first, Belt had no clear counter. By the end of 2016, he’d bunted only five times in his major league career, going 2-4 with a sacrifice. Teams shifted on him with impunity, and Belt lashed grounders into the shift. His groundball rate decreased, but that’s not a way to punish shifting; it’s merely a way to ignore it. He tried bunting more in 2017, but it was only middlingly effective — he finished 3-6 on the year, and two of those singles were bang-bang plays; he easily could have been 1-6. “Bunt against the shift” is a great idea in theory, but Brandon Belt wasn’t doing it well enough in practice.

Bunting skill isn’t fixed, though, and Belt proved it. His bunts in 2018 were crisper, better-executed, and better-aimed. Take a look at this surgical strike against the Padres:

Freddy Galvis’s kick-stop drives the point home: there’s no reason to bother fielding that ball. For the season, Belt went 4-6 on bunts, and none of the singles even drew a throw. That .667 on-base percentage will do, even if he did embarrass himself in a Bay Area tilt:

Hey, they can’t all be perfect. That’s no different than a grounder into the shift, even if it probably feels worse.

Remember all the way back in the previous paragraph where I said they can’t all be perfect? Well, I lied. Brandon Belt is perfect on bunts this year, and he’s getting increasingly audacious. He’ll bunt in situations where a runner is valuable, sure. Leading off an inning against a decent reliever in a close game? That’s a great time to get a runner on first, and the shift is just asking for it. He doesn’t even hesitate:

That’s too obvious, though. Brandon Belt isn’t about bunting only in situations where a runner on first is most important. He’s in it for the love of the bunt. 1-1 count with two outs and a one-run lead? Sure, Belt will bunt on you:

Are runners on first valuable with two outs? Not at all! Still, Belt’s feeling it. Put away your run expectancy tables and feel the magic. Sometimes you just have to bunt.

How about against an Orioles righty in Camden Yards, a situation where Belt is probably as likely to hit a home run in a single plate appearance as he’ll ever be? Oh yeah, absolutely:

Keep your home runs; Belt will take his not-even-guaranteed base and be happy with it. The Giants hit three long balls in this game. Brandon Crawford, he of the .141 career ISO and 8.7% home run per fly ball rate, hit two home runs. Lefties batting against Oriole righties are in the best possible situation to succeed. Gabriel Ynoa has a 6.45 FIP and 6.75 ERA this year, for crying out loud! Belt doesn’t care, though. He’s bunting.

If you think those last two bunts are questionable, his latest one takes the cake. With the bases empty, a bunt single and a walk are exactly the same. Honestly, a bunt single and a walk are the same almost all the time, but especially with the bases empty. 3-0 count, pitch that might well be called a ball? Bunts away!

Bunts on 3-0 are rare, because they’re ridiculous. 3-0 counts often end in walks, without the hassle of having to connect on a bunt and reach base safely. When Matt Carpenter did it last year, I looked into it and found that he was only the third player to get a fair bunt down with a 3-0 count and the bases empty in the last 10 years. Well, that statistic is now outdated, because Brandon Belt is the fourth.

Think about what bunting on 3-0 entails. A 3-0 count is the best place a hitter could ever find himself. After 3-0 counts this year, major league hitters as a whole walk 60.6% of the time. They get on base 72.8% of the time. On the rare occasion where they don’t walk, they often hit home runs — 5% of non-walk at-bats that hit 3-0 end in a dinger. Literally every offensive stat is improved; batters have posted a .233 ISO (against .180 ISO overall), a .322 BABIP (.296 overall), and a .309 batting average. Brandon Belt doesn’t care. He just wants to bunt.

At this point, I think we can say that Brandon Belt is drunk with bunt power. In a twist, though, that isn’t really new. When Cody Bellinger bunted on 3-0 in 2017, Jeff Sullivan investigated and found a 3-0 bunt attempt from Belt that went foul in May 2017. Brandon Belt wasn’t even a good bunter in 2017! That bunt rolled foul, and it might be good that it did; the Dodgers weren’t particularly over-shifted. He just felt like bunting.

Hittable righties, favorable counts, spots where a runner on first isn’t all that valuable? That’s all irrelevant. Brandon Belt sees an opening, and he attacks. It’s not going to stop teams from shifting against him — he’s grounded into a shift 41 times this year, which means the shift is saving more in grounders than it gives back in bunt singles. Still, if you’re playing against Belt, maybe keep your third baseman close to home until the count gets to two strikes. Honestly, maybe leave him there with two strikes, too. Belt hasn’t attempted a bunt with two strikes yet in his career, but at the rate he’s turning bizarre situations into bunt singles, it’s only a matter of time.


We’ve Reached the Point of “Too Many Homers”

The lingering suspense over whether the Yankees could break the major league record for consecutive games with a home run, which they had tied at 27 on Monday night, lasted until Tuesday night’s sixth pitch from Blue Jays starter Clayton Richard to Yankees leadoff hitter DJ LeMahieu. Boom!

In the brief interval that it took this scribe to tweet about that record — admittedly, while juggling a beer and a scorebook in section 422 of Yankee Stadium — Aaron Judge homered as well. In fact, solo home runs accounted for the Yankees’ entire output in their 4-3 victory, with Gleyber Torres and Edwin Encarnacion joining the party, too. The latter even broke out the parrot against his old team for just the second time since departing in the winter of 2016-17, that while a hawk literally watched his dinger from atop the right field foul pole.

Here’s the Yankees’ new perch after Wednesday, when Didi Gregorius’ second-inning home run off Toronto’s Trent Thornton further extended the streak (LeMahieu added another one in the Yankees’ come-from-behind win as well):

Most Consecutive Games With a Home Run
Rk Team Start End Games
1 Yankees 5/26/2019 6/26/2019* 29
2 Rangers 8/11/2002 9/9/2002 27
3T Yankees 6/1/1941 6/29/1941 25
3T Tigers 5/25/1994 6/19/1994 25
3T Braves 4/18/1998 5/13/1998 25
3T Padres 6/28/2016 7/27/2016 25
3T Cardinals 8/9/2016 9/6/2016 25
8 Dodgers 6/18/1953 7/10/1953 24
9T Athletics 7/2/1996 7/27/1996 23
9T Blue Jays 5/31/2000 6/25/2000 23
9T Braves 6/25/2006 7/24/2006 23
9T Mariners 6/20/2013 7/19/2013 23
9T Dodgers 8/21/2018 9/15/2018 23
SOURCE: Baseball-Reference
* = active

It doesn’t take the eyesight of a hawk to note that 11 of those 13 seasons are from the post-1992 expansion era, which has featured at least one home run per team per game — a level previously topped only in 1987 — in all but five seasons (1993, and every year from 2010-14 except for ’12). Four of those seasons, including three of the top seven, are from the 2016-19 period, which, as I noted on Monday in relation to Justin Verlander’s performance, is the first four-year stretch with at least 1.1 home runs per team per game. This year’s 1.36 per game is the all-time high, 0.1 ahead of the previous high set just two seasons ago, an increase of 8.7%. It’s 0.21 home runs per game (18.8%) higher than last year, and 0.5 homers per game (58.4% higher) than in 2014, the year of the post-1992 low:

If we factor in the ever-increasing strikeout rates, the rise is even sharper. This year’s rate of home runs per batted ball — that is, HR/(AB-SO+SF) — is 5.31%, 0.49 points (10.1%) higher than the previous high in 2017, 0.86 points (19.3%) higher than last year, and 2.08 points (64.2%) higher than 2014.

I’ll get back to that momentarily, but it’s worth noting that when the Yankees’ streak began in late May, only three of the seven players who contributed the most home runs to last year’s record-setting total of 267 were active, namely Aaron Hicks (who tied for second on the team with 27 homers), the sixth-ranked Torres (24), and seventh-ranked Gary Sanchez (18). Since then, the 1-2 punch of Giancarlo Stanton (38) and Judge (27) has returned from lengthy stints on the injured list, and Gregorius (27) has returned from off-season Tommy John surgery. Miguel Andujar (27) is out for the remainder of the season due to surgery to repair a torn labrum, but on June 16, the team traded for Encarnacion, who currently leads the league in homers (24, including three as a Yankee).

All of which is to say that it’s been a mix of A- and B-list players who have not only propelled this particular Yankee streak but have helped the team out-homer all but three other teams, namely the Twins (149), Mariners (145), and Brewers (138):

Home Runs by 2019 Yankees
Player Streak Season
Gary Sanchez 8 23
DJ LeMahieu 8 12
Gleyber Torres 7 19
Luke Voit 4 17
Brett Gardner 4 11
Giovanny Urshela 4 6
Cameron Maybin 4 5
Aaron Hicks 4 5
Edwin Encarnacion 3 3
Clint Frazier 2 11
Didi Gregorius 2 2
Aaron Judge 1 6
Austin Romine 1 2
Giancarlo Stanton 1 1
Mike Tauchman 0 4
Thairo Estrada 0 3
Troy Tulowitzki 0 1
Mike Ford 0 1
Greg Bird 0 1
Kendrys Morales 0 1
Total 53 134
Per Game 1.83 1.68

Such are the Yankees’ power reserves that the acquisition of Encarnacion led to Frazier, who has hit a robust .283/.330/.513 (117 wRC+), being optioned to Triple-A Scranton/Wilkes-Barre, and remaining on the farm even as Stanton went back to the IL with a sprained posterior cruciate ligament in his right knee, the result of a baserunning mishap early in Tuesday night’s game. He’ll miss the upcoming London series against the Red Sox, and will be out for longer than the 10-day minimum. With or without Stanton, who has played just nine games this season, it’s not hard to imagine a more complete Yankees lineup overtaking the Twins in the home run department. But even if they don’t, the rather patchwork lineup has kept them on pace to eclipse last year’s total, which is a hint that the homer situation is simply getting silly.

League-wide, no individual is on pace to challenge Barry Bonds‘ single-season home run record of 73; Christian Yelich, who leads the majors with 29 homers, would finish with 62 if he were to keep hitting them at the same pace over the Brewers’ final 82 games as he has over his first 73 (he’s missed seven games with assorted aches and pains). However, with only five teams past the halfway point in their schedules heading into Thursday (the Mariners have played 84 games, the other four of those teams 82), a total of 56 players had reached the 15 homer plateau, meaning that they were on pace for 30 homers. The league-wide record for such players is 47, set in 2000. Four of the top five totals hail from the 1996-2001 stretch, with the fifth coming in 2017, when 41 players reached it. Similarly, 18 players have reached 20 homers, and are on pace for at least 40. The record for players with 40-homer seasons is 17, set in 1996, and we haven’t seen more than nine players do it in any Statcast-era season; there were nine in 2015, but just three last year. Yelich, Pete Alonso (27 homers through the Mets’ 81 games) and Cody Bellinger (26 homers through the Dodgers’ 82 games, including one on Wednesday) are on pace for at least 50 homers. Only in 1998 and 2001 did more than two players reach that plateau, with four apiece in both of those years, including the single-season record breakers, Mark McGwire and Barry Bonds.

Meanwhile, 14 of the majors’ 30 teams are on pace to set franchise records, with the top four surpassing last year’s Yankees:

Team Home Run Paces and Single-Season Records
Rk Team G HR Pace Record Year Record
1 Twins 79 149 306 225 1963 Y
2 Mariners 84 145 280 264 1997 Y
3 Brewers 80 138 279 231 2007 Y
4 Yankees 80 134 271 267 2018 Y
5 Astros 81 131 262 249 2000 Y
6 Dodgers 82 131 259 235 2018 Y
7 Braves 81 126 252 235 2003 Y
8 Cubs 80 124 251 235 2004 Y
9 Athletics 82 126 249 243 1996 Y
10 Padres 80 121 245 189 2017 Y
11 Diamondbacks 82 120 237 220 2017 Y
12 Angels 81 117 234 236 2000 N
13 Mets 81 117 234 224 2017 Y
14 Rangers 80 113 229 260 2005 N
15 Red Sox 82 115 227 238 2003 N
16 Reds 78 108 224 222 2005 Y
17 Nationals 79 109 224 215 2017 Y
18 Blue Jays 81 107 214 257 2010 N
19 Rockies 80 104 211 239 1997 N
20 Indians 80 104 211 221 2000 N
21 Rays 80 101 205 228 2017 N
22 Phillies 80 100 203 224 2009 N
23 Cardinals 79 95 195 235 2000 N
24 Orioles 80 94 190 257 1996 N
25 White Sox 78 90 187 242 2004 N
26 Pirates 78 79 164 171 1999 N
27 Royals 81 81 162 193 2017 N
28 Giants 79 72 148 235 2001 N
29 Tigers 76 66 141 225 1987 N
30 Marlins 78 60 125 208 2008 N
SOURCE: http://www.baseball-almanac.com/recbooks/rb_hr7.shtml

All but three of the 30 teams are averaging at least one homer per game. Twenty-two teams are on pace for 200 homers, one fewer than in all of baseball prior to the 1994 players’ strike. Only in 2017, when 17 teams reached that plateau, have there even been as many as a dozen teams to do so. Eight teams are on pace for 250 homers, a level reached by just six teams ever prior to this year. The mind reels at these numbers.

While one can point to the general trend of batters making greater efforts to elevate the ball — whether to hit it over shifted infielders or not — it’s more accurate to call that an adaptation to the new reality. The scientific evidence again points to the ball itself as being the driving factor. Earlier this week at The Athletic, Dr. Meredith Wills published a follow-up to last year’s breakthrough article, which itself was a follow-up to MLB’s Home Run Committee report. That committee, led by Dr. Alan Nathan, professor emeritus of physics at the University of Illinois, had found that the recent home run spike was caused by a decrease in the ball’s aerodynamic drag, but found no physical difference in the balls that would explain the change.

Conducting her own measurements using digital calipers and disassembled baseballs, Wills concluded that post-2015 balls’ laces, which were an average of nine percent thicker than balls from the 2010-14 period, were producing less bulging at the seams, yielding a more spherically symmetric ball with less aerodynamic drag — thus allowing them to fly further.

For her latest study, Wills examined 39 balls from this season, which she found differed from the 2015-18 balls and even earlier ones. Most notably, she found “demonstrably lower” seams, only 54.6 percent ± 15.0 percent as high as those on balls from previous seasons. By measuring the coefficient of static friction, she also found that the leather on this year’s balls is relatively smoother, concluding, “the static friction for the 2019 balls is 27.6 percent lower, a statistically significant result demonstrating the leather covers are genuinely smoother.” She measured the bulging of the seams and found, “Not only were the 2019 balls virtually round, what bulging they did show was slightly negative, suggesting the seams might be slightly ‘nestled’ into the leather.” The significantly rounder balls, which have thinner laces than last year’s (more in line with 2000-14 samples) produce even less drag than before, and thus even more carry. Wills noted that both the seam and smoothness issues jibe with anecdotal reports from pitchers about difficulties in gripping this year’s balls, as voiced by players such as Sean Doolittle, Jon Lester, and Noah Syndergaard.

As for commissioner Rob Manfred’s recent suggestion that a better-centered pill (the core of the ball) is a factor in creating less drag, Wills was largely dismissive, writing, “[T]his is the most difficult result to produce without significant manufacturing changes, since existing techniques make it hard to keep the pill from being centered to begin with… Therefore, it seems unlikely that pill-centering would explain a sudden change in drag; at the very least, we would be remiss not to also examine other possible sources.”

All of Wills’ articles on the topic, which are behind a paywall, are worth reading, but it should suffice to say that there’s ample scientific evidence that the ball is carrying this. And how. Check out these numbers, which combine Statcast’s average distance measurements with those from our stat pages:

Fly Balls in the Statcast Era
Year Avg FB Dist FB% HR/FB HR/Gm HR/CON
2015 315 33.8% 11.4% 1.01 3.80%
2016 318 34.6% 12.8% 1.16 4.39%
2017 320 35.5% 13.7% 1.26 4.82%
2018 319 35.4% 12.7% 1.15 4.45%
2019 323 35.7% 15.0% 1.36 5.31%
SOURCE: Baseball Savant

Fly balls are carrying an average of four feet further than last year, and eight feet further than in 2015. Add to that a general increase in fly ball rates and you have a recipe for significantly more homers. Perhaps too many homers. Combine that trend with the aforementioned strikeout trend and lower batting averages — though this year’s .251 is three points higher than last year, it’s in a virtual tie with 2014 for the second-lowest mark of the DH era, which began in 1973 — and the result is a greater percentage of runs being scored via homer than ever before. Here’s an historic look at what Joe Sheehan christened “the Guillen Number” a decade ago at Baseball Prospectus:

For a period of over two decades, from 1994-2014 — two decades that saw record home run rates, PED scandals, expansion, new ballparks galore — the rate of runs scored via homers was remarkably stable around 35%, never deviating more than two points in either direction. It hit 37.3% in 2015, and has climbed at a rate of about two points per year since, to heights previously unseen, and now, both statistically and aesthetically, the situation sticks out like a sore thumb. Ken Rosenthal called it “Bludgeon Ball” earlier this month, and I think the description fits. This is brute force baseball, and while it doesn’t lack for a certain amount of excitement, it’s very lacking in subtlety. When nearly half the league is on pace to set home run records, and the vast majority of teams are set to exceed totals that were once very rare, we’ve gone too far.

It’s time for MLB and Rawlings (which the league bought last year) to fix this. Wills noted that while Manfred has maintained that Rawlings hasn’t changed its manufacturing process or materials “in any meaningful way,” this may be an issue of semantics:

The Home Run Committee found that Rawlings regularly implements production improvements, including changes to the yarn (February 2014), the pill (March 2014, May 2015), the leather (June 2014, February 2017, August 2017) and the drying process (March 2016, February 2018). The Committee described these changes as “largely technical in nature and very unlikely to be in any way related to the (2017) home run increase.” That being the case, things like enhancing leather smoothness or drying baseballs more efficiently might not be considered “meaningful” to manufacturing.

While this may have been a reasonable attitude in the past, such enhancements now appear to have compounded, producing a more aerodynamic ball.

Wills recommended another committee report with the goal of using the information to tighten specifications, improve quality control and “determine further production improvements.” To these eyes — and I know I’m not alone — such improvement would include the restoration of some normalcy. When a player’s 40-homer season, or a team’s mountain of 200 homers, is no longer worthy of celebration, is as common as a garden weed, we’ve lost something. It’s worth searching for how to get that special something back.


Pete Alonso Busted His Slump

In his rookie season, Pete Alonso has already hit 27 home runs, second in baseball behind Christian Yelich. He’s sporting a .281/.371/.634 slash line that’s created a 161 wRC+, which trails only Cody Bellinger, Mike Trout, and Yelich. Even after adjusting for defense, Alonso’s 3.3 WAR is seventh among all position players. With numbers like that, it might be difficult to believe that Alonso has already gone through a prolonged slump with just half the season finished. He has, though. Behold:

Peter Alonso’s Slump
PA HR BB% K% BABIP ISO wRC+
4/28-5/28 109 8 4.6% 31.2% .203 .303 95

Hitting like a slightly below-average player for a month might not be classified as a slump for most, but Alonso has been one of the most productive hitters in the game, and the middle-third of his season thus far is a departure from the rest of his numbers. I could have massaged the numbers to make them slightly worse by going from April 30 to May 25, but the above sample fits neatly as the middle third of Alonso’s season so far. Earlier this season when Alonso was doing very well, Ben Clemens discussed the good and bad aspects of the first baseman’s game, though Ben’s focus was on the good as Alonso was annihilating baseballs at the time:

The two parts of this article are the Pete Alonso experience in a nutshell. The quality of contact isn’t the question — when Alonso hits something, it goes a long way. The question is always going to be whether he can make enough contact to tap into his tremendous raw power. The early returns are promising, but they’re also confusing. Alonso can hit — not that there were many questions about that before — but he’s been a pure manifestation of 80-grade power this year. He’s also struck out 30% of the time, which is, you know, not great.

What we saw from Alonso for much of May was the troublesome aspect of his profile. He was swinging and missing a lot, and not drawing walks. He was hitting home runs, but he produced such a low batting average that his hitting line was below average. We could chalk the BABIP up to bad luck, but his expected numbers from Statcast weren’t much better than what he actually produced. For a first baseman with potential fielding issues, that profile is nearly unplayable on a contending team. Alonso was experiencing his first adjustment from pitchers, and for about a month, he adjusted poorly.

Here are Alonso’s plate discipline numbers from the first few months of the season:

Peter Alonso’s Plate Discipline Changes
O-Swing% Z-Swing% Swing% O-Contact% Z-Contact% Contact% Zone% F-Strike% SwStr%
3/28-4/27 33.0 % 63.4 % 44.8 % 58.8 % 83.1 % 72.1 % 38.8 % 59.6 % 12.5 %
4/28-5/28 38.6 % 69.8 % 49.5 % 68.9 % 83.7 % 76.2 % 35.1 % 56.9 % 11.8 %

Pitchers threw to Alonso more carefully and he responded in the worst way possible: swinging more. His O-Swing% numbers were already below average at the start of the season, and for a month, he got worse. In visual form, here’s Alonso’s swing percentage heatmaps from those periods:

Maybe those maps don’t look completely different, but look at the sections up and in, and low and away. On the left map from April, Alonso isn’t swinging frequently at those pitches, while in May, he offered at the same pitches more often. That he made contact more often on pitches out of the zone might have prevented even more strikeouts, but it also caused weaker contact when Alonso put the ball in play. At the height of his slump, he told Mike Puma of the New York Post about his need to focus on pitch location.

“If I am swinging at junk then they are going to keep throwing it,” he said. “If I am doing my job and swinging at strikes and taking borderline pitches or sitting on good pitchers’ pitches and being locked in on my zone then it is kind of rewarding if I get a quality pitch to hit, whether it be a breaking ball that’s over the middle of the plate or changeup over the middle or fastball.

“For me it doesn’t matter what type of pitch it is, I need something middle, because even if I expand the zone on a fastball then I am still going to get myself out or not get myself in a good count to do damage or help the team.”

Alonso identified and understood his weakness. Making a demonstrable change against the best pitchers in the world can be difficult. Here’s his swing map over roughly the last month:

That area down and in is still the place to throw it if you want to try to get it by Alonso, but he’s pretty clearly swung less in an effort to avoid chasing bad pitches. That up and in area, and the low and away area look even better than they did the first month of the season. The lack of swings on the outside of the zone isn’t an indication it is a safe place to throw there, though, as Cole Hamels recently found out:

This is what Alonso’s plate discipline numbers have looked like over the past month compared to the first two we saw above:

Peter Alonso’s Plate Discipline
O-Swing% Z-Swing% Swing% O-Contact% Z-Contact% Contact% Zone% F-Strike% SwStr%
3/28-4/27 33.0 % 63.4 % 44.8 % 58.8 % 83.1 % 72.1 % 38.8 % 59.6 % 12.5 %
4/28-5/28 38.6 % 69.8 % 49.5 % 68.9 % 83.7 % 76.2 % 35.1 % 56.9 % 11.8 %
5/29-6/25 29.8 % 59.9 % 39.9 % 66.3 % 84.1 % 75.3 % 33.7 % 59.7 % 9.9 %

I highlighted the O-Swing% and Zone% because those stats show the changes pitchers have made against Alonso and how Alonso has responded. Pitchers continue to hope Alonso chases, and are hopeful to avoid the strike zone. The Mets’ slugger initially responded with poor plate discipline but has since responded with fewer swings. As a result, Alonso has been better lately than he was in April when he took the league by storm:

Peter Alonso’s Big Month
PA HR BB% K% BABIP ISO wRC+
3/28-4/27 109 9 11.9% 27.5% .364 .372 182
4/28-5/28 109 8 4.6% 31.2% .203 .303 95
5/29-6/25 114 10 13.2% 17.5% .328 .394 204

Alonso has seen a massive decrease in his strikeout rate as pitchers have opted to avoid the strike zone. It’s possible his passivity could be exploited, but that’s a dangerous game given his ability to punish strikes. For good measure, here’s how his Statcast statistics during the same time periods measure up:

Peter Alonso’s Statcast Ranks
xwOBA MLB Rank (75 PA) xwOBACON MLB Rank (50 BB)
3/28-4/27 .407 18 .530 10
4/28-5/28 .336 107 .464 34
5/29-6/25 .472 2 .539 3
SOURCE: Baseball Savant

Since the end of May, only Mike Trout and Jorge Soler have been hitting the ball with more authority when contact is made. Factoring in walks and strikeouts, only Trout has exceeded Alonso by Statcast’s metrics over that span. Statcast’s numbers align with our own, as Mike Trout has a 227 wRC+ since May 29, with Alonso second to Trout with a 204 mark just besting Christian Yelich. He’s made some of my skepticism at his pace seem foolish, but at least I’m in good company along with a lot of the game’s best pitchers.


It’s Hard to Take the Rays’ Tale of Two Cities Seriously

At first glance, any plan for the Rays to split their home games between the Tampa Bay area and Montreal — the exploration of which was reported last week by ESPN’s Jeff Passan — seems like a cockamamie idea. At second and third glances, too, not only because of the numerous legal and logistical hurdles involved, and the specifics of how those will be overcome so lacking, but because the underlying premise is so flawed.

That aspect was underscored on Tuesday, when Rays principal owner Stuart Sternberg and team presidents Brian Auld and Matt Silverman held a press conference in St. Petersburg to discuss the plan. Let’s cut to the chase:

Anyone who has followed the past quarter-century or so of Major League Baseball ought to be able to see the problem instantly. A franchise that has otherwise proven itself to be highly resourceful and competitive over the past 12 seasons has nonetheless been unable to convince area taxpayers and public officials to fund a new ballpark to replace Tropicana Field, where their lease expires following the 2027 season. Said franchise now hopes not only to build a new ballpark in that region, but also one in Montreal, a city the Expos and MLB abandoned in 2004 after a similar failure. You don’t need an Excel spreadsheet to do the math: convincing two cities to build ballparks for roughly half a season of usage per year is in no way going to be easier than convincing one city to build a ballpark for a full season of use, particularly given that in both cases the public will be expected to bear the lion’s share of the cost while the team profits.

Likewise, convincing two fan bases who have historically shown themselves to be particularly resistant to attending games to make a similar investment while confronting the reality of what amounts to a half-season road trip seems farfetched, to say the least. Let us consider the attendance histories of both cities:

A Tale of Two Cities’ Attendance Woes
Team Seasons Top Half Bottom 3 Last
Montreal Expos (1969-2004) 36 7 16 8
Tampa Bay Rays (1998-2019) 22 1 18 14
SOURCE: Baseball-Reference
During the Expos’ existence, the NL had 12 teams from 1969-92, 14 from 1993-97, and 16 from 1998-2004. During the Rays’ existence, the AL had 14 teams from 1998-2012, and has had 15 since.

The Expos spent their first eight seasons (1969-76) in Jarry Park before moving to Stade Olympique (1977-2004). Aside from 1970, their second season of existence, all of the seasons when they ranked among the NL’s upper half in attendance occurred during the 1977-83 span, when Stade Olympique was new. It helped that their lineup featured three future Hall of Famers (Gary Carter, Andre Dawson, and Tim Raines) for most of that period, but even so, they never ranked higher than third in the league in attendance, and made the postseason only in 1981.* From 1986 onward, only once did they rank higher than 10th (ninth out of 12 teams in 1987), and in their final seven seasons, they were dead last out of 16 teams, cracking one million fans just once.

*One aspect I neglected to note when I first published this was the fact that the team was robbed of a potential postseason berth — and with it, the long-term impact upon attendance and revenue — in 1994, when they had the majors’ best record (74-40) before the strike it. The powerhouse squad was dismantled before play resumed in 1995; attendance dropped by 26% that year, and for the remainder of the Expos’ tenure, only once did they even average half as many fans per game as in 1994.

In their final two seasons, they played a total of 43 games at Estadio Hiram Bithorn in San Juan, Puerto Rico. Despite the park seating just 18,000, they averaged more fans there (14,222 in 2003, 10,334 in ’04), than at Stade Olympique, which in its post-1992 configuration could seat 45,757 (12,081 in 2003, 8,876 in ’04). As Jonah Keri — a Montreal native who coincidentally wrote a book about the Rays — recently wrote of the two-city arrangement, which would seem to be relevant here: “[I]t was still a split-the-baby approach that ultimately left no one happy, and did nothing to help the health of the team in its original city.”

While much of the blame for the latter-day Expos’ attendance woes falls upon owner Jeffrey Loria (who bought the team in 1999) and MLB (which assumed control of the franchise in 2002 while allowing Loria to purchase the Marlins), the underlying reality is that the team could not secure public funding for a new ballpark. Ultimately, the franchise moved to Washington, D.C. following the 2004 season and became the Nationals.

The Rays are now in their 22nd season at Tropicana Field, where only twice have they ranked higher than 10th in the AL in attendance. They ranked seventh out of 14 teams in 1998, their inaugural season, and ninth out of 14 in 2010. They have ranked last or second-to-last in every season since, and, despite winning 90 games last year and being on pace to improve upon that record this year, are currently on their way to their fifth straight season of ranking last among the AL’s 15 teams. The ballpark’s location in downtown St. Petersburg is a major problem, as it’s far from the area’s corporate base and wealthiest suburbs, with significant traffic congestion problems and a lack of sufficient mass transit service. As Keri noted, “Fewer people live within a 30-minute drive of Tropicana Field than any other stadium.”

The Rays have spent more than a decade trying to get another ballpark built in the Tampa-St. Petersburg vicinity, but have been unable to get a plan off the ground. They can’t escape their lease, which has commonly been described as iron-clad. Earlier this week, colleague Sheryl Ring delved into their use agreement’s “exclusive dealings” clause, which forbids the team from even negotiating to play elsewhere. She also noted a similarly restrictive memorandum of understanding that allowed the team only to seek new stadium sites in the two Florida counties that encompass the Tampa-St. Pete area, Pinellas and Hillsborough.

You may recall that at the 2018 Winter Meetings, Sternberg made a show of announcing that a plan to build a glitzy, $900 million new ballpark in the Tampa neighborhood of Ybor City had fallen through, with MLB commissioner Rob Manfred blasting Hillsborogh County’s lack of specifics (read “public funding”). That came near the end of the three-year window granted by the aforementioned MOU, which expired on December 31, 2018.

If the Rays’ attempt to sell a dual-city plan weren’t already underwater enough, St. Petersburg mayor Rick Kriseman handed ownership an anvil last week when he said, “I have no intention of bringing this idea to our city council to consider.” Without that, the Rays can’t get another MOU that would allow them to discuss any proposal with Montreal. In fact, there’s already an inquiry into whether Sternberg violated the lease agreement by discussing his plan with Montreal mogul Stephen Bronfman, son of former Expos owner Charles Bronfman and a prime mover in a group spearheading effort to return baseball to Montreal.

If the Rays were hoping to find high-level civic support elsewhere, Pinellas County Commissioner and 2021 St. Petersburg mayoral candidate Ken Welch said, “I am not open to funding a part-time stadium where our home team is shared with another city.” Meanwhile, former St. Petersburg mayor Bill Foster likened the two-city plan to the team wanting a wife and a mistress. Good times.

“I’m confident it’s an amazing idea,” said Sternberg on Tuesday while denying that this plan was part of “a staged exit,” or “a page out of a playbook to gain leverage.” His main selling point appears to be the fact that both new ballparks would be intimate, open-air venues with 30,000 or fewer seats, which would be less costly than building parks with retractable roofs, as in Arizona, Houston, Miami, Milwaukee, Seattle, and Toronto (the Trop is currently the only dome). According to Neil deMause, who has spent the past two decades chronicling MLB’s stadium shell game in his co-authored book Field of Schemes and a long-running blog of the same name, the “ballpark figure” for such a roof is an additional $200 million to $300 million, though “it depends what kind of roof, and how it affects the overall design.”

Secondarily, Sternberg claimed that such an arrangement will drive plenty of Canadian fans to the region, the kind of vaporous “economic impact” claim so common in stadium proposals. As FloridaPolitics.com’s Noah Pransky wrote:

In short, he suggested losing 41 home games a year — while also paying for a new Rays stadium — would pay for itself, as new Canadian tourists would come down to see their “home” team early in the season.

Back-of-the-napkin math on this suggests St. Pete would need tens — or even hundreds — of thousands of new Canadian tourists to make this work, which seems somewhat ridiculous, given that no Montreal fan is going to want to watch their team in Florida’s June humidity when they could wait three weeks and watch them up north in July.

You could also simply count all the empty seats at Blue Jays’ spring training games in Dunedin to know hundreds of thousands of fans aren’t coming down to watch their home team play baseball in Florida.

DeMause has his own debunking of Tuesday’s presser at Field of Schemes. His conclusion:

Whatever exactly Sternberg has in mind, this is clearly a long, long con, or if nothing else a way to kill time and build momentum for something while waiting out the remaining eight years of his lease. It’s transparently a classic non-threat threat — even Twitter noticed — but the question now becomes what the Rays owner plans to do with any leverage that he’s savvily created, especially considering he faces an opponent in St. Pete Mayor Rick Kriseman who isn’t afraid to sue to enforce the lease’s gag rule on stadium talks.

Of course, it’s always possible this non-threat threat is all Sternberg plans to do, in hopes that it will shake loose more stadium talks in Tampa Bay, given that he’s tried that move (albeit without the Montreal gambit) roughly a billion times before:

DeMause then linked to a tweet promoting this Pronsky article enumerating five separate occasions over the past decade in which Sternberg suggested the Rays’ future in the region was in doubt.

The one unplayed card Sternberg appears to have is that once the Trop is replaced, the team will receive 50% of the revenues that come from redeveloping the current site’s 86-acre footprint — but only if they remain in St. Petersburg. Any escape route from their current lease probably runs through that arrangement, with the Rays either forgoing some percentage of that revenue or paying the city a lump sum. Even if that happens, the obstacles to building two part-time ballparks remain, and it is difficult to imagine the Major League Baseball Players Association signing off on putting its constituents through the extra hassle. Even though players are well compensated relative to most Americans (and Canadians) — admittedly, less well compensated in the case of anyone in a Rays’ uniform — they and their families already lead lives that are bifurcated by the realities of the baseball season. Adding another temporary residence to that arrangement, particularly one in a foreign country, will be a tough sell.

Given all of the above, it hardly seems worth scratching the surface as far as the Montreal aspect of this plan, which surely has its own obstacles. While it would be wonderful to imagine major league baseball returning to the city, which would appear to be at or near the top of any short list of desirable expansion sites, it’s nearly impossible to believe that this is how it will happen. While Bronfman’s group has made progress towards a downtown ballpark, as Keri wrote, “It’s even harder to imagine the city, provincial, or federal governments kicking in a big chunk of the construction cost (which could easily approach or even exceed $1 billion Canadian) for partial seasons.”

Thus, the Rays’ plan makes for an interesting thought experiment, but that’s about it. Don’t hold your breath for this tale of two cities to end happily.


Cavan Biggio Talks Hitting

Cavan Biggio has turned yet another corner this season. One year after blasting 26 home runs in Double-A New Hampshire, the 2016 fifth-round pick has ridden a torrid start at Triple-A Buffalo to a spot in the Toronto Blue Jays lineup. And while he remains an unfinished product, the early returns have been promising. Since debuting on May 24, the son of Hall of Famer Craig Biggio has a 114 wRC+, and he’s gone deep five times.

What type of hitter is the 24-year-old infielder? Part of that answer can found within our Blue Jays Top Prospects writeup, which dropped prior to spring training. A more recent, and much more comprehensive look, went up just one week ago, courtesy of my colleague Devan Fink.

And then there is Biggio’s own take. The young Blue Jays basher broke down his mechanics, as well as his power-and-patience approach, in a wide-ranging conversation that took place last weekend.

———

David Laurila: What is your hitting philosophy?

Cavan Biggio: “My goal is to get a pitch I can square up, and drive. Hitting the ball hard is my No. 1 goal. If I don’t get the pitch I want in the first couple of strikes, I’m going to take. Once I get to two strikes, I’m going to battle and just try to get on base.”

Laurila: Are you basically looking fastball middle?

Biggio: I’d say I’m pretty traditional in trying to hunt the heater. I look for a heater in the middle thirds: middle-in, middle, and middle-away. Those are the parts of the strike zone where I can do the most damage. I’ve also gotten better at recognizing offspeed while looking for the fastball, so if it’s a mistake— if it’s a hung breaking ball — hopefully I’m able to hold off a little bit, put a good swing on it, and barrel it up. So I’m basically trying to hit the heater, but if a guy makes a mistake with a breaking ball, I’m ready for that as well.”

Laurila: What is the key to recognizing an off-speed pitch, particularly one you can handle? Read the rest of this entry »


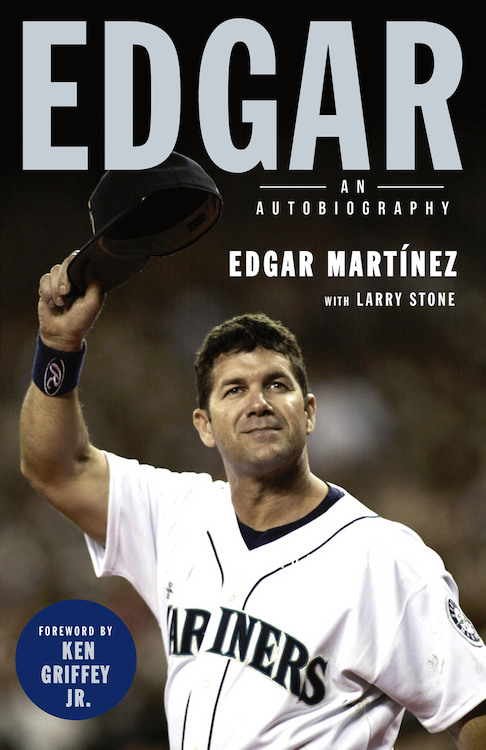
Edgar: An Autobiography is Yet Another Hit for Martinez

Edgar Martinez’s story — at least as recounted in Edgar: An Autobiography, written with veteran Seattle sports scribe Larry Stone and published by Triumph Books earlier this month — reads like something of a fairy tale. Born in New York City in 1963, he moved to Puerto Rico when his parents split, and was raised in the Maguayo neighborhood of Dorado by his maternal grandparents, whom he chose to stay with at age 11, even after his parents reconciled and returned to New York. Though his love for the game was kindled by the heroics of Roberto Clemente in the 1971 World Series, and his development stoked by his relationship with cousin Carmelo Martinez, who spent nine years in the majors (1983-91), he didn’t sign a professional contract until just before his 20th birthday; putting aside $4-an-hour work on an assembly line, he received just a $4,000 bonus from the Mariners. Despite hitting a homerless .173 in his first professional season (1983), and battling an eye condition called strabismus, in which his right eye drifted out of alignment, the Mariners stuck with him.

While Martinez debuted in the majors in 1987, he spent three seasons trying to surmount the Mariners’ internal competition at third base, wound up shuttling back and forth to Triple-A Calgary, and didn’t secure a full-time job until 1990, his age-27 season. Though he won a batting title in 1992, a slew of injuries — shoulder, hamstring, wrist — threatened to derail his career until the Mariners convinced him to become a full-time designated hitter. Once he did, he became one of the AL’s most dominant players; from 1995-2001, he hit .329/.446/.574 for a 162 wRC+ (third in the majors) and 39.9 WAR (seventh, less than one win behind teammate Ken Griffey Jr.).

His heroics not only helped the Mariners reach the playoffs for the first time in 1995 (a year in which he also won his second batting title), but he became a one-man wrecking crew in that year’s Division Series against the Yankees, capping his .571/.667/1.000 performance with a series-winning double in Game 5 that basically saved baseball in Seattle. Remaining with the team for the duration of his career, which lasted through 2004 and included three other postseason appearances, further endeared him to a city that watched Griffey and fellow Mariners Randy Johnson and Alex Rodriguez depart for greener pastures. When he retired, Major League Baseball renamed its annual award for the best designated hitter in his honor. Earlier this year, in his 10th and final cycle of eligibility, he was elected to the Hall of Fame, that after more than tripling his support from just four years earlier.

Martinez’s arc seems so improbable, and yet it’s all true. Over the course of Edgar’s 352 pages, Martinez candidly details the highlights and lowlights of his career, the big decisions, unlikely events, and tactics that helped him surmount so many obstacles. Stone provides testimony from his former managers, coaches, and teammates in the form of sidebars that offer additional perspectives and enhance the narrative.

Read the rest of this entry »


Brandon Woodruff Rebuilt Himself as a Starter

Brandon Woodruff did everything he could for the Brewers in 2017 and 2018. When the rotation needed reinforcements at the end of 2017, he started eight games. When the team needed relief arms in 2018, he filled whatever innings they needed — 10 of his 15 relief appearances went more than an inning, and he contributed four spot starts when the Brewers needed an occasional extra starter. This year, the team needs a starter again, and Woodruff has outdone himself. In 16 starts, he’s gone from solid bullpen arm to the best starter on a playoff team. If the team needs a pitcher to start an elimination game, Woodruff is probably the man for the job.

If I had been asked to make a prediction about Woodruff before the season, I think I would have landed somewhere near our Depth Charts projections — 23 starts, a 4.30 ERA and FIP, and peripherals that looked worse than his 2018 relief turn, when he struck out 26.7% of batters he faced and walked 8%. Pitchers who switch from relieving to starting tend to have worse rate stats across the board, and nothing about Woodruff screamed exception. Instead, he’s improved in essentially every category. He’s striking out 29.6% of the batters he faces, and walking only 6.5%. His FIP is 0.23 lower than it was last year. Heck, he’s gained fastball velocity, something you’re not supposed to do when throwing more pitches per game.

Luckily for the purposes of our analysis, however, he’s also made some changes in approach that we can pore over. If all there was to Woodruff’s improvement was a tick on his fastball, there wouldn’t be much to say. But that’s not how Brandon Woodruff’s season has gone. He has overhauled his arsenal and approach in ways that look well thought-out and sustainable to me. Read the rest of this entry »


The ZiPS (Almost) Midseason Update – National League

Welcome to the more interesting league. Back in 2015, ZiPS saw two very different leagues — an American League in which most of the teams were competitive, and a bifurcated National League that featured a stronger line between the haves and the have-nots than 1780s France. By mid-September of that year, just one team in the the American League (the Oakland A’s) was positioned to finish with a sub-.500 record; only two were on track to reach the 90-win mark. As for the Senior Circuit, ZiPS thought that six of baseball’s best eight teams resided there, as well as five of the six worst.

In four years, these positions have done a Freaky Friday switcheroo. The AL is now home to six of the eight teams with the best projected rosters and six of the eight with the worst, with only three AL West teams (the A’s, Rangers, and Mariners, in that order) representing the middle class. The average NL trailer is 9 1/2 games back in the division and 3 1/2 back of a wild card berth compared to the AL’s 14 games and 8 1/2 games respectively.

So how do the ZiPS in-season projections work? For the Big, Official projections, I use the full ZiPS model rather than the comparatively simple in-season version in an effort to get the best estimates possible. Each player receives a percentile projection, with ZiPS randomly selecting from each player’s distribution to get a range of the expected roster strength for each individual team. Then each team is projected against every other team in their schedule a million times for the rest of the year. All this has the benefit of getting more accurate tails, as opposed to the binomial distribution you get when you’re working with an assumed roster strength; one of the most important things about ZiPS is that on all layers, it’s designed to be skeptical about its own accuracy.

ZiPS Playoff Matrix – 6/21
To Win 10th 20th 30th 40th 50th 60th 70th 80th 90th
NL East 88.6 90.2 91.4 92.5 93.6 94.6 95.8 97.2 99.0
NL Central 86.3 87.7 88.7 89.7 90.5 91.4 92.5 93.6 95.3
NL West 97.7 99.7 101.1 102.4 103.5 104.6 105.8 107.2 109.2
NL Wild Card 1 85.4 86.4 87.2 87.9 88.5 89.2 89.9 90.7 91.9
NL Wild Card 2 83.3 84.2 84.9 85.5 86.0 86.6 87.2 87.9 88.8

According to projections, the eventual NL Central winner will be under 95.3 wins 90% of time, assuming a strange world in which we can play out the final three months of the season a million times. That barely gets you the home field-advantaged wild card spot in the American League half the time. If the National League doesn’t have an exciting trade deadline, maybe we should start to think that something’s up, given that mid-to-upper 80s in wins makes you a serious wild card contender. Only two teams in the league ought to actually be sure about throwing in the towel right now: the Marlins and the Giants.

ZiPS Mean Projected Standings – NL East – 6/24
Team W L GB PCT Div % WC % Playoff % WS Win % No. 1 Pick Avg Draft Pos
Atlanta Braves 93 69 — .574 86.2% 10.7% 96.9% 8.4% 0.0% 24.5
Washington Nationals 86 76 7 .531 11.0% 45.8% 56.8% 1.9% 0.0% 19.1
Philadelphia Phillies 81 81 12 .500 1.5% 14.2% 15.7% 0.4% 0.0% 14.8
New York Mets 81 81 12 .500 1.3% 12.9% 14.3% 0.3% 0.0% 14.5
Miami Marlins 59 103 34 .364 0.0% 0.0% 0.0% 0.0% 7.1% 3.0

Back in April, this race projected to be the second most exciting in baseball after the NL Central, with four teams projected between 87 and 93 wins and the fifth projected to, well, complete the 2019 season without folding (I’ll leave the identities of these teams for you to figure out). Instead, with a 16-5 record in June, the Atlanta Braves have put some real daylight between themselves and their rivals. Dallas Keuchel is not a superstar, but he also represents the biggest addition to an NL East team so far, one which addressed a significant team worry. With the deepest farm system in the division and a likely willingness to add salary for the right player, the “intangible” projections may be even better than what my computer spits out.

The Nationals have shown a pulse in June, enough to get them within a couple games of second place in the division. ZiPS still sees Washington as the team with the strongest overall 2019 roster in the East, with an 11-point edge in winning percentage over the Braves in a theoretical world in which the teams played identical schedules. But that margin is smaller than it was at the start of the season and it’s simply preferable to be the team with the 8 1/2 game advantage than the one that’s slightly better on paper. Start the grandmaster out without a couple of pawns, and a highly-skilled amateur chess player will probably win. If anything, it makes the decision to make trades in July a little trickier; it’s easier psychologically to shop Anthony Rendon or Max Scherzer if you’re not competitive. And with a weak farm system, the Nats don’t have a lot of ammo. Perhaps they’d be well-served to stop giving away interesting relievers.

I’m Just Saying…
Player WAR
Austin Adams 0.5
All Nationals Relievers 0.1

As of this morning, the Mets were closer to the Marlins than the Braves in the division. The team made significant improvements in the offseason, but those moves also had the feeling of being half-measures, with team ownership still not wanting to spend money at the level you would expect from a team in a massive market (even if they do play second fiddle). The rotation’s 4.64 ERA left pitching coach Dave Eiland as the team’s designated scapegoat for its failings, but the real culprit here is the team defense. At -55 runs (if you believe the numbers from Baseball Info Solutions), a league-average defense would have the Mets at a 3.92 ERA, fourth in the National League. Even UZR’s less depressing estimates would place the Mets with a 4.27 ERA, better than the NL’s current 4.37 average. I’m sure threatening two or three more journalists will fix that right up.

I’m not going to fault the Phillies for Bryce Harper’s rather pedestrian offense. But I will fault them for their apparent disinterest in either Dallas Keuchel or Craig Kimbrel. While only one team could sign each player, none of the usual sources buzzing around the Phillies suggested that they ever had more serious interest than their public demeanor reflected. Losing Andrew McCutchen — even a post-star McCutchen — was a blow the team is ill-positioned to handle and one it can’t wait to address.

Caleb Smith is likely a real find, certainly more of one than I envisioned when the Marlins picked him up from the Yankees in 2017. Garrett Cooper is likely the only interesting player on the team’s offense (he’s 28, but a long way from free agency), which makes one ask the very real question of how Miami managed to get more for Mike King than for Chris Paddack, Josh Naylor, and Luis Castillo combined. Perhaps the Marlins tanking is somehow less depressing than the Marlins trying to contend?

ZiPS Mean Projected Standings – NL Central – 6/24
Team W L GB PCT Div % WC % Playoff % WS Win % No. 1 Pick Avg Draft Pos
Chicago Cubs 89 73 — .549 56.2% 24.5% 80.8% 4.6% 0.0% 21.4
Milwaukee Brewers 87 75 2 .537 31.5% 32.9% 64.4% 2.8% 0.0% 19.7
St. Louis Cardinals 83 79 6 .512 10.7% 22.6% 33.4% 1.1% 0.0% 16.9
Cincinnati Reds 78 84 11 .481 1.5% 5.5% 7.0% 0.2% 0.0% 12.8
Pittsburgh Pirates 74 88 15 .457 0.1% 0.5% 0.6% 0.0% 0.0% 9.2

The Central feels a lot like the division that nobody wants to win. Four of the five teams have held first place for multiple consecutive days, and not just at the start of the season when you have a bunch of 2-0 and 1-1 records floating around the league. While nobody has achieved any permanent daylight, I still think the Cubs have the best chance of doing so. Kimbrel may not be at his peak, but his signing and the theoretical return of Brandon Morrow would address what has been the team’s largest hole.

While the Brewers aren’t a depressing franchise, their use of Keston Hiura and Travis Shaw is a real head-scratcher. At the start of the season, I felt the team’s best use of Hiura would be to start him in the minors and have him bash his way into the majors, allowing them not to worry about having to make a difficult decision. The first part of that plan seemed to work out, but even with Shaw struggling and Hiura slugging .531, the Brewers haven’t been able to make the hard choice to turn Shaw into a reserve and make the team better right now. Yes, Hiura’s strikeout-to-walk ratio in the majors didn’t exactly scream Joey Votto, but he’s actually hitting the ball once in a while. ZiPS estimates that starting Shaw instead of Hiura over the rest of the season costs the Brewers about a tenth of a playoff appearance. That’s not negligible.

Who would’ve thought the bullpen would be the best part of the Cardinals? Yes, Paul Goldschmidt should be hitting better and Matt Carpenter should be hitting better and most of the rotation should be pitching better, but there’s no such thing as a Should NL Central winner. The Cards are a hard team to upgrade, simply because there aren’t many obvious places to give out pink slips. ZiPS is down to believing the Cards are a .510 team.

The Reds are a better team than their record, but the math remains daunting. How damaging was the team’s 1-8 start? They’ve gone 35-32 since, have a 43-33 Pythagorean record overall, and their 7.0% projected playoff chance is still behind their preseason projection of 11.5%. But at least they’re actually putting their best possible lineup on the field, with Jesse Winker, Nick Senzel, and Yasiel Puig as a fairly stable outfield. It would have been nice if they had just committed to this group from the start rather than trying to get Matt Kemp at-bats and seeing more in Scott Schebler than a fourth outfielder. Derek Dietrich’s offense has been encouraging, but it’s perhaps his defense that’s been the bigger surprise. He could always hit, but his defensive numbers at second are much more adequate than they were in his Marlins days. Small sample size, of course.

As for Pittsburgh, I don’t think they have the arms to peek back over the .500 mark for any extended period of time this year. With a healthy Jameson Taillon, and Chris Archer looking more like the Cy Young threat he once was, the division’s middle-heavy enough that the Pirates could be a contender. I don’t think they are, though.

ZiPS Mean Projected Standings – NL West – 6/24
Team W L GB PCT Div % WC % Playoff % WS Win % No. 1 Pick Avg Draft Pos
Los Angeles Dodgers 104 58 — .642 100.0% 0.0% 100.0% 19.6% 0.0% 29.0
Arizona Diamondbacks 80 82 24 .494 0.0% 12.3% 12.3% 0.3% 0.0% 14.2
Colorado Rockies 80 82 24 .494 0.0% 11.7% 11.7% 0.2% 0.0% 14.1
San Diego Padres 78 84 26 .481 0.0% 6.2% 6.2% 0.1% 0.0% 12.7
San Francisco Giants 69 93 35 .426 0.0% 0.0% 0.0% 0.0% 0.0% 6.4

It’s only really a 100.0% chance to win the NL West because of rounding, but it’s hard to envision a scenario in which the Dodgers blow a 13-game lead. Maybe, if there was another top team in the division that was simply underperforming, you could squint your way to seeing some type of apocalyptic scenario in which a second place team goes 55-25 in the second-half while Cody Bellinger and Hyun-Jin Ryu are captured by brigands in a forest. You can’t even “But ’69 Mets!” here — that team maxed out at a ten-game deficit. Okay, the Bucky Dent Yankees, but who in the division has a Goose Gossage or a Reggie Jackson?

Suffice it to say, Goose Gossage might actually upgrade the Colorado Rockies bullpen. I don’t mean 1978 Gossage — I mean Gossage now. In truth, Colorado’s bullpen hasn’t really been that mad, but they tend to fail in the most spectacular ways possible, as seen in their three straight walk-off losses against the Dodgers. In typical Colorado fashion, the team ranks 22nd in position player WAR and 22nd in wRC+ and I’m not sure anyone in the front office realizes this.

The Padres are obviously not as good a team as the Dodgers, but they’re the most fascinating team to watch, simply because of the young talent that will inevitably reach the majors in the next few years. I remain at a loss as to why they’ve been so conservative with Luis Urias, who is likely to be part of the best possible lineup right now (and I say this as someone who is a fan of Ian Kinsler as a player). It’s hard to blame any fiduciary shenanigans given that the team pointedly decided to not play those sorts of games with Paddack or Fernando Tatis Jr. The team is obviously pleased to be wild card-relevant, though I don’t think they’ll do anything to jeopardize the real show, which should start as soon as next year.

The Diamondbacks continues to accidentally contend, but I still think they’re more likely to trade off the reasons for that contention rather than make any additions. I still don’t believe Zack Greinke finishes his contract in Arizona, and I wouldn’t be surprised to see Robbie Ray go. I think either Greinke or Ray are potentially more impactful pickups than Madison Bumgarner would be and there’s an actual Bumgarner market. It’s hard to see the Diamondbacks as a good enough team to be able to turn down solid offers should they materialize.

Every year, there’s a team that’s rebuilding that doesn’t quite realize it. Right now, that’s the San Francisco Giants. Other teams have come back from deeper pits than 33-43, but most of those other teams were more talented. The Giants have already played 13 different players in the outfield and just claimed Joey Rickard on waivers. By comparison, the Yankees have had most of their desired starting lineup on the IL but have only used nine.


Justin Verlander Is Dominating Despite All of the Dingers

It’s been a weird season thus far for Justin Verlander. On the one hand, the 36-year-old righty has enjoyed dominant stretches and generally pitched well enough to put himself in the conversation for another All-Star appearance (perhaps even a start) and that elusive second Cy Young Award, all while advancing his case for eventual election to the Hall of Fame. On the other hand, he’s struggling to keep the ball in the park like never before — but then, that describes most pitchers in a year of record-setting home run rates. The combination has created some very unusual, extreme statistics

On Sunday, Verlander threw seven strong innings against the Yankees in the Bronx, allowing just four hits, two walks, and three runs while striking out nine. The runs all came via a three-run homer by DJ LeMahieu, but the blast was of trivial importance, hit at a time when the Astros owned a commanding 9-0 lead. The trivia was shared by both teams. It was the 26th straight game in which the Yankees homered, a franchise record and one short of the major league record, held by the 2002 Rangers. It was also the first time since April 15, 2017 — back when he was still a Tiger — that Verlander had surrendered a three-run homer.

I’ll get back to the home runs momentarily. The Astros’ 9-4 win gave Verlander his 10th victory of the season and the 214th of his career; he’s second among active pitchers behind only CC Sabathia, who claimed his 250th win last week. His 142 strikeouts trail only teammate Gerrit Cole for the league lead, while his 2.67 ERA is good for fourth. However, because he’s served up 21 homers in 114.2 innings — a career-high 1.65 per nine — his FIP is a less-impressive 3.77, and his ERA-FIP differential of -1.10 ranks third in the AL. Depending upon one’s choice of pitching value metrics, he either looks like a Cy hopeful (second in bWAR at 3.8) or just a solid All-Star candidate (tied for ninth in fWAR at 2.5). Read the rest of this entry »


The Legal Ramifications of the Two-City Rays

By now, you’re undoubtedly aware that Major League Baseball gave the Tampa Bay Rays the go-ahead to explore playing a divided home schedule between St. Petersburg and Montreal. The plan is certainly ambitious, if nothing else:

Though no details of the overall plan are set, the basic framework is for the Rays to spend the first 2½ months or so of the season, playing about 35 of their 81 home games, in Tampa Bay, then move north by early June to finish the schedule in Montreal.

The Rays can pay the players for the inconvenience, similar to the stipends they get for taking international trips, and as part of a compensation package that also could offset other issues such as taxes, currency exchange (though they’re paid in U.S. dollars) and family travel costs.

But practical issues aside, the idea also faces a series of legal hurdles. First, the team’s use agreement with the city of St. Petersburg simply doesn’t allow it. That’s right – the Rays, unlike most teams, aren’t technically a tenant. They’re legally a licensee, as Eric Macramalla explains for Forbes:

The Rays never signed a traditional lease. Rather, they signed a Use Agreement, which, to say the least, is an onerous agreement that strongly favors St. Petersburg. A Use Agreement is in stark contrast to a traditional lease, where a tenant typically owes the landlord what’s left on that lease after breaking it.

As for sharing games with Montreal, the Use Agreement at Section 2.04 expressly provides that the Rays must “play all its homes games” at Tropicana Field unless St. Petersburg consents to the Rays playing some of its game elsewhere.

Read the rest of this entry »