Archive for Featured

The 2019 Hitter Projections: Where Did We Go Wrong?

If the other projectionators are anything like me, the projections going awry, afoul, or askew is always something in the back of their minds. Ideally, one should make projections, let the rubber hit the road, and then worry about what actually happened in the fall post-mortems. As much as I’d like to do that, when ZiPS makes an aggressive projection in one direction or the other, especially one that departs from the consensus of the other projection systems, I can’t help but look over my shoulder. Yesterday, I looked at pitchers for whom ZiPS missed the mark. Today, I consider the other side.

Among hitters, no projection has haunted my dreams as much as Juan Soto’s. Yes, Juan Soto was a superstar in 2018. Yes, he was just 19 when he destroyed the National League. Yes, everybody loves him as a player, not just the projection systems. However, in this case, ZiPS went out on a bit of a limb with Soto. Rather than the typical curmudgeonly regressing-toward-the-mean, ZiPS saw Soto playing even better, projecting a ninth-place finish in WAR among position players. Soto hasn’t been a disappointment, and ZiPS hasn’t been totally wrong, but the modest 23-point differential between ZiPS and reality grows larger once you consider that ZiPS missed low on the level of offense around the league.

ZiPS vs. Consensus, 2019 Hitters
Name Consensus OPS ZiPS OPS Diff
Juan Soto .906 .959 .053
Cody Bellinger .837 .889 .052
Joey Gallo .843 .889 .046
Christian Walker .721 .764 .043
Eloy Jimenez .820 .863 .043
Adalberto Mondesi .717 .758 .041
Eduardo Escobar .760 .798 .038
J.T. Realmuto .802 .838 .036
David Dahl .807 .840 .033
Ben Gamel .712 .744 .032
Grayson Greiner .648 .602 -.046
Mitch Garver .723 .677 -.046
Tyler Flowers .740 .694 -.046
Elias Diaz .727 .682 -.045
Jorge Alfaro .658 .614 -.044
Lourdes Gurriel Jr. .722 .678 -.044
Albert Pujols .704 .660 -.044
Jose Abreu .837 .795 -.042
Bryan Reynolds .686 .645 -.041
Robinson Cano .802 .763 -.039

It’s interesting to see where ZiPS differed the most from the other three projection systems used here. Do note that the “Consensus OPS” will vary slightly from what you see in the following tables, as ZiPS is not included in these consensus stats. ZiPS in 2019 tended to like a lot of the mid-20s “interesting” power prospects while simultaneously liking middling young catchers less than the other systems. That’s something that hadn’t come up in previous seasons, so I’m curious to see whether it continues and what it means. The data used by ZiPS versus that used by the other systems means it isn’t always going to be an apples-to-grenades comparison.

As with the pitchers, ZiPS is very close in accuracy to the consensus projections, but slightly behind (again, as I expect it to be). For the bias-adjusted projections, the consensus has an RMSE (root-mean-square error) of 0.1072 in OPS compared to ZiPS’ .1076. If these were the end-of-year results, we’d all be very depressed, but half-year stats are quite volatile!

Worst 2019 Hitting Projections (Too Pessimistic)
Name Consensus OPS Actual OPS Diff
Fernando Tatis Jr. .703 1.026 .323
Lourdes Gurriel Jr. .711 1.009 .298
Scott Kingery .661 .959 .298
Cody Bellinger .850 1.137 .287
Bryan Reynolds .676 .956 .280
Hunter Dozier .676 .952 .276
Hunter Pence .701 .962 .262
Mitch Garver .712 .972 .261
Joey Gallo .855 1.109 .254
Eric Sogard .635 .884 .249
James McCann .646 .890 .245
Josh Bell .791 1.035 .244
Christian Yelich .897 1.139 .243
Peter Alonso .759 .999 .240
Kevin Newman .652 .855 .204
Oscar Mercado .636 .837 .201
Pedro Severino .629 .829 .201
Howie Kendrick .749 .947 .198
Pablo Sandoval .679 .877 .198
Carson Kelly .685 .881 .197

Everyone liked Fernando Tatis Jr. over the long haul prior to his debut, but it was an open question whether or not everything would click in 2019. Everything has clicked in 2019. It’s easy to forget that Tatis only played a little more than half of a season in Double-A in 2018, and missed significant time due to a broken thumb. That he has succeeded does not mean it was a certainty coming into the season, so I’ll live with being wrong here. In a way, Tatis’ explosion reminds me of Hanley Ramirez’s back in the day. Not that Tatis and Hanley are or were comparable players, but the magnitude of their respective rookie explosions is similar.

What will haunt me is the Gurriel projection. The consensus was wrong on Gurriel, but if you scroll up to the first chart, ZiPS was really, really wrong on Gurriel. What makes it even more maddening is that I’m still not sure why. Gurriel’s launch angle is up and he’s hitting more barrels, but he’s also exhibiting this weird combination of swinging at fewer pitches and making even less contact than in 2018. ZiPS is coming around on Gurriel, and his rest-of-season projection now stands a stunning 73 points of OPS above his preseason projection. If we used the full-on ZiPS rather than the simpler in-season model that increase would be 94 points! The computer understands the improvement better than I do apparently.

ZiPS liked Joey Gallo more than the consensus, but still undershot Gallo’s OPS (so far) by more than 100 points. I can at least get my head around Gallo’s improvement. While a .391 BABIP is unlikely to be sustainable, there’s been a real change in his approach at the plate. In 2018, Gallo swung at 32.2% of pitches outside the strike zone; that ranked him 152nd in baseball if we use 300 plate appearances as our cutoff. In a single year, he’s cut off nearly a third of that, with his 22.5% ranking 21st-best among players with 150 plate appearances. While he’s also swinging at fewer pitches in the strike zone, the dropoff isn’t to the same degree. Even if his BABIP drops precipitously from .391, it may not drop down to previous levels. Gallo had a .250 BABIP in 2017 and a .249 BABIP in 2018, but the ZiPS model for BABIP that uses hit ball data thinks he “ought to” have put up a .301 BABIP over that period. That’s the largest deviation among hitters, suggesting that there was some hidden upside in there. ZiPS only projected a .273 BABIP — the longer a player underperforms, the more likely ZiPS is to believe reality rather than the estimate — but now thinks he’s somewhere around .300 again.

Baseball’s having a low-ball moment. Using Statcast’s strike zone, the rate at which home runs are being hit on low pitches is up 62% from 2018. 409 balls below the strike zone were hit for homers last year; this year we’re already at 347! Does this have an effect on the projections? Looking at the projections as a whole, there’s a real relationship between a hitter’s low-ball hitting ability and him beating the 2019 projections. This is something to come back to in the season’s post-mortem. The number of golf ball homers being hit would make a 1970s hitting coach cringe!
Worst 2019 Hitting Projections (Too Optimistic)
Name Consensus OPS Actual OPS Diff
Jose Ramirez .902 .634 -.268
Travis Shaw .813 .568 -.245
Kendrys Morales .760 .566 -.194
Danny Jansen .741 .548 -.193
Carlos Gonzalez .756 .572 -.184
Jesus Aguilar .810 .631 -.179
Yonder Alonso .752 .576 -.176
Daniel Descalso .726 .554 -.172
Eduardo Nunez .725 .572 -.153
Chris Davis .685 .533 -.152
John Hicks .685 .535 -.150
Juan Lagares .654 .504 -.150
Starlin Castro .717 .571 -.146
Matt Carpenter .851 .706 -.145
Austin Hedges .701 .558 -.143
Mike Zunino .699 .557 -.142
Paul Goldschmidt .881 .741 -.140
Robinson Cano .792 .653 -.139
Jeimer Candelario .731 .595 -.136
Rougned Odor .763 .629 -.134

Oh, J-Ram, did you anger a sorcerer? Unless I missed something, if Ramirez’s season ends up with this OPS, it will be the least accurate projection for a batter coming off a five-WAR season in ZiPS history. Now, ZiPS only goes back to the early years of the millennium, but still, that’s not a feather in ZiPS’ cap.

Naturally, coming off a drug suspension, there are eyebrows being raised at Robinson Canó’s disappointing season in New York. It’s tempting to take the bait and worm out of a bad projection, but with nearly 15 years of drug testing, ZiPS still can’t find a pattern of group over-performance or underperformance based on the timing of a drug suspension. I think the more boring story — that a 36-year-old middle infielder is declining rapidly — is the more accurate one.

Danny Jansen fits in the category of “wrong, but in a very weird way.” ZiPS was relatively negative on Jansen coming into the season, projecting a .243/.332/.385 line, a full 61 points of OPS below what the fans estimated. Coming off a .247/.342/.432 debut and a strong performance in Triple-A, people expected more. Readers north of the border let me have it (though politely, because Canada). ZiPS turned out to be wrong, but in the opposite direction: Jansen now at .196/.278/.314 for the Jays.


What the Heck Is up With Wil Myers?

I’m here today to tell you about a player who has been hitting the ball tremendously hard of late. That’s nothing new — it’s a common genre of FanGraphs article. You know the deal, because I’ve written plenty of them this year already. Josh Bell is great now, Pete Alonso only hits lasers, Niko Goodrum can apparently hit, etcetera. Inevitably, these stories catch players near a performance peak. That’s just the nature of the beast; when you look for noteworthy and exceptional performances to write about, there’s very likely some luck involved, even if the underlying statistics look good.

The ideal form of this type of article finds something that’s truly different about the player, something other than mere batted ball luck. Josh Bell’s simplified stance, for example, really is different. Even so, baseball is a game with a lot of inherent luck to it, and if you single someone out for doing tremendously well, there was probably some luck involved. Today, though, we’re going to subvert the genre. Today, let’s look at a player who is, per the trope, hitting the ball harder than ever and turning fly balls into home runs at the highest rate of his career. There’s a twist, though: Wil Myers is doing all that, but he’s also having his worst season in five years. That sounds like something worth writing about.

Myers has always had power. He’s had a 30 home run season and a 28 home run season despite playing in a home park that suppresses home runs. Despite that, 2019 is seeing the highest HR/FB% of his career. (All stats are through Tuesday’s action.) His exit velocity on line drives and fly balls is in the 97th percentile of hitters with 50 air balls this year, tied with teammate Franmil Reyes. He doesn’t fare quite as well in terms of barrels per ball hit in the air, as he’s been a bit inconsistent, but he’s still in the top 20% of baseball. There are no two ways about it; Wil Myers is hitting baseballs as hard as he ever has.

So, what have the offensive rewards of Myers’ bruising new power been? He’s batting .218/.314/.399, good for a 91 wRC+. His batting average is the lowest of his career, and his OBP and slugging percentage are higher only than his disastrous 2014 Rays campaign. That batting average is especially jarring when you consider that it’s not BABIP-driven; he’s batting .316 on balls in play, higher than his career average and significantly higher than his Depth Charts projections. High BABIP and low batting average? Strikeouts have to be the culprit here, and my goodness, Myers has struck out a lot this year — 35.6%, to be exact. Read the rest of this entry »


Let’s Find Some Clayton Kershaws (To Scale)

Last week, I saw Dodgers lefty Clayton Kershaw in person for the first time. While he’s no longer the dominant force of nature he was at his peak — Kershaw’s fastball now sits 89-91, rather than sitting 92-94 and touching 97 as it did 2015-2017 — he’s still a very effective big league starter, on pace for a 4 WAR season, and the owner of a 3.51 xFIP across just under 100 innings pitched ahead of the All-Star break.

This is far from the first piece on this website to chronicle what makes Kershaw great as, over the last decade, he’s improved his command, and altered his pitch mix and pitching approach. What I suggest today is that part of his continued success also has to do with, simply, how he releases the baseball, and that this trait is identifiable in prospects.

It’s probably obvious to you that things beyond mere raw velocity contribute to fastball effectiveness. You can probably deduce what some of those things are through simple pattern recognition; the System Summary from this prospect list is an example of that. From having done this for a while now, there are common, visually identifiable characteristics shared by pitchers whose strikeout results outperform what we might anticipate given just their velocity, just as there are common mechanical/stuff-related attributes targeted by successful teams in the draft. (Those teams have also made mechanical and/or approach alterations to players they’ve acquired.) Spin rate, extension, vertical and horizontal approach angles, and spin direction/efficiency all play a role, too, as does command.

The more those traits serve to support vertical movement — a.k.a ‘rise’, life, carry, Z-break — the more swings and misses a fastball tends to generate. And when a fastball exhibits several of these traits, you can end up with a dominant heater despite limited velocity. Without them, I’ve been bamboozled by otherwise visually pleasing stuff. And indeed Clayton Kershaw’s fastball has some of these attributes. At 88-91, his fastball is still fine. In the mid-90s, it was utterly dominant.

The way we talk about these traits in scouting and player development is not yet entirely consistent across baseball. I was on the phone with an in-office analyst last week discussing what would eventually become this article, and we were using the same terms to describe different things, which caused us to argue for about 10 minutes before we realized we were simply miscommunicating. This video and these two articles provide a great foundation for understanding how pitches need to spin in order to create vertical movement. The version that has been most intuitive for me is the Rapsodo/TrackMan version, which describes spin direction by using a clock face from the pitcher’s perspective. The closer fastball tilt gets to 12:00, the more backspin it has. For the purposes of this article, I’m just looking at lefties, but you’ll be interested to know that some frequently-asked-about prospects like Zac Gallen (12:30 spin axis on the fastball), Astros RHP Jose Urquidy (91-95, up to 97, plus changeup and command, smart breaking ball usage, a 12:30 spin axis on the heater), and Ashton Goudeau (90-93, also has 12:30 spin axis, plus split/change) have some of the traits I’ve talked about.

It’s fair to watch a pitcher’s arm angle and assume that vertical arm slots create the kind of backspin we’re looking for, but we can better see the ball/hand relationship, including sub-optimal ones, using our high-speed camera, Slomie. If you didn’t read the Driveline and Laurila background articles, we’re looking for something close to pure backspin and seam uniformity. You’ll be unsurprised to see Clayton Kershaw exhibit both. At peak, he was averaging over 12 inches of Z-break on his fastball. He’s closer to 10 inches now, which is still above league average:

Spin rate is a factor here, too, and we have those for most of the minors. So based on information we have, here some lefty pitching prospects who I think also exhibit some of these Kershawian traits. I don’t anticipate any of them becoming as incredible as Kershaw, but they do possess mechanical characteristics that will enable them to get the most out of their stuff. Full scouting reports for most of these players can be found on THE BOARD.

MacKenzie Gore, San Diego Padres
Gore has all the components: the velocity, the spin axis, the seam uniformity, elite athleticism, some natural mechanical deception. He doesn’t spin his curveball as well as Kershaw, but his changeup is better. He’ll be in Sunday’s Futures Game.

Joey Wentz, Atlanta Braves
Wentz doesn’t have the quality breaking ball but his fastball plays well above it’s 88-91, and he has good changeup feel.

Ethan Small, Milwaukee Brewers
The Brewers 2019 first rounder is Kershaw’s mechanical doppelgänger. In 2019, he struck out 176 hitters in 107 innings for Mississippi State, most of them in the SEC, while sitting 88-92.

Joey Cantillo, San Diego Padres
Cantillo, a 2017 16th rounder out of a Hawaii high school, only sits about 88-92, but the life on his fastball and the quality of his secondary stuff has him missing lots of bats in the Midwest League. He hasn’t allowed more than one run in a start since April 26.

Tarik Skubal, Detroit Tigers
Skubal’s full report is on The Board. He ranks 14th in the minors in swinging strike rate.

Erik Miller, Philadelphia Phillies
He doesn’t get into his legs the way Kershaw does, and the velocity fluctuations Miller has experienced over the last year and a half is a bit concerning, but he has the pitch specifications I’ve outlined above and knows how to mix his stuff.

Burl Carraway, Dallas Baptist University
I anticipate Kiley will have high speed of Carraway in the coming days, as he’s been electric for Team USA recently, up to at least 97 with a knockout breaking ball.

Drew Dowd, Junipero Serra HS (CA) and Ross Dunn, Cottonwood HS (UT)
These were the two high schoolers at PG National whose fastballs I thought played up above their velocity for the reasons I’ve outlined above, though Dowd might be better off working with a four-seamer.


The 2019 Pitcher Projections: Where Did We Go Wrong?

If the other projectionators are anything like me, the projections going awry, afoul, or askew is always something in the back of their minds. Ideally, one should make projections, let the rubber hit the road, and then worry about what actually happened in the fall post-mortems. As much as I’d like to do that, when ZiPS makes an aggressive projection in one direction or the other, especially one that departs from the consensus of the other projection systems, I can’t help but look over my shoulder.

Two of the projections keeping me up at night the most from the preseason are those of Shane Bieber and Giovanny Gallegos.

Coming into 2019, ZiPS projected Bieber to go 13-8, with a 3.71 ERA, a 3.49 FIP, and 3.8 WAR. Those numbers were a bit sweat-inducing given that 3.8 WAR was enough to rank Bieber 13th in the majors entering the season. Bieber had a 3.23 FIP in his rookie season, but posted a 4.55 ERA and appeared to lack an out pitch against left-handed batters. Players with fewer projected wins included reigning AL Cy Young winner Blake Snell, Stephen Strasburg, German Marquez, and Patrick Corbin. Thankfully, this was one projection where ZiPS had company, with the rest of the projection systems housed at FanGraphs (Steamer, THE BAT, ATC) joining in. Whether your preferred quote about friendship is “I would rather walk with a friend in the dark, than alone in the light,” or the considerably darker “Misery loves company,” we all went down the Bieber road together.

But ZiPS went out on the Giovanny Gallegos branch nearly alone. Gallegos was in the top 10 of pitchers ZiPS was the most optimistic about. Indeed, with a 0.57 ERA difference between ZiPS and the consensus, ZiPS was only more optimistic about three other pitchers: Brad Brach, Mychal Givens, and Juan Nicasio. ZiPS is losing those battles so far, but Gallegos has been terrific for the Cardinals, striking out 13 batters a game; he was recently moved into higher-leverage spots. Read the rest of this entry »


Matthew Boyd’s Home Run Problem

In April, Matthew Boyd gave up two homers. In May, five balls left the yard against the Tigers lefty. Last month, Boyd’s breakout season slowed as he gave up 10 homers. As we enter July, Boyd has a solid 3.57 FIP and a 3.72 ERA, and has been worth 2.6 WAR, which ranks 17th among pitchers this season. Those are good numbers to be sure, but as June began, Boyd’s ERA and FIP were both 2.85 and his 2.5 WAR ranked third for pitchers behind only Max Scherzer and Stephen Strasburg. Boyd’s strikeouts and walks have been slightly better than they were earlier in the season; his BABIP is slightly higher and his LOB% is a little bit lower. But that doesn’t explain his 5.90 ERA and 5.37 FIP. It’s the home runs that are hurting Boyd, and with the trade deadline a month away, trying to determine whether they are randomly bunching across a few starts or the beginning of a trend is an important exercise for teams looking to reinforce their rotations.

As for how Boyd broke out in the first place, the answer is a bit easier to find — the work has already been done for us. Sung-Min Kim detailed Boyd’s transformation earlier this season, showing how Boyd lowered his arm slot to gain spin on his fastball, and raised the location of the pitch. He also buried his slider more often, gained a consistency in his delivery, and basically eliminated the two-seamer. David Laurila also wrote on Boyd earlier this season, discussing his work with Driveline to create a better slider.

Boyd’s season can be carved up any number of ways depending on how you might want to use (and abuse) arbitrary endpoints. If we took away the first three spectacular Boyd starts of the season, where he struck out 29 and walked six, his FIP is 4.09, his ERA is 3.95, and he’s averaging nearly two homers every nine innings. If we look at just his first 10 starts, he’s one of the best pitchers in baseball. He has five starts with 0 or 1 runs. He’s only got two starts where his strikeouts don’t at least equal his innings pitched. The only time he walked as many as three batters, he struck out 13 Yankees. If Boyd had evenly spaced out his 17 homers across his starts, we’d be discussing a moderate breakout. Instead, we have a massive breakout followed by concern. Read the rest of this entry »


More Than You Probably Wanted to Know About First-Inning Scoring

Any new fans coming to major league baseball through this past weekend’s London Series between the Yankees and Red Sox got a rather distorted sense of the game’s scoring and temporal norms, particularly in the first inning of each contest. In Saturday’s series opener, each team sent 10 batters to the plate, scored six runs, and chased the other team’s starting pitcher (New York’s Masahiro Tanaka and Boston’s Rick Porcello). The 12-run, 58-minute inning was just the opening salvo of a slugfest that seemed to be imported straight from Coors Field, a 17-13 slog that took four hours and 42 minutes to play. Sunday’s game, won 12-8 by the Yankees, wasn’t quite as high scoring, but it did feature a four-run first inning by the Red Sox that clocked in around 26 minutes, not to mention a nine-run seventh inning by the Yankees in a game that lasted four hours and 24 minutes.

Though neither team in Saturday’s game came close to outdoing this year’s first-inning high score (10 runs by the Phillies on April 16 against the Mets), and the two teams fell short of the combined record of 16 runs most recently accomplished by the A’s (13) and Angels (3) on July 5, 1996, the rivals did make some history. According to STATS, this was the first time since June 23, 1989 (Blue Jays at A’s) and just the sixth time since 1912 that both teams scored at least six runs in the first inning. Via the Baseball-Reference Play Index, that game was one of just three since 1908 in which neither starter got out of the first inning after allowing at least six runs, with an August 4, 1948 game between the Red Sox and Browns, and an April 16, 1962 game between the Cardinals (not Bob Gibson’s best day) and Phillies being the others.

The Yankees’ big numbers in London helped them overtake the Twins for the major league lead in scoring (5.80 runs per game). While Saturday’s game was the second time in less than two weeks the team chased a former Cy Young winner in the first inning after clobbering him for six runs — they did so on June 19 against the Rays’ Blake Snell as well as Saturday against Porcello — they’re actually not the majors’ most prolific first-inning team. They entered Sunday ranked eighth in the majors with 0.62 first-inning runs per game, a per-nine rate of 5.56.

Read the rest of this entry »


A Conversation With Brendan McKay

Brendan McKay continued his fantastic season this past Saturday. Making his big-league debut with the Tampa Bay Rays, the 23-year-old left-hander retired 18 of the 20 Texas Rangers batters he faced. And his work on the farm had been every bit as dominating. In 66.2 innings between Double-A Montgomery and Triple-A Durham, McKay compiled a 1.22 ERA and allowed just 38 hits.

And then there’s the offensive side of the equation. As you know, McKay can swing the bat. Aspiring to be the major’s next Shohei Ohtani — sans the Tommy John surgery — the former Golden Spikes winner as a two-way player at the University of Louisville was 11 for his last 33, with three home runs, at the time of his call-up.

What is his approach on each side of the ball, and does he truly expect to be able to play both ways at baseball’s highest level? I addressed those questions with the 2017 first-round pick a few days before he arrived in The Show.

———

Laurila: Nuts and bolts first question: What is your approach on the mound?

McKay: “I’m a pitcher who likes to get ahead — just like every other pitcher — and force the action, rather than letting the hitter have any control over the at-bat. That’s basically it.”

Laurila: Are you looking to induce contact, or are you out there trying to miss bats? Read the rest of this entry »


Sunday Notes: James McCann Has Found the Best Version of James McCann

A number of years ago, Boston sports-TV anchor Bob Lobel used to say of former Red Sox players excelling for other teams, “Why can’t we get players like that?” Similar words are currently being uttered in Detroit, in regard to James McCann. In his first season with the Chicago White Sox, the 29-year-old catcher is slashing a robust .320/.378/.519, and he’s already gone deep nine times.

McCann wasn’t nearly that good with the stick in his four-plus years with the Tigers. When he signed with the ChiSox in December — a bargain-basement one-year deal for $2.5M, no less — he was a .240/.288/.366 career hitter. How did he suddenly morph into an offensive force?

“Honestly, the biggest thing for me this year is that I’m trying to be the best James McCann,” is how the Tigers castoff explained it prior to a recent game at Fenway Park. “I’m staying within myself and not trying to do too much. I’m taking my base hits the other way — I’m taking my singles — and not trying to hit the impossible six-run homer.”

The breaking-out backstop trained with Rangers infielder Logan Forsythe over the offseason — both live just south of Nashville — and as McCann pointed out, each has played with some great hitters over the course of their careers. Not that attempting to emulate one’s more-talented peers is always the best idea. Read the rest of this entry »


Futures Game Rosters are on THE BOARD

Futures Game rosters were announced today. We’ve compiled them and added them to a tab on THE BOARD for your perusal. There you’ll have access to things like our scouting reports, tool grades, and video of the prospects.

You probably already know most of the names on the rosters because they’ve been discussed and/or prominently ranked at this website, but I want to touch on some interesting inclusions. First, I had to create a new BOARD record for, and source a fresh report on, Brewers RHP Devin Williams, who has been in pro ball since 2013 and is this year’s oldest participant. Injuries constantly sidetracked the first five years of Williams’ career and this season was his first above A-ball. I saw him as a starter in 2016 and 2018 sitting about 90-93 with a plus curveball. He was finally ‘penned this year and has been 91-97 and has touched 100 while showing plus breaking stuff. In my opinion he’s still too wild and has too lengthy an injury history to FV him the way we have other relievers with similar stuff (he was in the honorable mention section of the Brewers’ offseason list), but it’s a great story and an in-person look in Cleveland might change our minds. He’ll likely be a 40-man add this offseason.

Also of note is the Red Sox’s 2018 seventh round pick Jarren Duran, who was the biggest individual riser on our post-draft list update and is on the roster. As far as I know, he’s the lowest-drafted player to make a Futures Game in the following season. Boston’s system is not good and that’s part of why he’s their representative, but his rise has been quite incredible and his evaluation is arguably the game’s most important.

Of course, it’s important to note that these rosters are subject to change due to either injury or big league call-ups. Cubs RHP Adbert Alzolay and Rays LHP/1B Brendan McKay are both in the big leagues right now and would seem to be the most likely to be replaced, while Nationals SS Carter Kieboom, Cleveland OF Daniel Johnson and Rockies LHP Ben Bowden are, in my opinion, in the next tier of likelihood to be replaced. For logistical simplicity, replacements for Alzolay and McKay would be, and this is just an educated guess on my part, Midwest League arms from those teams. Rays prospects Shane Baz or Matthew Liberatore, both on Bowling Green’s roster, would be fine inclusions whose throwing schedules wouldn’t have to be adjusted much for this game, while Cubs LHP Brailyn Marquez, who is at South Bend, is a logical talent/proximity sub, but he’s have to be shorted a day’s rest (compared to what he’s used to, not based on typical big league rest) to throw that night.


The Rays Needed to Call Up Top Prospect Brendan McKay

News broke last night that Rays’ prospect Brendan McKay will make his debut on Saturday; Marc Topkin of the Tampa Bay Times had the initial report. The reasons for Tampa calling up McKay, who was ranked 14th overall this spring by Eric Longenhagen and Kiley McDaniel before moving up to 11th on THE BOARD in the post-draft update this month, are threefold. First, the Rays need a pitcher Saturday. As Topkin noted in his piece, Ryan Yarbrough pitched three innings in last night’s 18-inning win over the Twins, and he won’t be able to take the bulk of the innings tomorrow as originally planned. Second, the Rays are in what should be an incredibly close race for the playoffs and need every competitive advantage they can get. And third, tying into the second, McKay is a very talented pitcher who gives the Rays the best shot at winning.

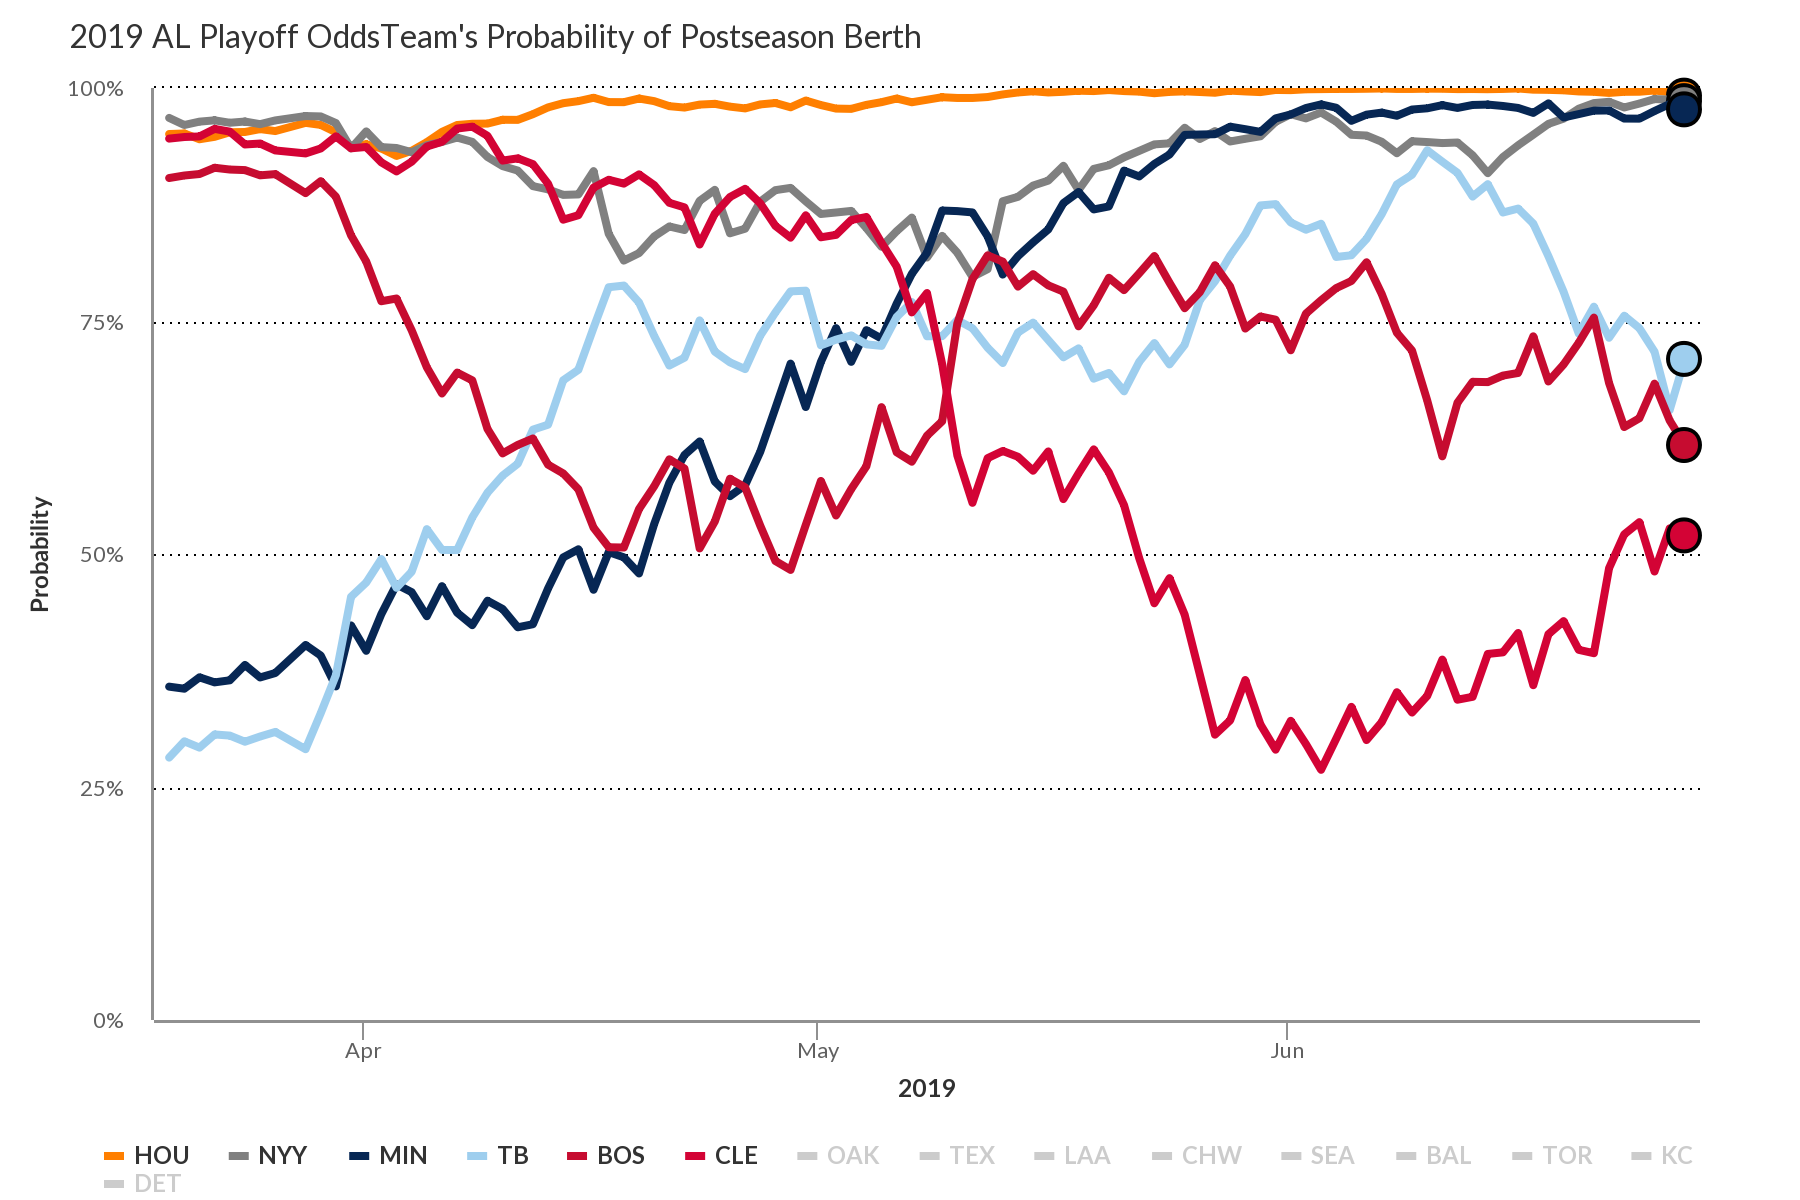
Before getting to McKay’s talents, let’s first examine the competitive landscape in the American League. Much has been made of the parity in the National League, with nearly every teams having some shot at the playoffs halfway through the season. The top-heavy nature of the American League has made for a bunch of haves and have-nots, with only a handful of teams having a realistic shot at the playoffs. Looking at the playoff odds, the Rays are one of those teams:

Read the rest of this entry »