We just updated our player pages! The pages might not look that different, but we’ve redone everything under the hood. We did this to achieve responsive player pages, and it also comes with improvements in speed and a better platform to develop new features in the future.
Quick Look
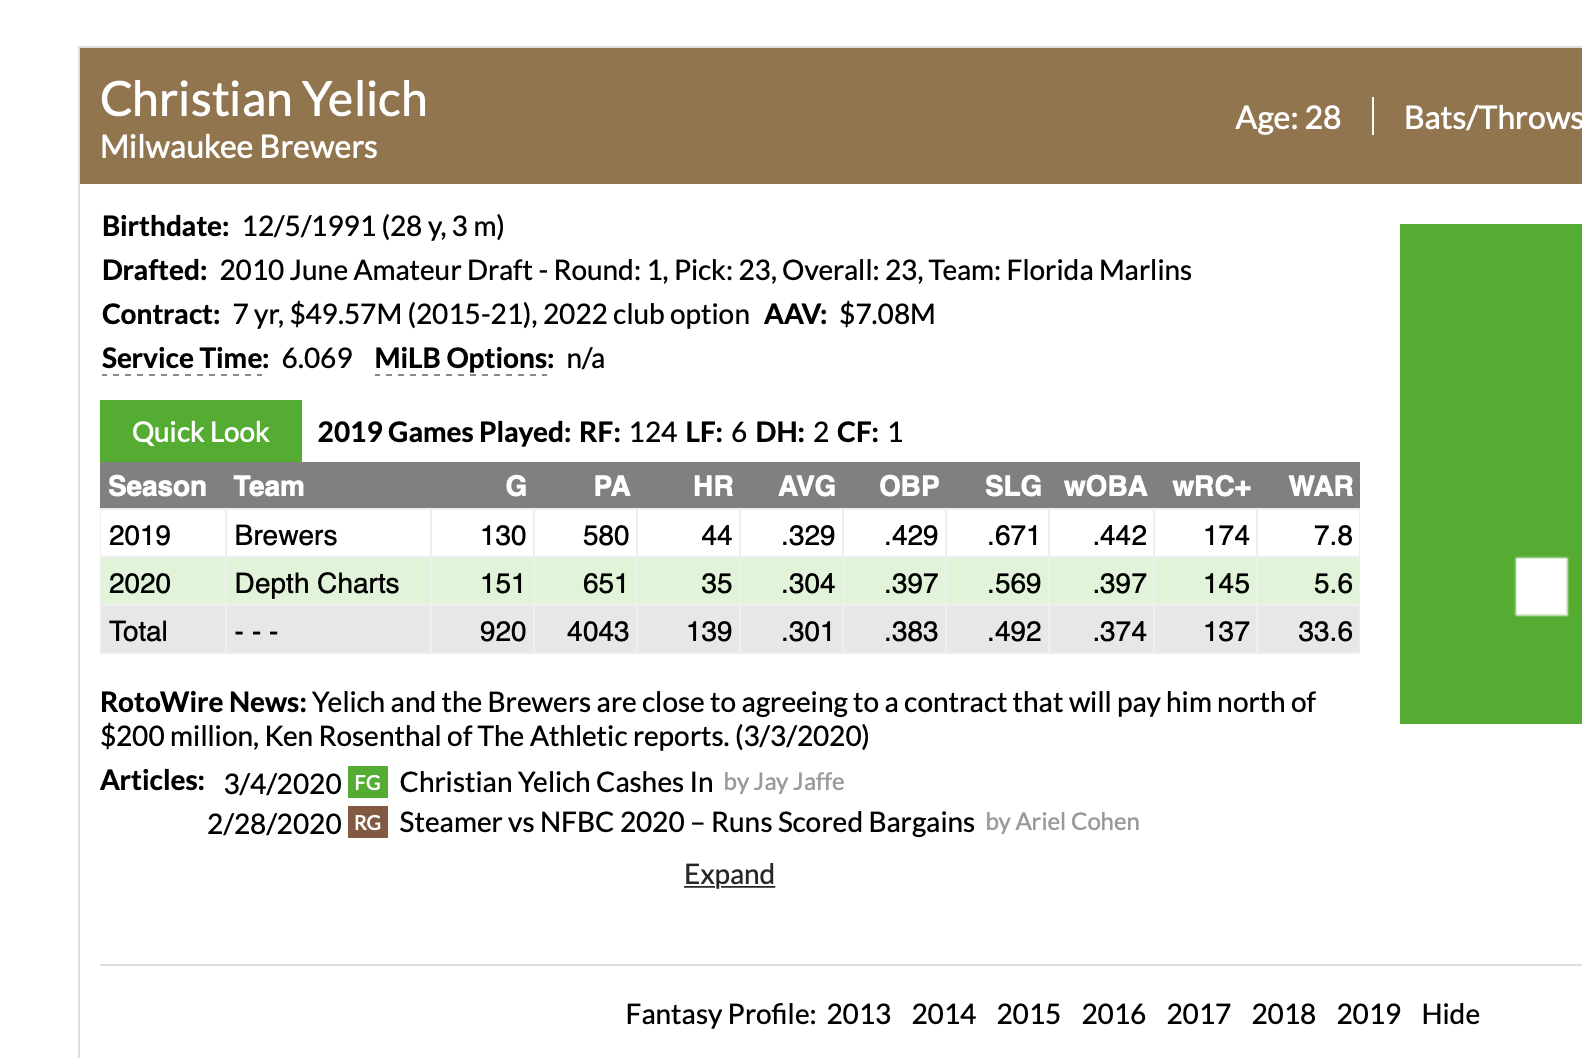
If you are on a desktop computer, the most noticeable difference on the new pages is the Quick Look section we’ve added to the very top of the page. These will have some popular stats for the player’s major league career and the current or most recent season. Retired players will only have their career stats.
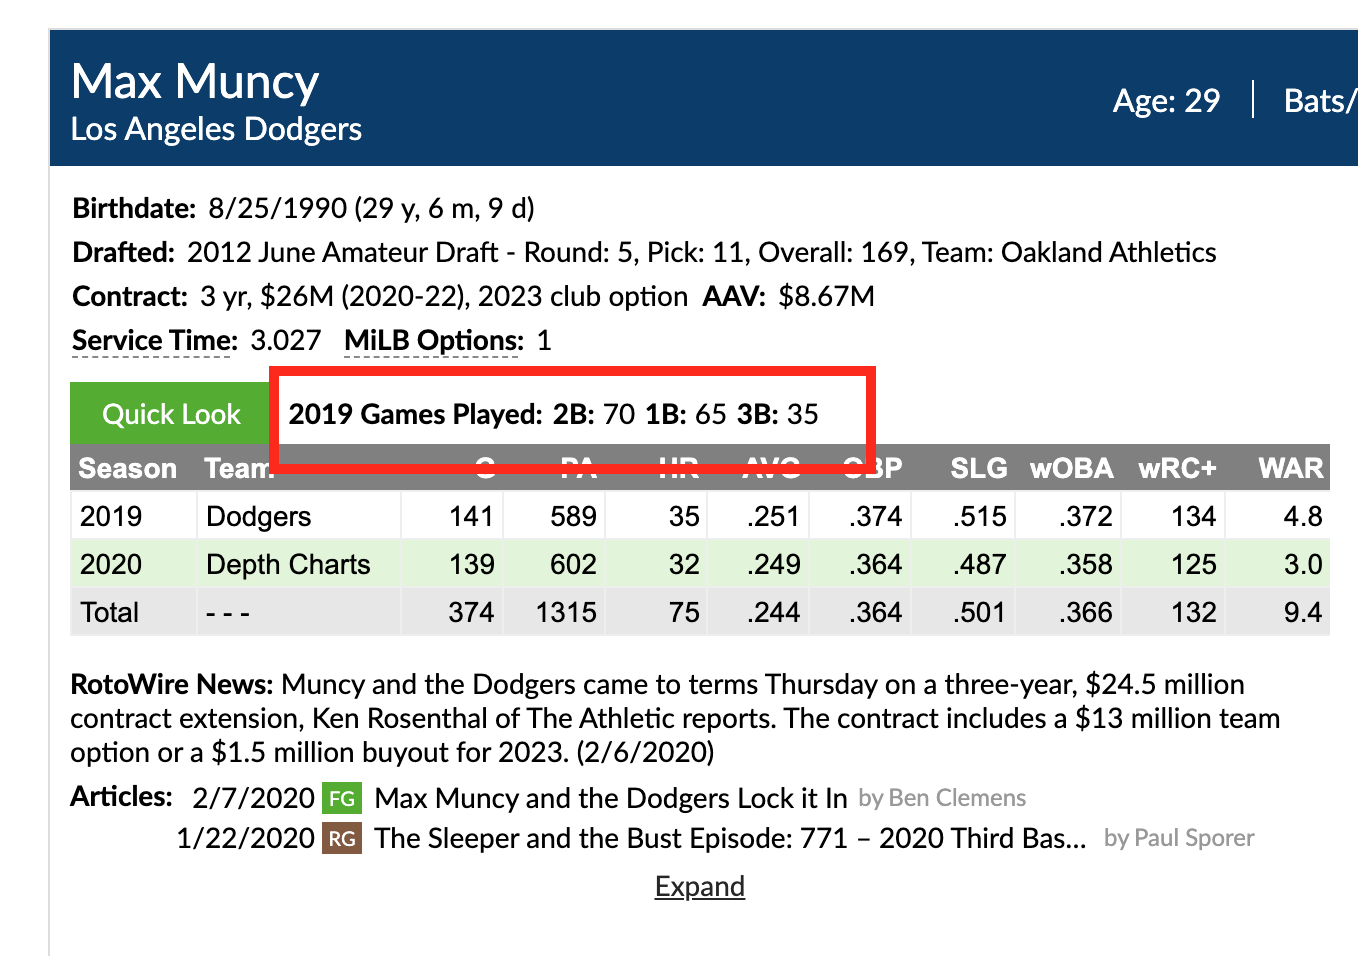
For position players, we’ve also provided a summary of how many major league games the player played at each position, while a pitcher’s Quick Look will show their pitch repertoire. The position breakdown will double count games a player played at two or more positions, and does not include pinch-hitters or pinch-runners, so those values might not add up to games played. We display the Pitch Info classifications for the pitches where usage is 5% or greater for the season. Once again, these will only show for the current or most recent season.
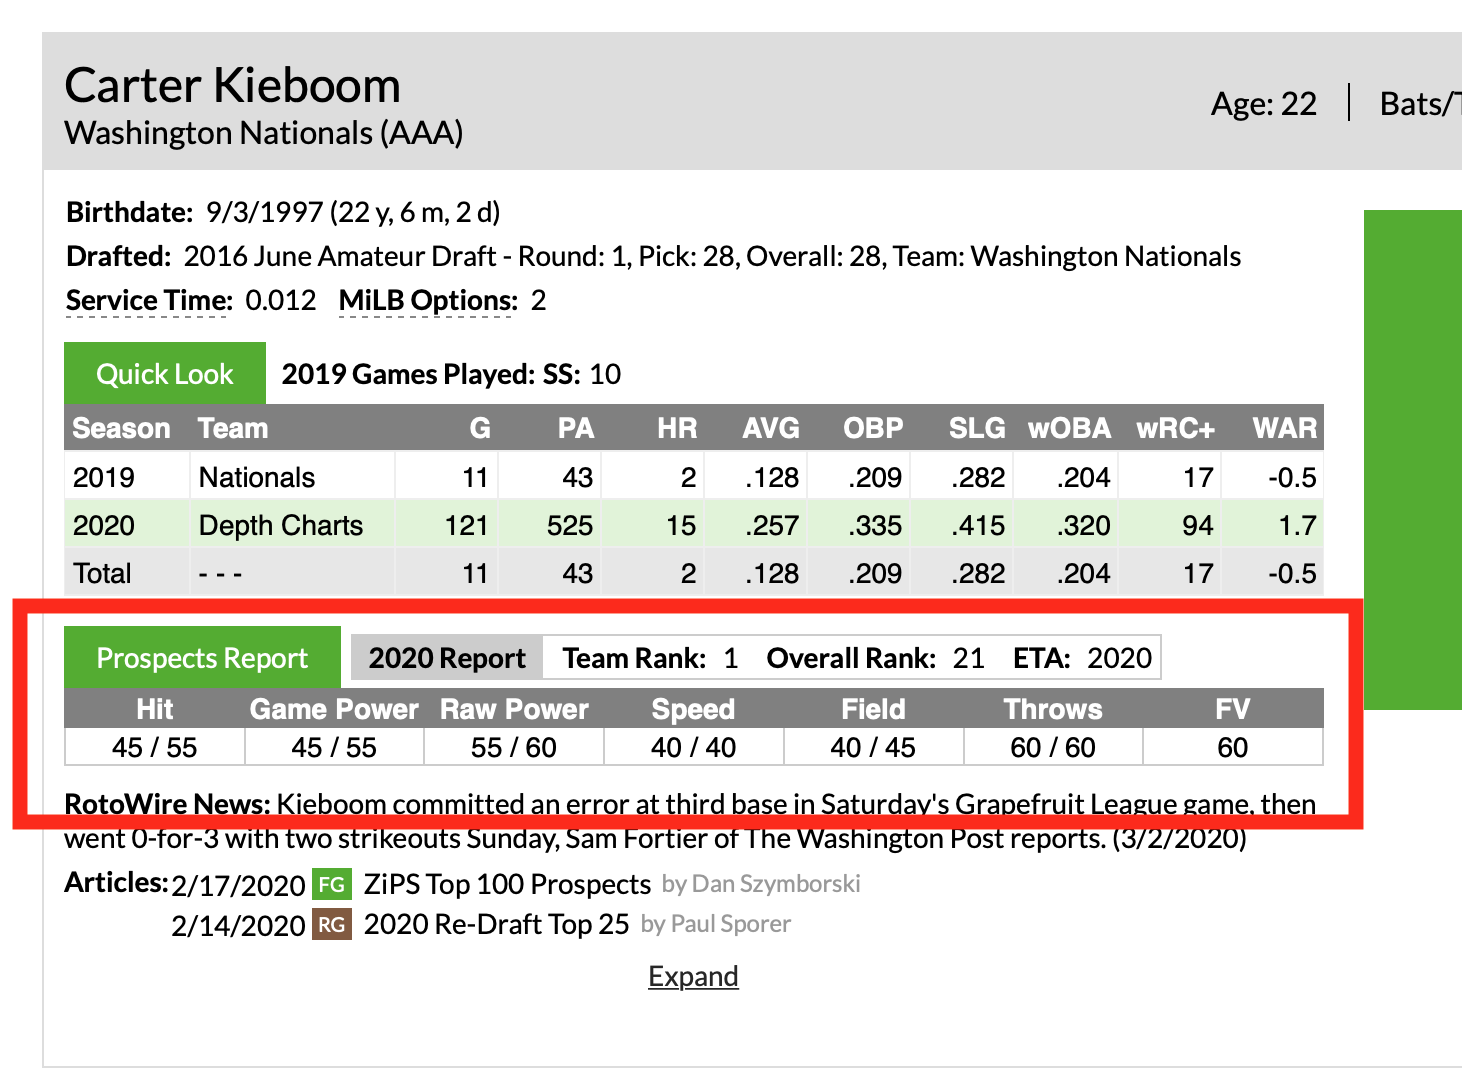
Prospects and players who were recently prospects have their most recent scouting grades and team rankings from the prospect team shown. The report year those grades and rankings come from is shown and also serves as a link to The Board, allowing you to see that report’s entire class. Any in-season rankings are denoted with a (U) for Updated.
Table View Options and Minor League Stats
Minor league stats are no longer shown by default for every player. We do, however, show them for players who:
- Do not have any major league stats.
- Current players who have less than two years of service time.
- Retired players who have minor league stats in our database, but played fewer than three seasons in the majors.
You can toggle the minor league stats into view as always, with the table options between the table header and the data grid.
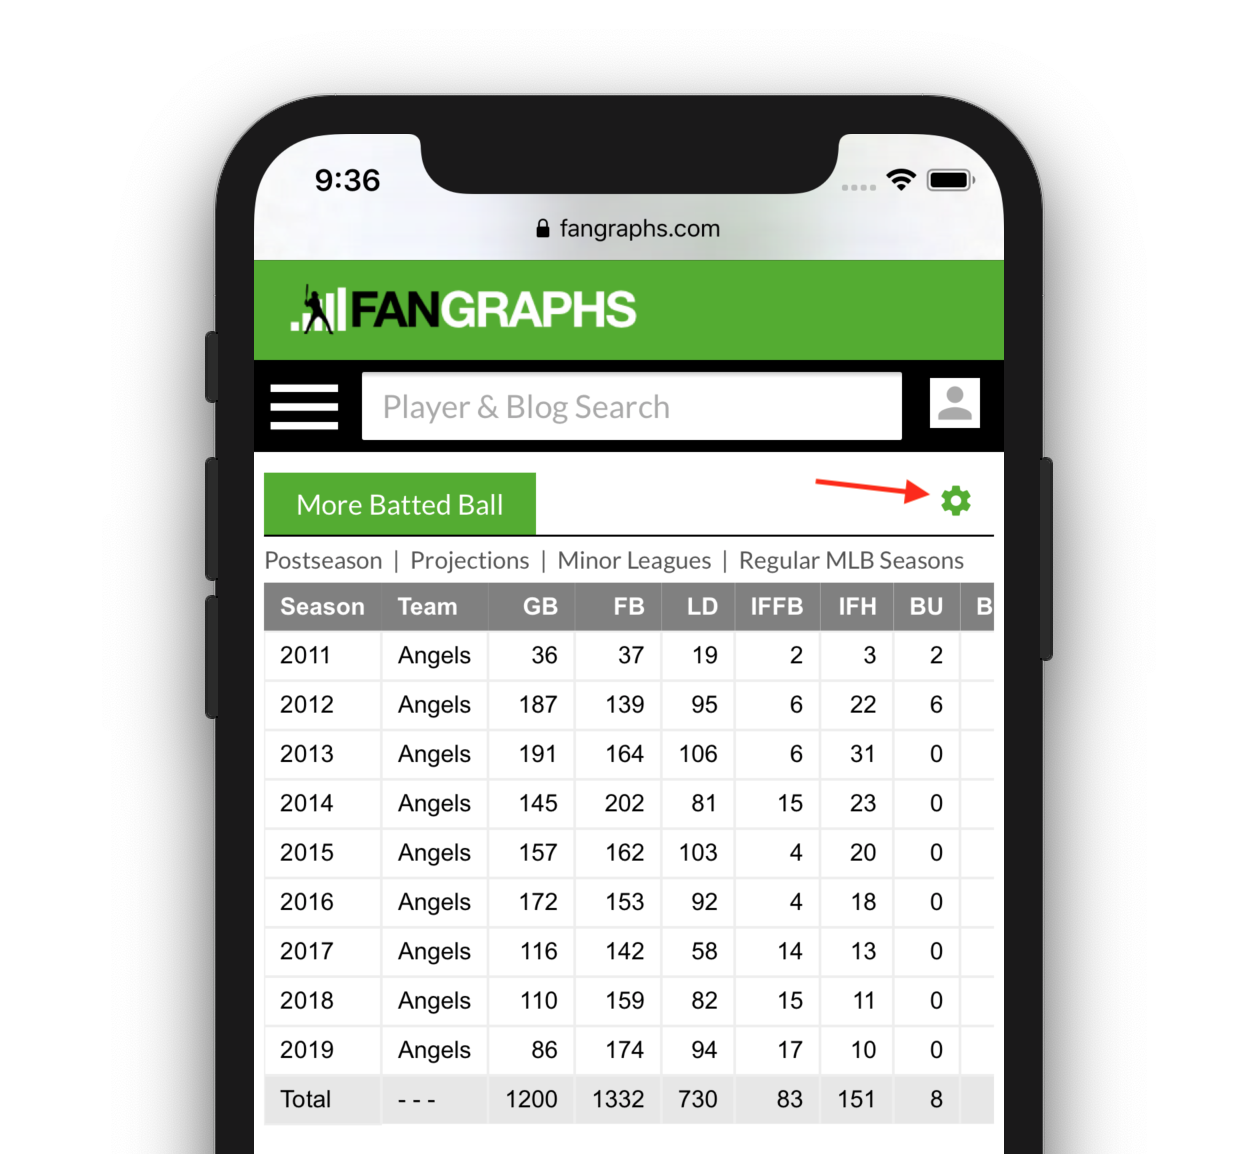
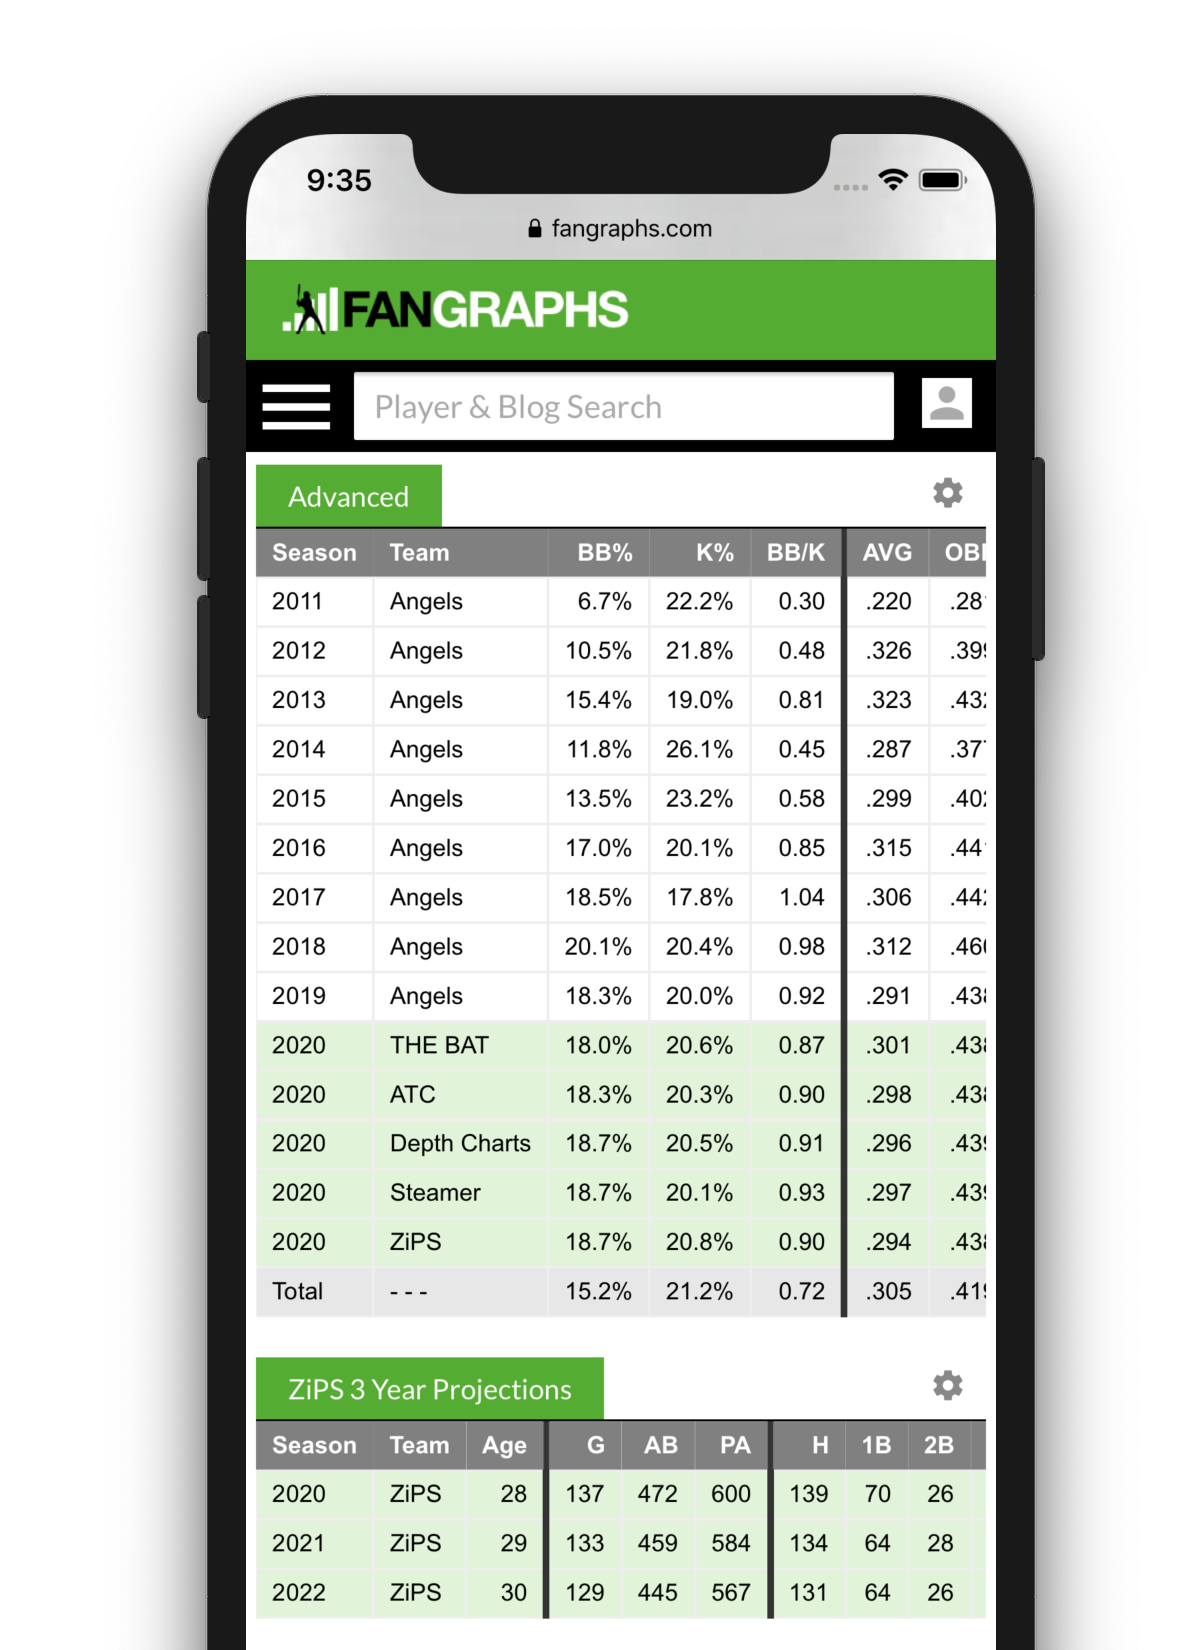
On mobile, those table view options are hidden but are accessible via the settings gear on the top-right of the table.
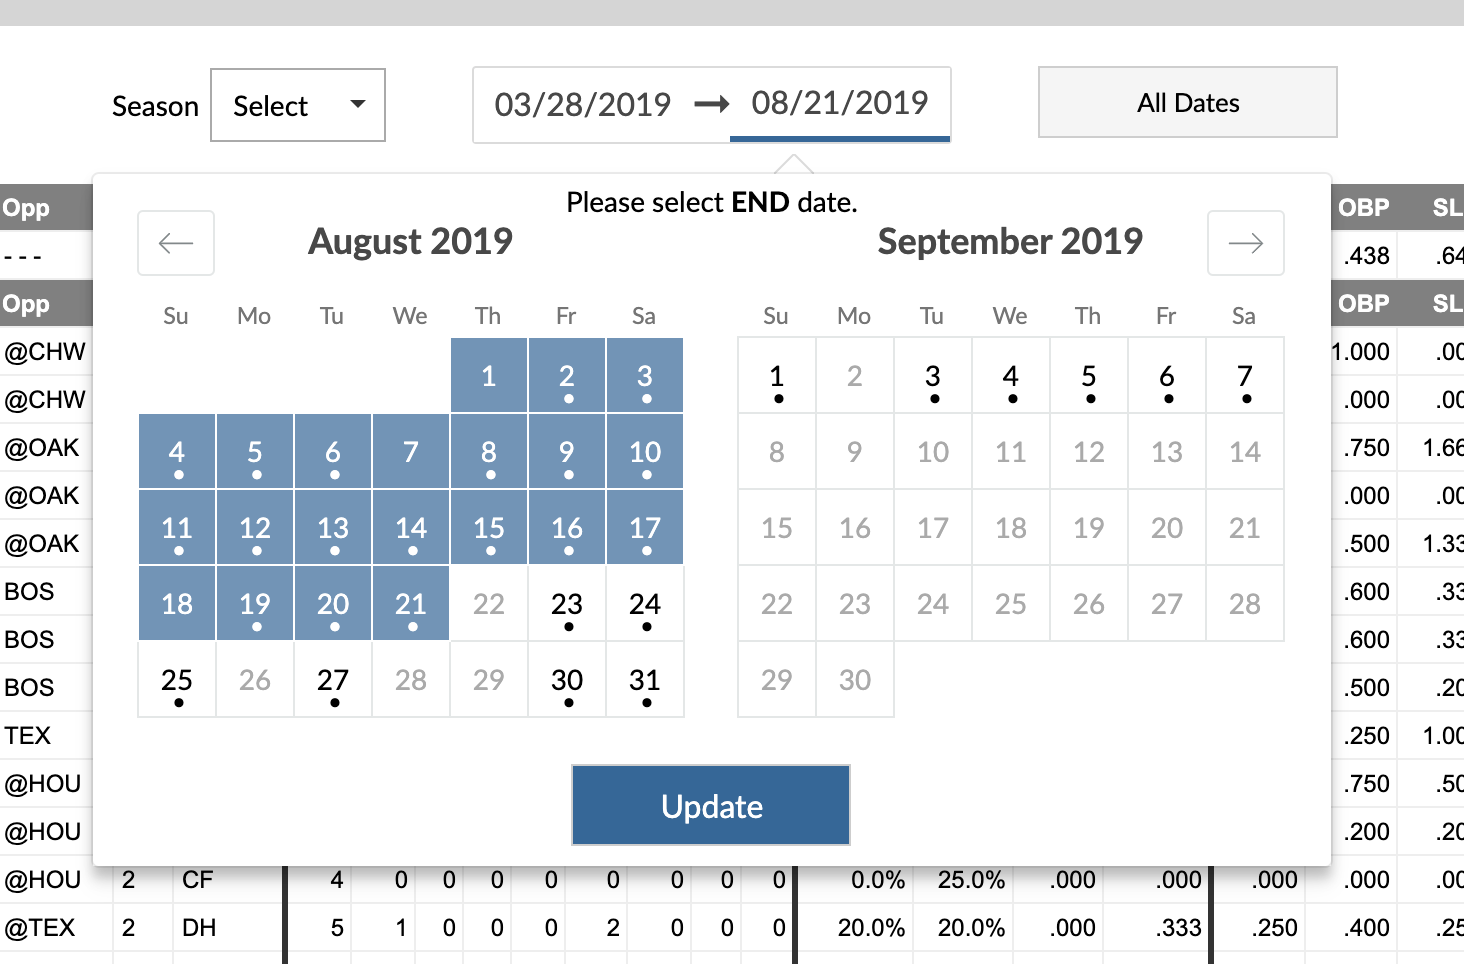
Game Logs
The game log calendar has been updated as well. Days when the player played a game are shown in black and have a dot underneath the date. Clicking update will load the new date range. You are also able to select an entire season or all games that we have available. If you select a very long range, it might take a while to load.
We also now have game logs and play logs available for players who played from 1974 to 2002. These behave just like the game logs and play logs of current players. 1974 is as far back as our play-by-play data currently goes.
Mobile
We made the data grid pages responsive. Much like The Board or the minor league leaderboards, you are able to scroll across the table while the season for the row is fixed in the left column.
For the moment, the visualization-based pages still require the full desktop view to use. We hope to move everything over to a responsive view soon.
Other Notes
Fantasy Player Profiles are still in the process of being written and will be available soon. The placement of the profiles on the player pages haven’t changed.
Back in January, we announced the creation of legacy pages for all players pages. The HTML structure on those has not changed. However, they are not meant as a fully-featured alternative, so navigation might not work and new features we develop in the future will not be added to them. This is meant as a stop-gap for any research tools you might have that rely on the HTML structure.
As always if you find any issues or bugs, please let us know in the comments!