Archive for Featured Photo

The Diamondbacks Have Transformed

The 2017 Arizona Diamondbacks were an unexpected delight, an eventual playoff team that was projected to be near the bottom of the NL West before the season. They had star power to burn; with Paul Goldschmidt and A.J. Pollock anchoring the lineup and Zack Greinke and Robbie Ray at the front of the rotation, the team had a top four to rival any team in baseball. After that, though, the drop off was severe. Maybe you could squint and see greatness in Jake Lamb, maybe you believed in the Shelby Miller bounce back, but the depth simply wasn’t there.

Those Diamondbacks made the postseason and won the Wild Card game, fueled by a deadline trade for J.D. Martinez, but their stars-and-scrubs construction was worrisome. Pollock missed time with injury, David Peralta didn’t take a step forward, and the cupboard generally looked bare. While the team’s pitching staff looked more promising thanks to breakouts from Patrick Corbin and Zack Godley, it wasn’t built to last. Corbin was only a year from free agency, Greinke was getting older, and Godley was more league average than a star in waiting.

By the end of 2018, that iteration of the Diamondbacks was no more. Pollock and Corbin left in free agency, Goldschmidt was a Cardinal, and the team made no secret that it was shopping Greinke. For those of you keeping score at home, that’s all their stars other than Ray, and he had underperformed massively in 2018. We baseball fans are pattern matchers, and this pattern is an easy one to spot: it was time for a tank and rebuild.

Well, a funny thing happened on the way to the bottom of the standings. The Diamondbacks, projected for the fourth-worst record in the NL before the season, are clinging to the fringes of the playoff hunt, with a 5.3% chance of reaching the Wild Card game. They’re 75-71, on the verge of putting together their third straight winning season. Most impressively, they’re doing it with an entirely new cast of characters. Read the rest of this entry »


Cubs’ Loss of Báez Sticks Out Like a Sore (or Broken) Thumb

September has been a cruel month when it comes to contending teams losing key players. On Tuesday alone, the Twins placed Byron Buxton on the injured list with a left shoulder subluxation for which he subsequently underwent season-ending surgery, and the Brewers lost Christian Yelich for the duration due to a fractured right kneecap. The day before that, the Cubs found out that Javier Báez would not return before the end of the regular season due to the severity of the fractured left thumb he suffered on September 1, though at least the door is open for him to return at some point in the postseason. Each of those losses compound other injury woes — at this time of year, everybody hurts — but for the Cubs the loss of Báez is particularly acute, as the team has slid from first place into a tie for the second NL Wild Card spot in the span of five weeks.

On August 8, the Cubs’ season reached its high-water mark in terms of both their division lead (3 1/2 games ahead of the Cardinals) and playoff odds (90.8%). Since then, they’ve stumbled to a 14-16 record, and at 77-68, find themselves tied with the Brewers with 17 games remaining. Here’s the graph of the NL Central teams’ playoff odds over the course of the season, with the aforementioned date highlighted:

The 26-year-old Báez initially injured his thumb while sliding into second base in the third inning following a pickoff attempt by the Brewers’ Gio Gonzalez. Though visibly shaken up on the play, he did not depart until the seventh inning:

Read the rest of this entry »


Sean Doolittle’s High-Stakes Fight Against Pressure and Time

Sean Doolittle threw 10 pitches to Billy Hamilton on Saturday. Every one of them was a fastball, and all but one of them were in the upper third of the strike zone or higher. That’s what Doolittle does. No one in baseball throws a higher rate of fastballs than Doolittle’s 89.2%, and no one throws a higher rate of them in the upper third of the zone or higher than his 54.2%. He wears hitters out there, and that’s what he did to Hamilton. After a lengthy battle, the Braves’ new speedster didn’t have enough in the tank to get a piece of this last pitch.

That was a good outing for Doolittle. He retired all three hitters he faced, two of them on strikeouts. Even though Washington failed to rally in the top of the ninth, losing 5-4 to Atlanta, that kind of inning might have left a few Nationals fans feeling a bit more encouraged about their team’s overall outlook than they did before the game. That’s because recently, a dominant inning of work from Doolittle has no longer been the near-guarantee it used to be.

From 2017-18, Doolittle was incomprehensibly great. He threw 96.1 innings between Oakland and Washington and held a 2.24 ERA with a 2.27 FIP. He struck out 122 batters while walking 16. In terms of the game’s elite relievers, Doolittle was practically without equal. But this season, he hasn’t packed nearly the same punch. His ERA is 4.09, and his FIP is 4.23. His xFIP, which was a jaw-dropping 2.68 just last year, is now 5.05. He’s striking out two fewer batters per nine innings and issuing walks at his highest rate since 2015. After allowing just eight homers over the previous two seasons combined, he’s surrendered 10 this season. Read the rest of this entry »


Fractured Kneecap Ends Yelich’s Season and Dents Brewers’ Postseason Hopes

Christian Yelich won NL MVP honors while leading the Brewers to a division title and within one win of a trip to the World Series last year, but hopes for repeating that magic took a severe blow on Tuesday night. In the first inning of the Brewers’ game against the Marlins in Miami, the 27-year-old right fielder fouled a pitch off his right kneecap and was forced from the game. In the aftermath of the team’s 4-3 victory, general manager David Stearns told reporters that Yelich had fractured the kneecap and will be out for the remainder of the season, a crushing blow to a team that has overcome a slew of injuries to win five straight games and climb to within one game of the second NL Wild Card spot.

Ouch. Ugh. F***. A player with a reasonable claim as the NL’s best is down for the count as far as 2019 goes, and while thankfully it’s not an injury with career-altering ramifications, right now there’s no joy in Mudville or Milwaukee. This completely sucks.

Facing righty Elieser Hernandez, Yelich fouled a 1-1 slider squarely off his right knee, crumpled to the ground, and remained there for several minutes while being tended to by Brewers athletic trainer Rafael Freitas. He could not complete the plate appearance (pinch-hitter Trent Grisham completed the strikeout, which was charged to Yelich) and limped off the field under his own power (you can see the video here).

Stearns said that Yelich would be flown back to Milwaukee to meet with team doctors and determine whether surgery would be necessary and what the prognosis would be going forward. He praised his star slugger, saying, “Look, I think first and foremost, we feel awful for Christian. This is a guy who has carried us in a number of ways over the last two years. He could have been two and a half weeks away from a repeat Most Valuable Player Award. That’s where our thoughts go first.” Read the rest of this entry »


I Got It! I Got It! I…: When Infield Flies Go Bad

While a strikeout is always nice, a pop up is typically also a great outcome for a pitcher. In fact, FanGraphs treats infield fly balls and strikeouts as equivalent when it comes to calculating FIP-based WAR. If you want to read more about it, our Glossary has a good overview, and this Dave Cameron article is particularly useful. As Dave puts it, “infield flies are, for all practical purposes, the same as a strikeout.”

That logic makes perfect sense, and that’s why infield fly balls are baked into WAR calculations with the same value as strikeouts today. By my calculations (necessarily a bit inexact as Baseball Savant categorizes balls in play somewhat differently), a measly 36 of the 3,866 infield fly balls this year have turned into base hits, mostly on flukes like this:

Justice was served on this play, and you could even debate the word “infield” since it landed on the outfield grass, but you get the general idea: short of a weird shift, very few infield fly balls turn into hits.

But just because few of them become hits doesn’t mean no one’s getting on base. Cameron again: “Sure, maybe you or I wouldn’t turn every IFFB into an out, but for players selected at the major league level, there is no real differentiation in their ability to catch a pop fly.”

Sure, major league infielders, even the very worst of them, have preternatural hand-eye coordination and have spent thousands of hours of their lives catching baseballs. By their very nature, infield pop ups give fielders a long time to react. That ball is in the air for three, four, even five seconds. It’s one of the easiest plays you’ll ever get as a defender.

That’s all true, and yet infielders have dropped 38 pop ups this year. That simple play, baseball’s version of a wide open layup, isn’t always converted into an out. To be fair, six of them hardly count as being infield fly balls — this Starlin Castro drop should probably have been played by an outfielder, for example:

That still leaves 32 plays in which the pitcher got one of the best possible outcomes and got a baserunner for his troubles. Obviously, the fielders are to blame somewhat in these situations. But how much are they to blame? Let’s take a look at a few different kinds of infield fly balls that didn’t go as the defense planned. Read the rest of this entry »


Chance Adams, Domingo German, and Nick Pivetta on Developing Their Curveballs

Pitchers learn and develop different pitches, and they do so at varying stages of their lives. It might be a curveball in high school, a cutter in college, or a changeup in A-ball. Sometimes the addition or refinement is a natural progression — graduating from Pitching 101 to advanced course work — and often it’s a matter of necessity. In order to get hitters out as the quality of competition improves, a pitcher needs to optimize his repertoire.

In this installment of the series, we’ll hear from three pitchers — Chance Adams, Domingo German, and Nick Pivetta — on how they learned and developed their curveballs.

———

Chance Adams, New York Yankees

“When I was in college my pitching coach was Wes Johnson, who is now with the Twins. He taught me my curve. For awhile it was kind of slurve-slider, then it went to a curveball, and now it’s kind of slurvy again. But it’s interesting, because when I got [to Dallas Baptist University] it was, ‘OK, I throw it like this,’ and he was like, ‘Well, have you tried spiking it?’ My curve was moving, but it wasn’t sharp, and I was like, ‘No, not really.’ Spiking it was uncomfortable at first, but after I got used to it, it was pretty interesting. It started moving better.

Chance Adam’s curveball grip.

“My pointer finger is off the seam, with just a little pressure on the ball. Wes said to try spiking it and see what feels good, so I worked on it with this much spike, that much spike. Even now, the spike kind of varies for me; I’ll move it back or forward for comfortability, but also movement-wise. Sometimes it’s sharper when it’s more spiked. It kind of depends on the day, and if I’m controlling it or not. Read the rest of this entry »


Introducing RosterResource Payroll Pages!

Back in July, we launched the RosterResource depth charts, the first of several features moving over to FanGraphs. Today, we have added RosterResource’s payroll pages.

As is the case with the depth charts, these are a near-replica of the RosterResource version. The loading time is faster, however, and player names link to the corresponding FanGraphs player page.  These can currently be accessed by clicking on “Payroll” at the top of the RosterResource pages and then clicking on the team.

Here is most of what you can learn by visiting a RosterResource payroll page.

Player Info

  • Contract details (years, total, options, and opt-outs)
  • Year-by-year salary breakdown
  • Major league Service Time (updated at the conclusion of each season)
  • Arbitration eligibility and Free Agency years
  • AAV (average annual value of contract)

Team Info

  • Estimated Payroll for each year that includes at least one guaranteed contract.
  • Estimated Payroll at the end of previous season.
  • Estimated Luxury Tax Payroll.
  • Dollars due to players no longer with organization.
  • Dollars owed by another team.

Players included on each payroll page are separated into three sections:

  • Players With Guaranteed Salaries
  • Players Eligible For Arbitration
  • Notable Players Not Yet Eligible For Arbitration

The Notable Players Not Yet Eligible For Arbitration group has simple criteria: that the player is likely in the major leagues for good, and won’t have their service time interrupted by a demotion to the minor leagues. Players will be added or removed during the season, however, if a situation changes.

For players without a guaranteed contract, we display an estimated salary during the offseason until they have officially agreed to terms. For free agent signings, the annual salary will be broken down evenly across the years of the deal until official numbers are reported. For example, a two-year, $20MM contract will be displayed as $10 million in 2020 and $10 million in 2021. We will update it once the official breakdown is reported. All estimated values will be displayed in italics.

The payroll pages will be updated immediately following the 2019 season to reflect the 2020 through 2026 seasons. If you find anything that’s incorrect, or something that’s not working, please let us know in the comments.


2019 Leaves the Royals Feeling Blue

Despite good seasons from Whit Merrifield and Jorge Soler, the next good Royals team is a long way off. (Photo: Keith Allison)

“I don’t do anything with my life except romanticize and decay with indecision.” – Allen Ginsberg

There’s no team harder for me to get a read on than the Kansas City Royals. The afterglow of the 2015 World Series has long faded, and attendance is falling back towards levels you might expect for a baseball team playing in Florida. Given the team’s inconsistent statements concerning the organization’s present — and the accompanying moves in harmony with that theme — I’m not sure whether Kansas City is incompetently rebuilding, incompetently retooling, or incompetently competing. Short of a sudden change in organizational focus, the Royals’ main task is to mark the time between the end of one Pat Mahomes season and the start of the next one.

The Setup

After two years of treading water post-championship, 2018 was the year that everything came crashing down. That that season was going to be a dreadful one was largely preordained, prophesied by the team’s contract situations. After winning 80 games in 2017, players worth more than half of the team’s WAR (13.0 wins out of 24.7 total) hit free agency, and there was little hope of one of the league’s weakest farm systems or a fat ownership wallet making good on those losses. Mike Moustakas returned to Kansas City after receiving scant interest in free agency and Alcides Escobar was re-signed for no fathomable reason, but there was little reason to believe that these moves were enough to keep the team wild card pretenders into August.

The 2018 Royals finished with 104 losses and it seemed as if they were finally ready to embrace a full-blown rebuilding process. After all, the Royals spent the summer trading most of their veterans who could fetch some kind of player in return; Moustakas, Kelvin Herrera, Jon Jay, Lucas Duda, and Drew Butera were all dealt. A rebuilding team hardly needs a dedicated pinch-runner and Terrance Gore was traded to the Cubs. Even Escobar started to have his playing time curtailed in just his third consecutive year of near replacement-level production. Sure, players like Alex Gordon and Ian Kennedy stayed put, but they were largely immovable anyway. Read the rest of this entry »


Beating FIP

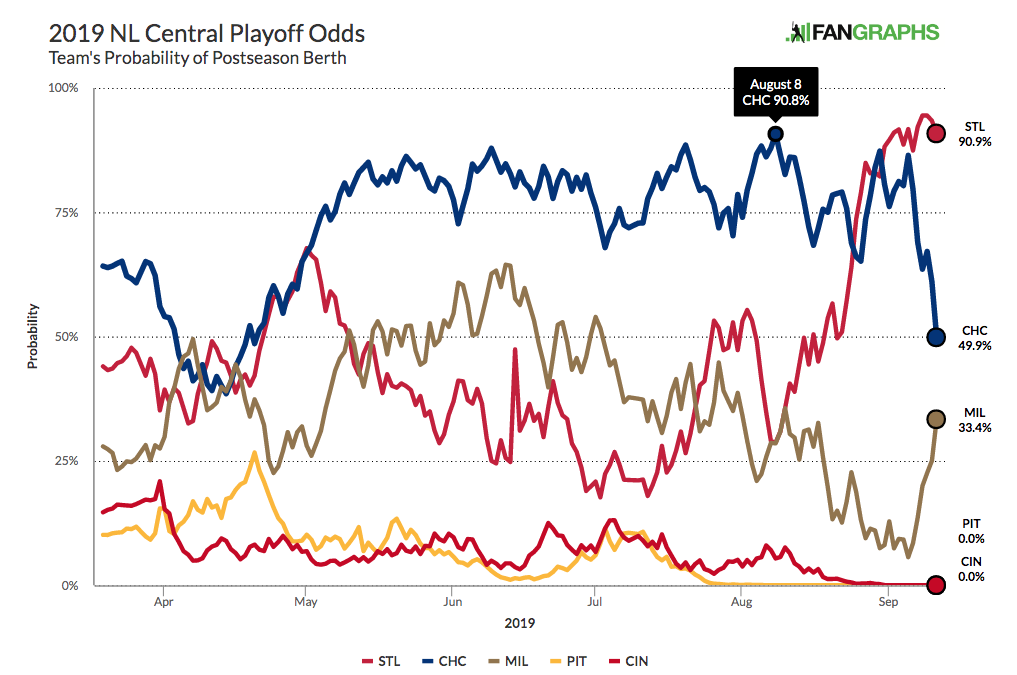
For the most part, a pitcher’s FIP is going to line up pretty well with his ERA over the course of a season or a career. There are 240 starting pitchers with at least 1,000 innings over the last 25 years and all but seven of them have a FIP within half a run of their ERA. Even over the course of an individual season, we typically see most pitchers with an ERA and a FIP around the same mark. Over the last 25 seasons covering more than 3,500 individual pitching seasons of at least 100 innings, the r-squared is .61. This season, there are over 100 pitchers with at least 100 innings; the graph below shows their FIPs and ERAs (all stats are through September 5):

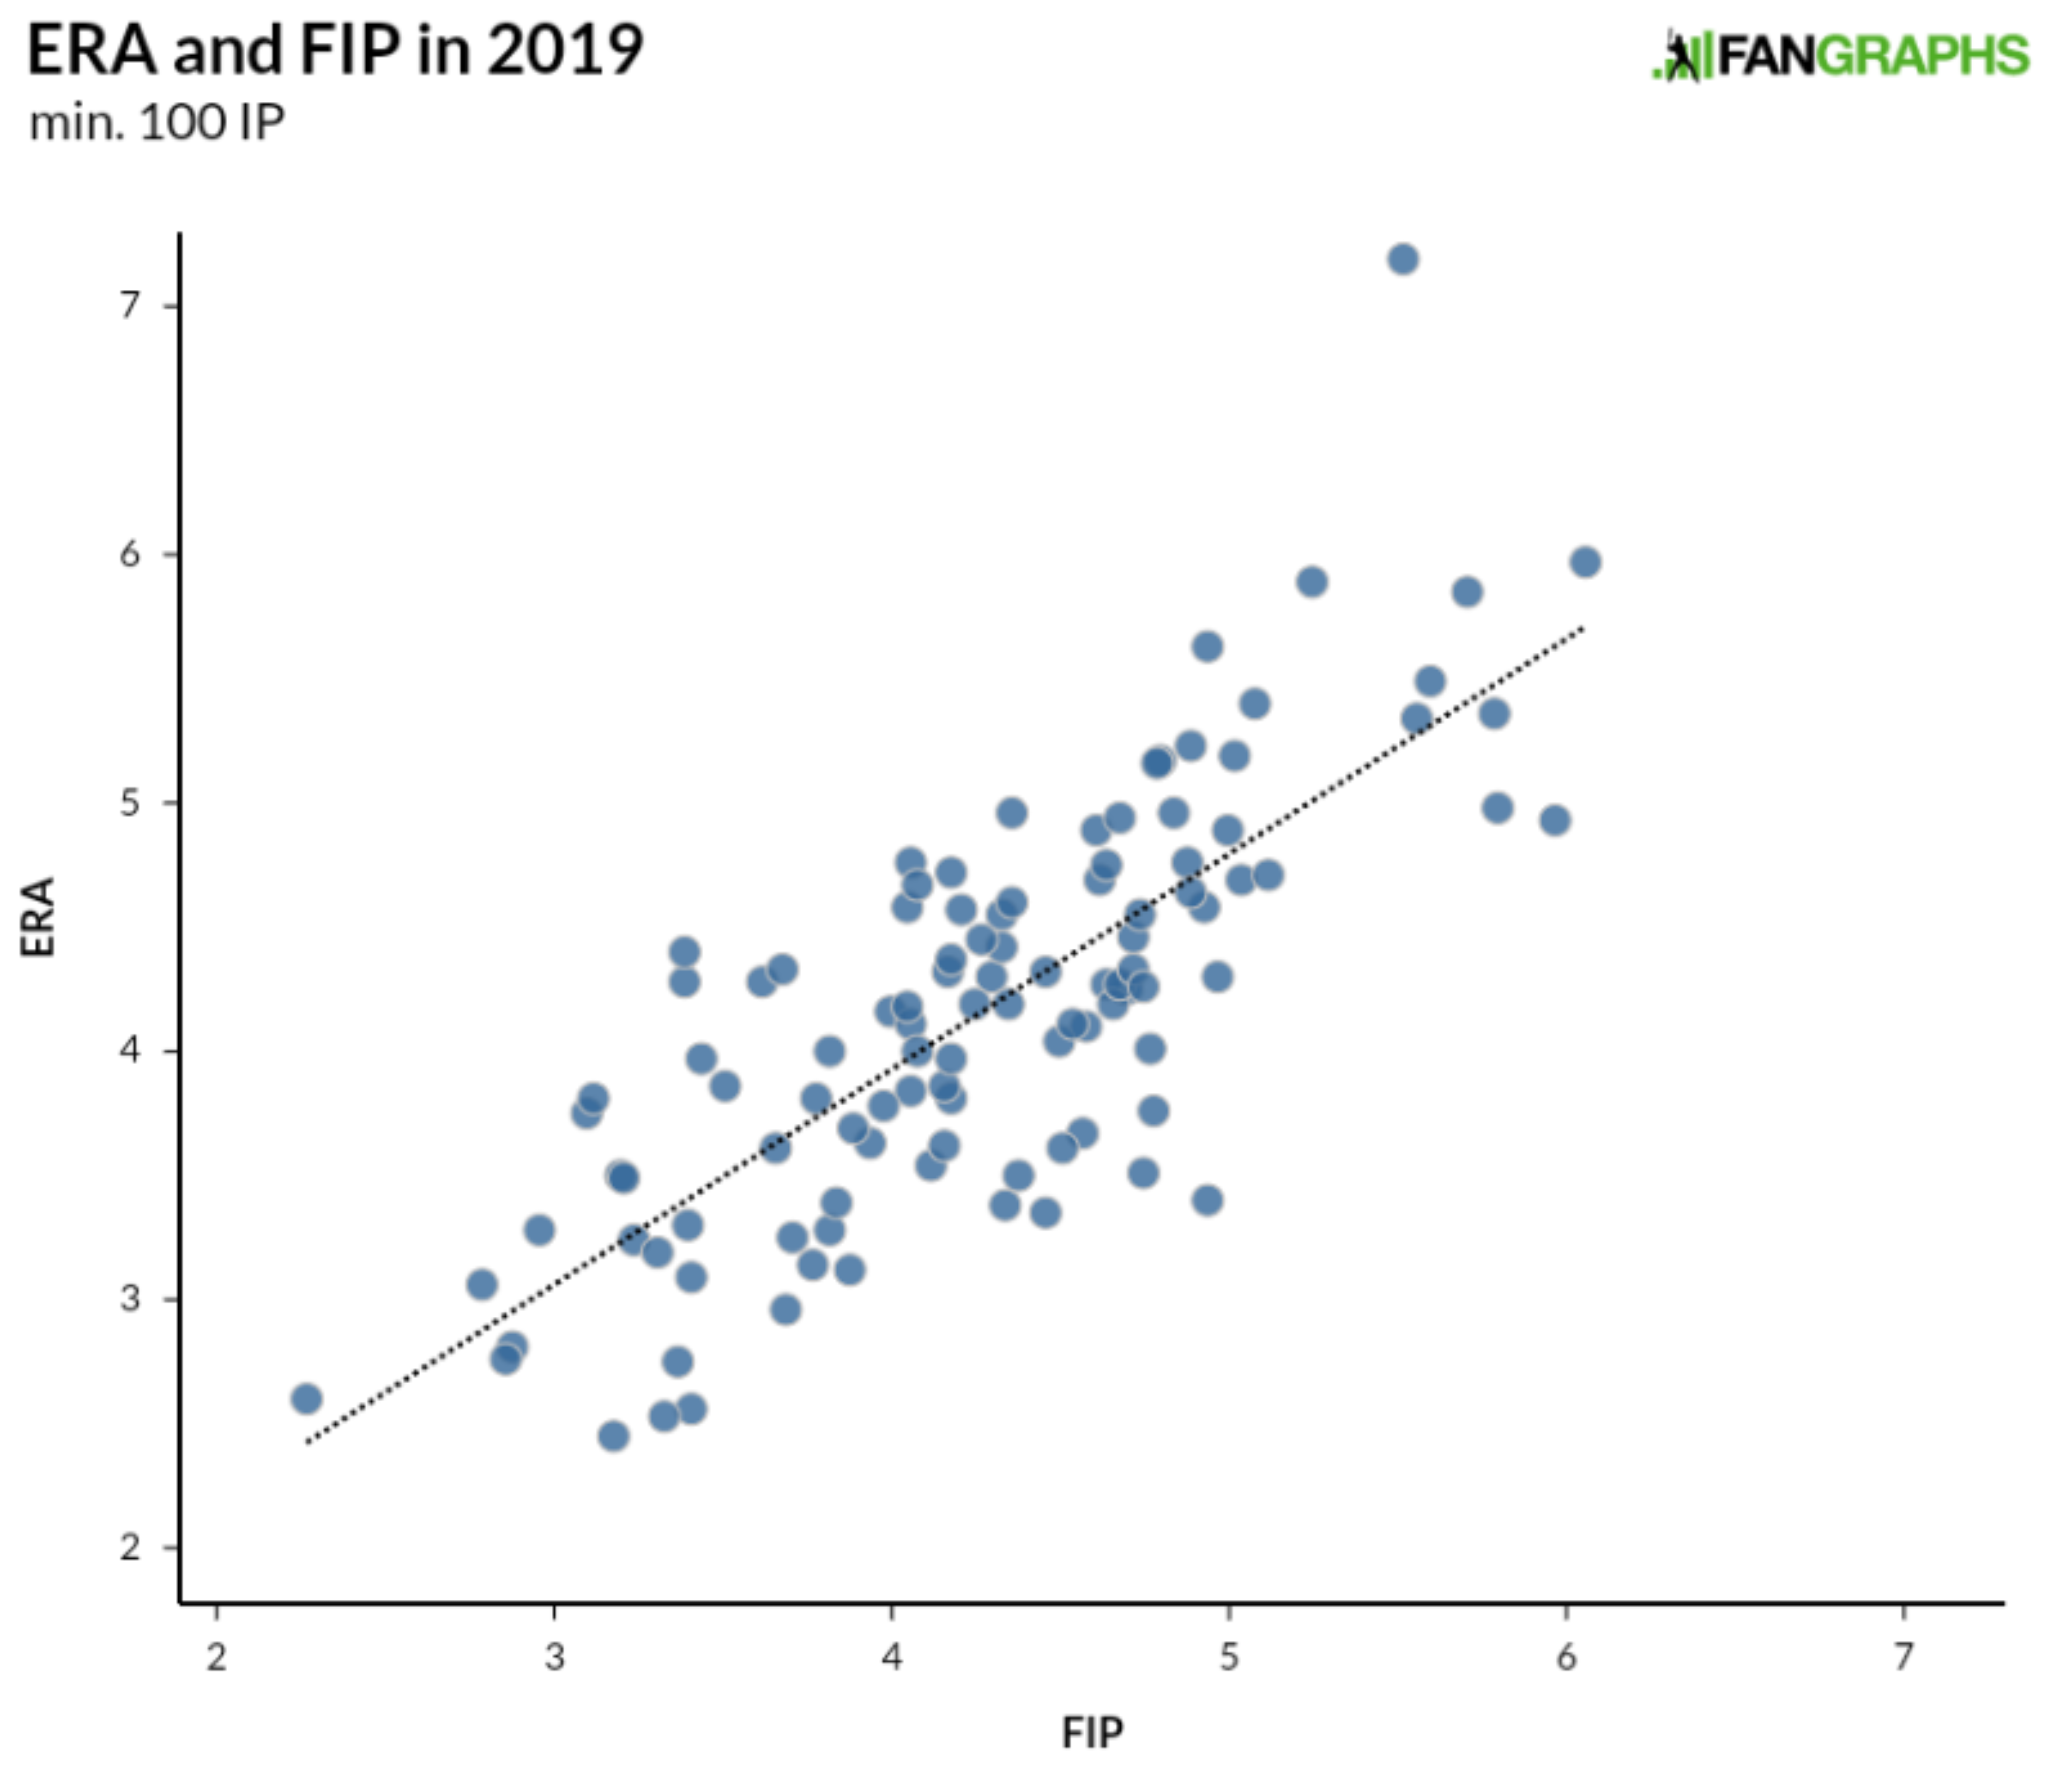
With the exception of Antonio Senzatela way up top, we see a pretty distinct pattern moving up and to the right. Within this cluster of players, there isn’t a perfect relationship. A perfect relationship would make one of the stats duplicative and useless. ERA and FIP both measure results on the field, with ERA accounting for the players who cross home plate after getting on base when the pitcher was on the mound (and the trip home wasn’t made possible by an error), while FIP measures strikeouts, walks, and homers. Every year, a good number of pitchers have an ERA higher than their FIP and vice versa. As far as explaining the difference between the two numbers using readily available statistics goes, BABIP and left-on-base percentage explain much of the gap between the two numbers.

That LOB% would explain some of the gap makes a lot of sense given that stranding more runners than expected is going to keep a pitcher’s runs allowed (ERA) lower than his general performance (FIP). We can see the relationship between ERA-FIP and LOB% for pitchers this season below:

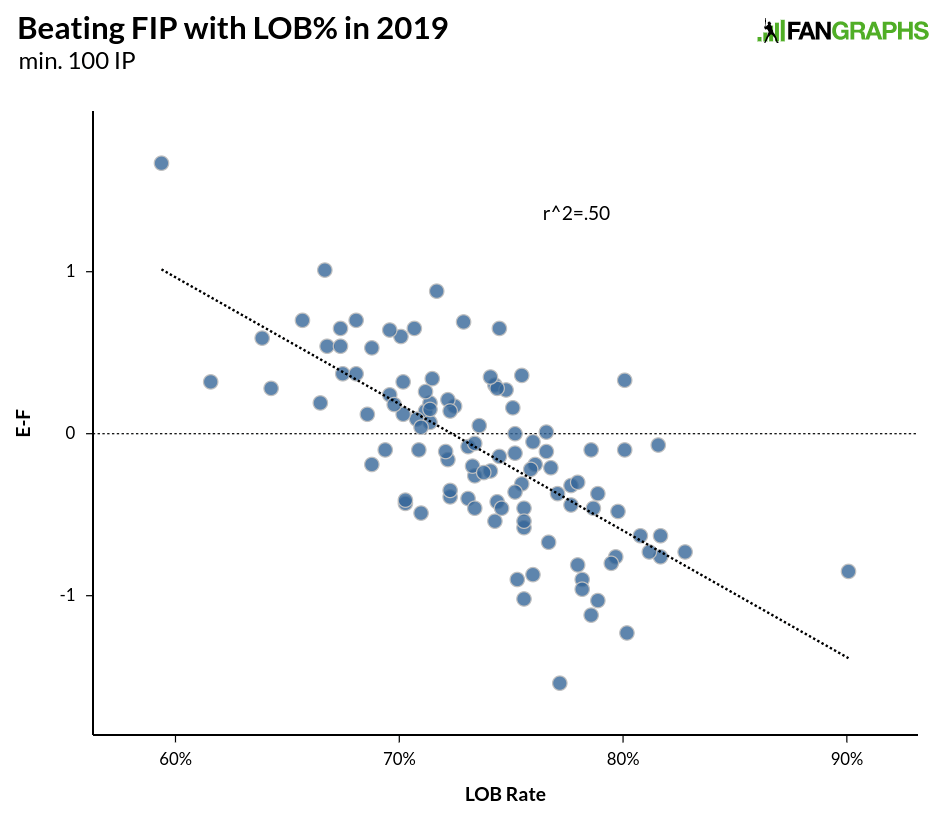
Without delving into whether there’s a skill involved in stranding runners (though better pitchers tend to have higher LOB% due to just being better at getting outs generally), we can see that the more runners stranded and the higher the LOB%, the more likely it is that a pitcher’s ERA is going to be lower than his FIP. The relationship over the past 25 years for individual seasons is stronger than the one above, with an r-squared of .56, but even over just one season, the pattern is apparent. What we are dealing with above is sequencing and what happens when runners are on base compared to overall performance. Generally speaking, pitcher’s perform similarly with runners on base and with the bases empty, with a slight increase in FIP for everyone with runners on base:

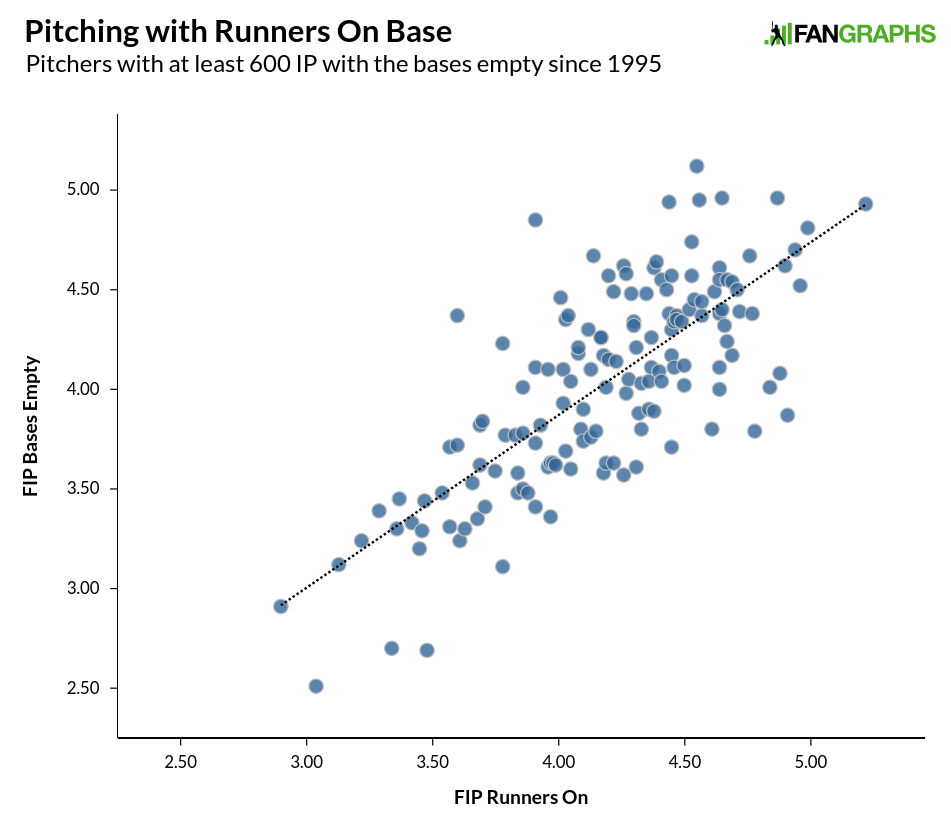
This isn’t to say that some pitchers aren’t worse pitching from the stretch, or that some pitchers don’t change their strategy to more effectively get batters out with runners on base. But generally speaking, pitchers perform a little bit worse with runners on base, though in a fairly uniform pattern as seen in the graph above. Unless you are Doug Davis, Scott Kazmir, Jeff Suppan, or Iván Nova, then with runners on base, you were within half a run with runners on base or worse.

We’ll get back to LOB% in a minute, but first, we should address BABIP. Here’s the relationship between BABIP and the difference between ERA and FIP:

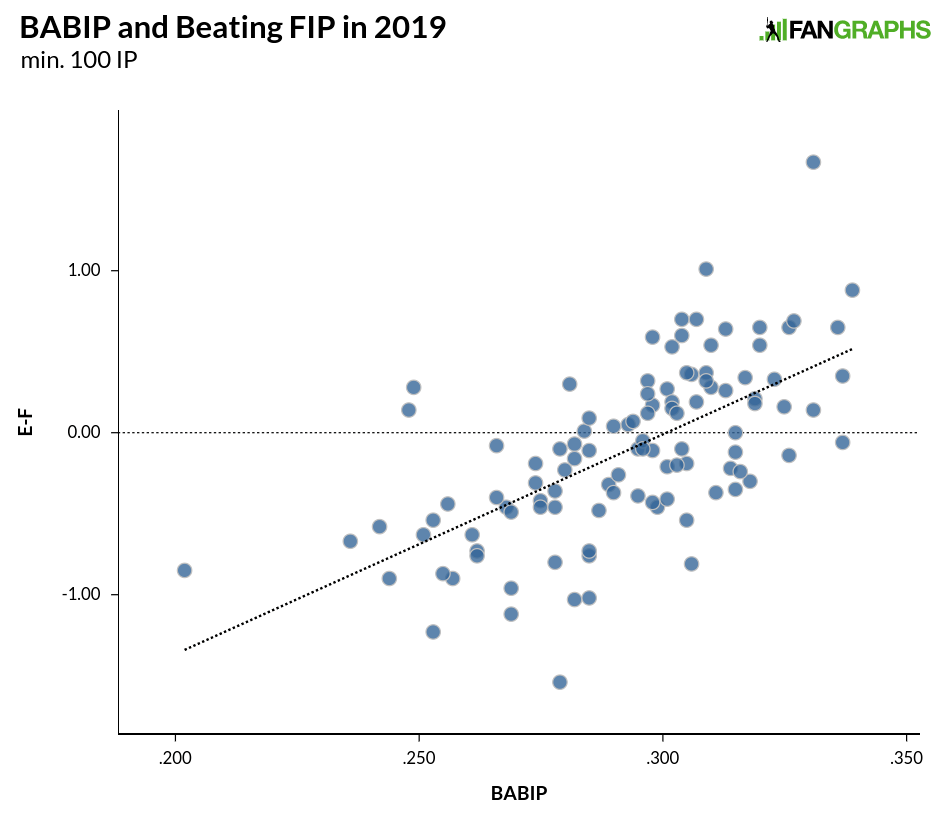
The relationship isn’t as strong as LOB%, but with an r-squared of .41 this season, we can still see a pattern. Over 25 years of individual seasons, the r-squared is .52, nearly the same as LOB% over the same time. While we know that pitchers exert some control over the quality of their contact, over 90% of pitchers with at least 1,000 innings since 1995 are between .270 and .310, and 65% of pitchers are between .285 and .305 (around 10 hits per year at the edges), so even at the extremes we are talking about maybe three or four extra hits per month. That’s not nothing, but over long stretches of time, we generally see the seasonal outliers get closer to their peers.

As for just how much BABIP and LOB% capture the difference between ERA and FIP, the answer is they account for the great majority of it. I took all individual seasons from 1995 through last season and ran them through a multiple regression calculator to come up with a formula for predicting the difference between ERA and FIP. The r-squared for the formula for the 3,400 seasons was .75, so BABIP and LOB% are doing a huge amount of the heavy lifting when it comes to explaining the difference between ERA and FIP. I put the same formula into this year’s numbers and this is how they came out:

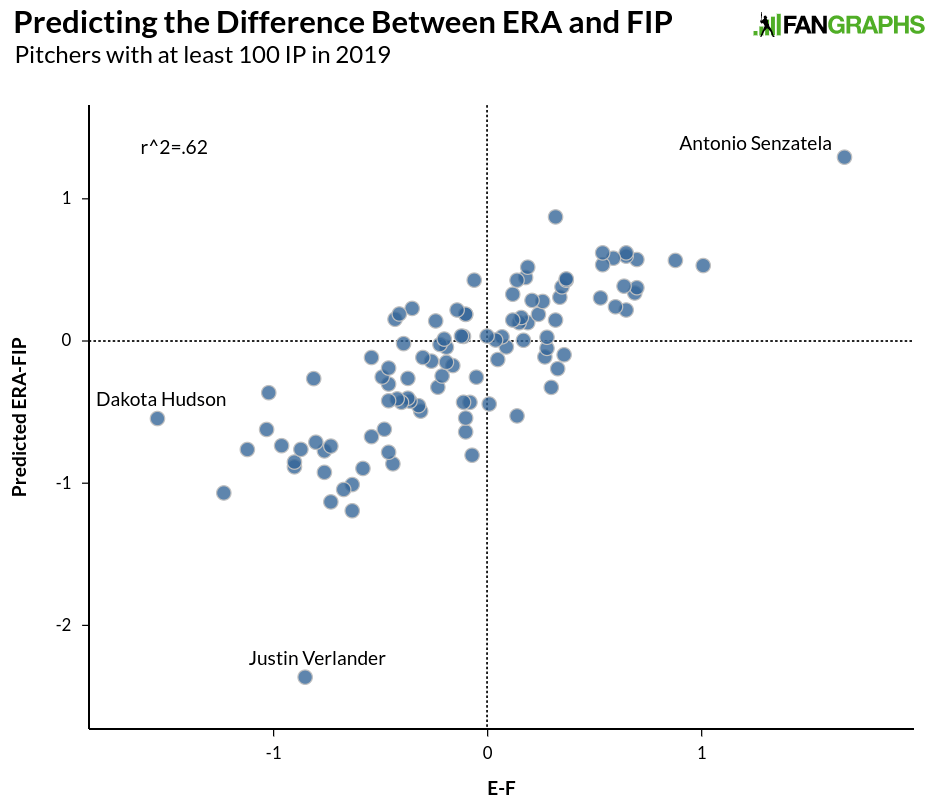
We still see some outliers, but overall, the formula did a very good job predicting the difference between ERA and FIP using LOB% and BABIP. There are a few outliers. Dakota Hudson jumps out, but his larger ERA-FIP discrepancy is pretty easily explained by 15 unearned runs. If he had a more normal five earned runs, the difference would be under a run and he’d be in the big group with everybody else. Justin Verlander, on the other hand, appears to be breaking the formula entirely. To see how, here are 3,500-plus individual pitcher seasons with over 100 innings since 1995, and their LOB% and BABIP:

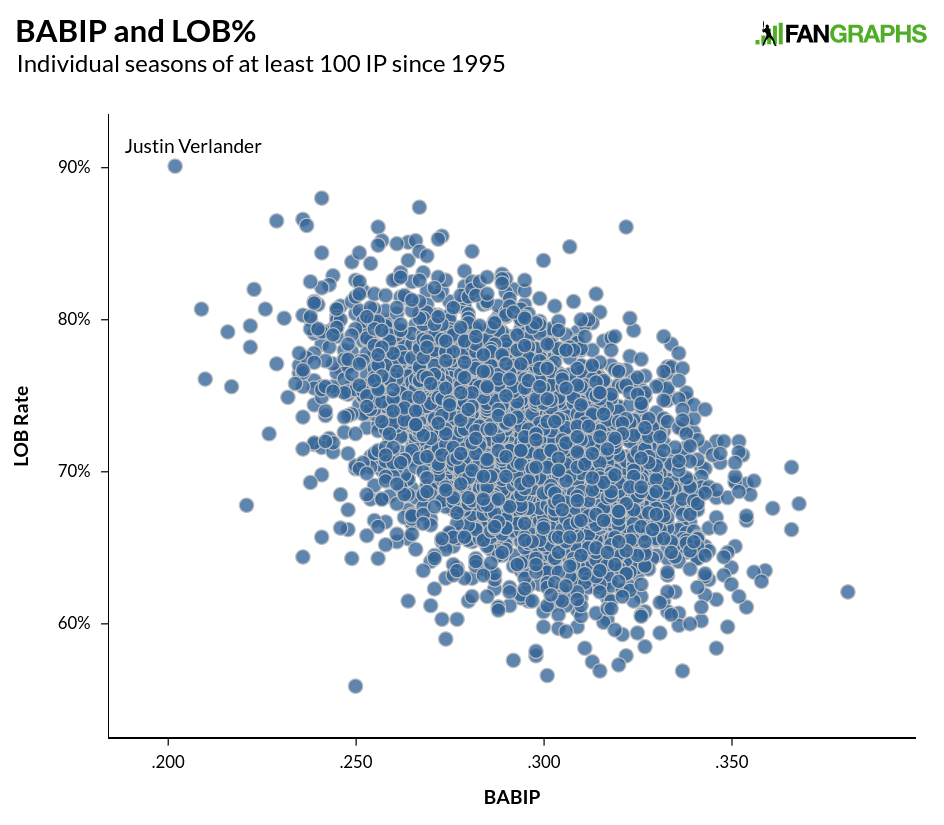
Quite simply, Verlander is having one of the most unusual seasons we’ve ever seen, with the highest LOB% and lowest BABIP in the last 100 years in the same season. As we can see above, there is some correlation between LOB% and BABIP, with an r-squared of .2, but that’s not as strong as either statistic’s relationship with FIP-ERA, and a pitcher’s BABIP’s relationship with his team’s BABIP is around the same strength, with team BABIP and team UZR having a slightly stronger relationship.

While there is certainly a case to be made that pitchers have control over the quality of contact they yield to some extent — no one would deny the existence of groundball pitchers or fly ball pitchers — BABIP doesn’t even necessarily measure contact quality. It counts every batted ball in the park as either a hit or an out, doesn’t include homers at all, and it varies greatly from year to year. Even xwOBA, which includes homers and dials in on the quality of contact, has difficulty finding a relationship year over year on contact. Looking just at in-season results, wOBA on contact has a difficult time becoming reliable.

It’s only natural to want to find a reason why a pitcher’s ERA and FIP are so different, and for that reason to be related to something the pitcher is or isn’t doing. Unfortunately, that isn’t always likely to be the case. In any single season, there are going to be outliers due to the relatively small sample of plate appearances we are dealing with, and almost all of the difference between ERA and FIP can be explained by BABIP and LOB%. While not all of a pitcher’s BABIP and LOB% are due to a pitcher’s defense, sequencing luck, and just general good fortune, a decent amount is just that. Baseball is a team sport and defenses play a large role in run prevention. While it isn’t always easy to admit, luck plays a role as well.


Is Center Field Cody Bellinger’s Best Position?

Cody Bellinger is in the midst of an MVP-caliber season. His 7.3 WAR is second in the majors, his 166 wRC+ ranks third, and he’s among the league leaders in almost every offensive category. Barring a major surprise (from, say, Anthony Rendon), the NL MVP should come down to him and Christian Yelich. In addition to his incredible production at the plate, Bellinger has improved by leaps and bounds in the field. He’s putting up elite defensive numbers in right field for the Dodgers, and now they’re planning on moving him to center field full-time for the rest of the season.

The inconsistent play of A.J. Pollock in center provoked this move. An elite center fielder in his time with the Diamondbacks, Pollock’s defense has slipped terribly this year (-8 DRS, -5.8 UZR); meanwhile, Bellinger’s defense has improved dramatically this year (19 DRS, 9.8 UZR). The Dodgers are hoping this shuffle will give them the optimal alignment in the outfield in their quest for a championship.

At this point in his career, it’s more accurate to call Bellinger an outfielder than a first baseman. A few weeks ago, his major league time spent on the grass surpassed his time spent on the dirt. When he was drafted out of high school, Bellinger’s defensive scouting reports often mentioned that he had the athleticism to play in the outfield, but only in a corner. Here’s how Bernie Pleskoff described his defensive potential in his MLB.com scouting profile: “If needed, he could be a successful outfielder. I don’t think he has the speed to play center, but I think he could succeed in right.”

Read the rest of this entry »