Archive for Featured Photo

Cardinals and Goldschmidt Catch Extension Fever

Extension fever is gripping major league baseball. In the wake of deals that short-circuited the highly anticipated free agencies of veterans Nolan Arenado and Mike Trout, and delayed the onset of those of Alex Bregman, Aaron Hicks, Eloy Jimenez, Miles Mikolas, Luis Severino, Blake Snell, and others, the latest player to take himself off the market is Paul Goldschmidt. The 31-year-old Cardinals first baseman has reportedly agreed to a five-year, $130 million extension for the 2020-24 seasons, a generous-looking deal in light of the past two winters’ frosty free agent proceedings.

Three and a half months after he was traded by the Diamondbacks in exchange for Carson Kelly, Luke Weaver, Andy Young, and a Competitive Balance B pick, it still feels weird to type “Cardinals first baseman” in connection to Goldschmidt, who over the course of his eight-year major league career had become the face of the Diamondbacks’ franchise. An eighth-round pick out of Texas State University who barely grazed prospect lists — Baseball Prospectus ranked him 10th in 2011 (a “Two-Star Prospect”), while Baseball America ranked him 11th, good enough to make their annual Prospect Handbook but not even the team top 10 published over the winter — he nonetheless made six All-Star teams, won three Gold Gloves, finished in the top three of the MVP voting three times, and helped the team to two playoff berths during his run in Arizona. However, the Diamondbacks couldn’t get past the Division Series either in 2011 or ’17 despite Goldschmidt homering four times and slugging .688 in eight postseason games.

Even given Arizona’s lack of postseason success, that’s the type of player most teams would try to lock up long-term. The Diamondbacks did ink Goldschmidt to a five-year, $32 million extension circa March 2013, and in February 2017, team CEO Derrick Hall spoke of hoping that “he’s here for the long haul,” but by January 2018, it appeared that they were gearing up for life without their star slugger. Read the rest of this entry »


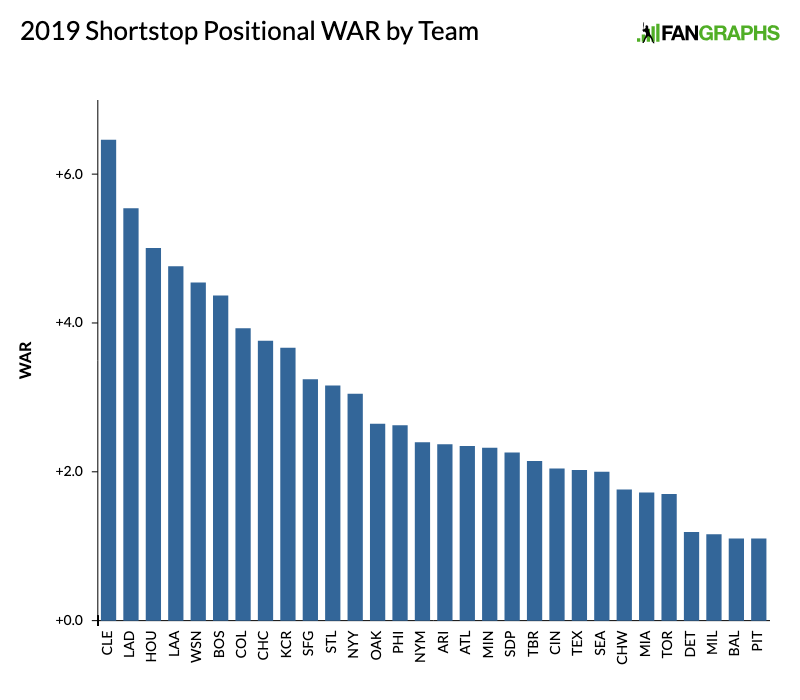
2019 Positional Power Rankings: Shortstop

After taking a look at center fielders and designated hitters yesterday, our positional power rankings continue with shortstop.

We’re in a golden era for shortstops. The late-1990s/early 2000s heyday of Alex Rodriguez, Derek Jeter, Nomar Garciaparra, and Miguel Tejada was not only pretty cool — at least before injuries and position changes broke up the band, and PED revelations retroactively dimmed our appreciation — but it ushered in an era of bigger, more powerful players at the position, and that trend has raised the bar for offensive production. Last year, shortstops hit a collective .259/.317/.416 for a 97 wRC+, five points higher than it had been in any other season since 2002 (as far back as our splits go), and trust me, it was worse than that previously, despite occasional concentrations of thumpers. In 2018, shortstops even outhit second basemen (93 wRC+) by a handy margin, something unseen within the narrow timeframe of our splits and constituting roughly a 10-point swing relative to the 2002-2017 period, in which second basemen outhit shortstops by a 95-89 margin according to wRC+.

It’s true that last year’s surge was helped by the inclusion of Manny Machado — who led all shortstops with a 141 wRC+, but has returned to third base as a Padre — and Javier Baez. But the top two hitters for the position from 2017, Zack Cozart (!) and Corey Seager, missed most of the season, with the former playing more third base than second base as well, and even Carlos Correa wasn’t really himself.

No, this is about the likes of Baez, Francisco Lindor, Xander Bogaerts, Trevor Story, Didi Gregroius, and even Jose Peraza — all of them 28 or younger, all but Gregorius 25 or younger — breaking out while offsetting the declines of Elvis Andrus and Brandon Crawford, the position’s geezers. More than ever, shortstop is a young man’s position. In 2018, nobody older than 31 (Crawford, Alcides Escobar, Jordy Mercer) made even 150 plate appearances as a shortstop. That trio all played at least 100 games at short, the lowest total of over-30 shortstops to do so since the majors expanded to 30 teams in 1998. As recently as 2016, there were six such players, and in 2014, 10; for the 1998-2017 period, the average was 7.4. Read the rest of this entry »


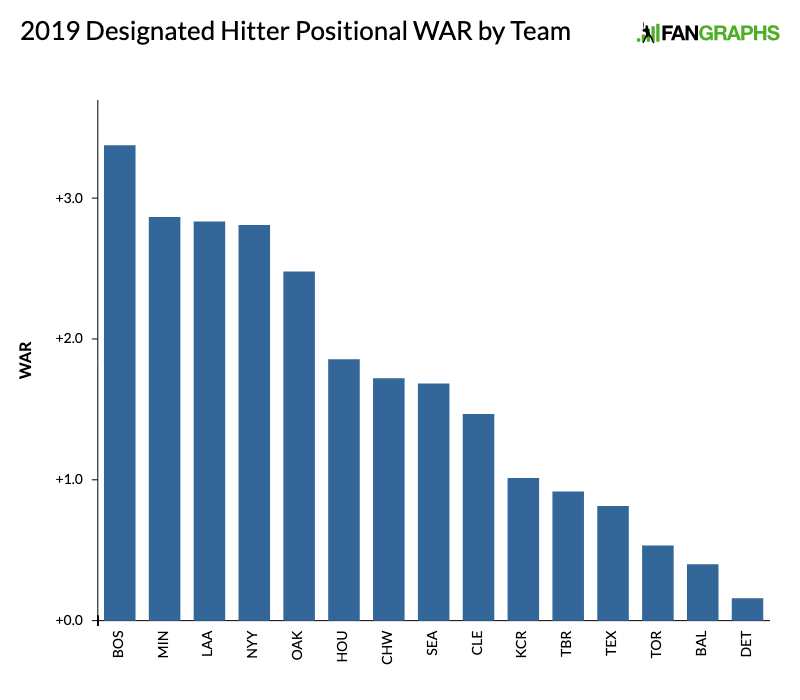
2019 Positional Power Rankings: Designated Hitter

Perhaps no position has been more impacted by the phenomenon of tanking than designated hitter. Teams that fancy themselves contenders splurge on elite bats like J.D. Martinez and Giancarlo Stanton, while teams out of contention rotate light-hitting utility infielders through without regard for the offensive demands of the position. The result is yet another year with a clear divide between the haves and the have-nots – a line that doesn’t really correlate well with how much is spent. Yes, the Red Sox, Yankees, and Twins brought in their primary DHs on lucrative contracts, but guys like Khris Davis and Shohei Ohtani cost far less. The Astros embraced the idea of using a homegrown positionless bat, employing Tyler White at a relative pittance. At the other end of the spectrum are teams like the Blue Jays and Orioles, who spent big a few years ago on positionless sluggers and now find themselves with sunk costs.

We can recognize four distinct tiers of DH in 2019. There’s the elite tier, which consists of one player alone – albeit one player who is arguably the best pure hitter in the majors. Then we have four teams with near-elite bats. What’s most interesting about those top two tiers is that none of those hitters came up as, or have experience at, first base; all but one are, at least nominally, outfielders. Those teams that do utilize erstwhile first basemen form a secondary tier of four well-above average hitters. The rest of the league employs hitters who either aren’t something yet, or used to be something, but aren’t now. If there’s a lesson to be learned from these rankings, it’s that spending on elite bats works. Spending on designated hitters doesn’t. Read the rest of this entry »


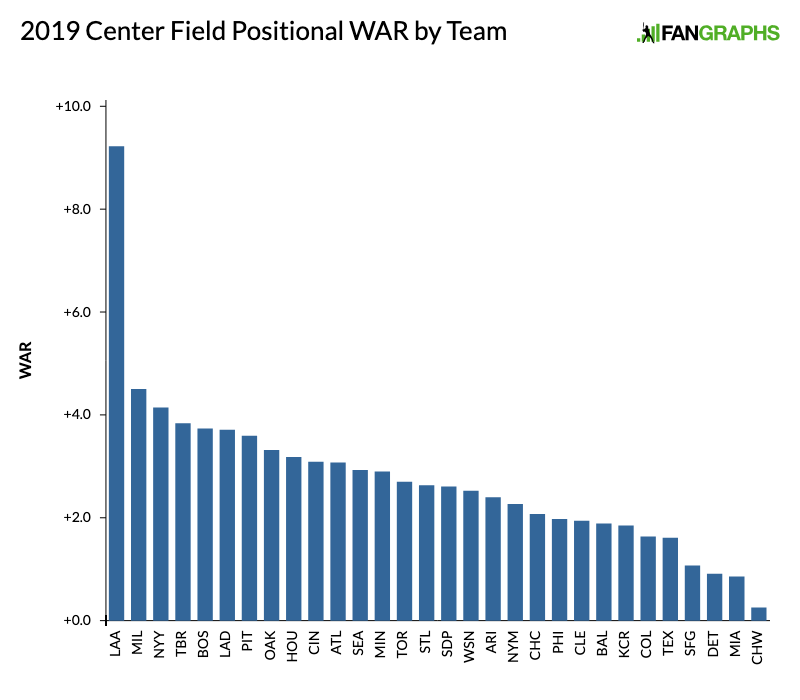
2019 Positional Power Rankings: Center Field

Our yearly project of ranking each team at each position continues with center fielders, the position of Mays and Mantle, the position at the crossroads of the offensive and defense parts of baseball’s positional spectrum. Let’s get straight down to the business of ranking the players who come after Mike Trout.

Nowadays, center field is largely seen as a position made up of Mike Trout and Everybody Else. And with a major identity crisis, that conclusion isn’t so far off. There’s no clash of center field greats, with Trout largely lapping the field. Looking at many of the leaders in WAR at the position over the last five years, a great many won’t play center field in 2019 or have already moved off the position: Andrew McCutchen, Charlie Blackmon, Adam Jones, Marcell Ozuna, Christian Yelich, and so on. After Trout and Lorenzo Cain, who jumps out as an all-around star at the position, the way a Carlos Beltran or Jim Edmonds did?

Nor, with baseball’s traditional roles changing, can center field claim to be the most popular home for leadoff hitters. In 2018, leadoff hitters played centerfield only 24% of the time, the lowest figure in the Split Leaderboards (which go back to 2002) and well off the 41% mark for 2013, just six years ago. Center fielders hit .253/.319/.407 in 2018, the position’s second-worst OPS since 2002, and amassed -3.4 wRAA, also their second-worst. Read the rest of this entry »


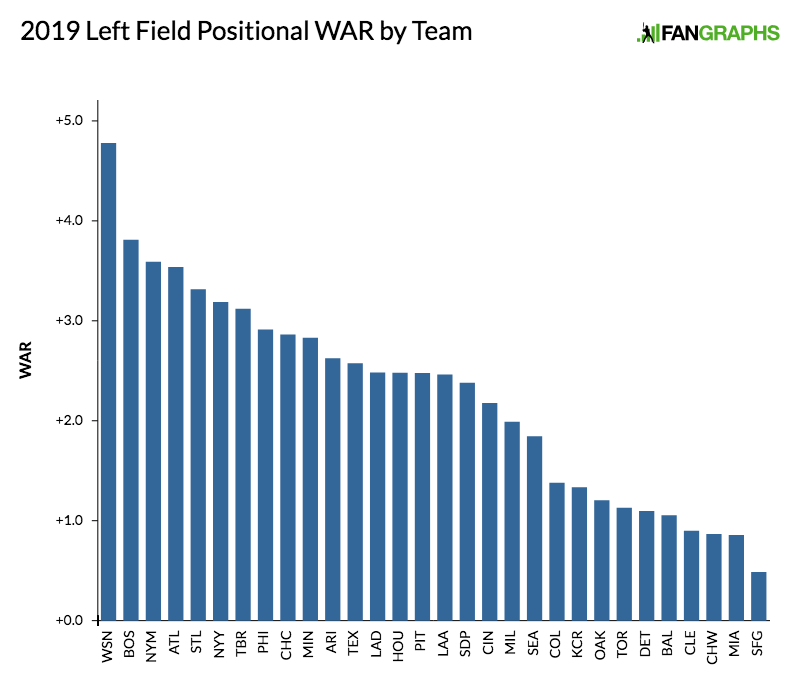
2019 Positional Power Rankings: Left Field

This morning, we considered the catcher position. This afternoon, the positional power rankings take us out to left field.

Has batted ball data and modern defensive positioning altered the defensive spectrum? It likely won’t surprise readers to learn that the average wRC+ by position starts with first base and right field, but it may be revelatory to learn that the gap between right and left field has been pretty wide. The last four years, the average right fielder has produced an average wRC+ 4.75 ticks higher than his counterpart in left. The offensive bar at third base has also been higher on average than in left field during the last four years.

Why? Perhaps improved defensive positioning on the infield has enabled more bat-centric players to play third base when, in years past, they’d be at first. Most hitters are right-handed, and increased focus on pulling the ball in the air could have quickly made defensive range in left field more important than it has been in the past. The average sprint speed among left fielders is now on par with that at shortstop. Is it a long term, tectonic shift that should impact things like prospect evaluation? It’s hard to say definitively at this point because so much about the game is changing and still has the potential to change. But it’s worth discussing — eventually. For now, here are our current left fielders. Read the rest of this entry »


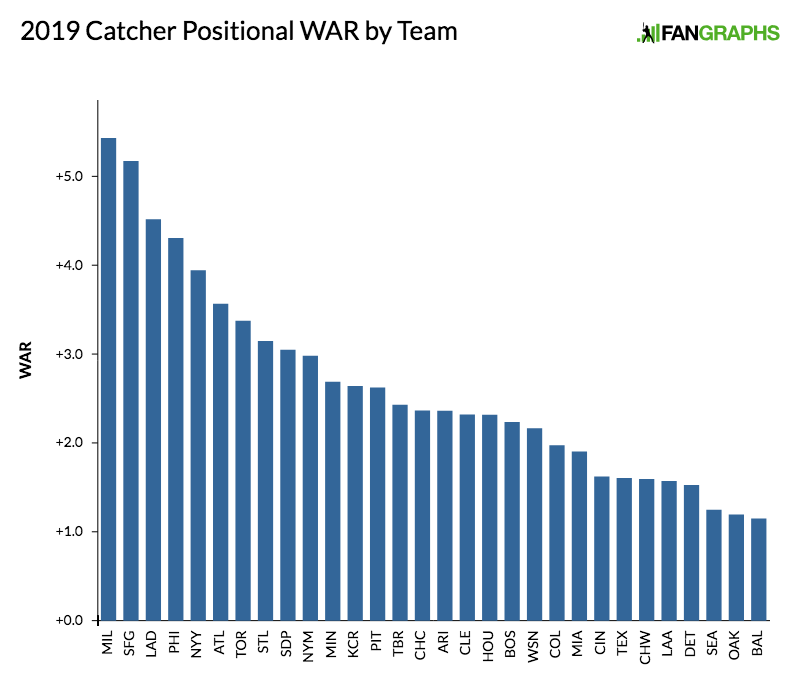
2019 Positional Power Rankings: Catcher

After Craig Edwards and Rian Watt surveyed the current state of second and third basemen yesterday, our positional power rankings continue today with catcher.

The catching position hit an 11-year low in wRC+ (84) and also dipped below 50 WAR for the first time in that same span (49.9). Just two guys topped 4.0 WAR, and neither Yasmani Grandal (4.9) nor J.T. Realmuto (4.8) reached a full 5.0 wins. Compare that to just five years ago, when five guys had at least 5.0 WAR and two of them rounded to eight wins: Yan Gomes (5.3), Rene Rivera (5.3), Russell Martin (6.5), Buster Posey (7.8), and Jonathan Lucroy (8.1). Part of the issue is that teams are much more open to splitting the duties among multiple players, which makes it tougher for even the top end to generate big numbers. In 2014, there were 23 catchers with at least 400 plate appearances, but that figure dipped to just 15 a year ago.

The 2019 pool has already lost a stalwart with Salvador Perez needing Tommy John surgery, although he hasn’t topped 1.0 WAR since 2014 and has surpassed an 89 wRC+ just once in that same time frame (103 in 2017). The position is aging and hasn’t backfilled with prospects quickly enough to replace the old guard. Looking at those top performers from 2014, we see that they are all still playing but managed just a combined 6.9 (nice) WAR despite four of the five logging at least 350 plate appearances.

Do not fret, though, the backfill is on the way! Danny Jansen debuted last year but will play out his rookie season in 2019. Francisco Mejia has essentially had sips of coffee each of the last two years and still holds rookie eligibility. Meanwhile, 10 other catchers made it into our Top 100 Prospects list, including three in the Top 50: Keibert Ruiz for the Dodgers (15), Sean Murphy for the Athletics (35), and Joey Bart for the Giants (41). Read the rest of this entry »


Mike Trout Leaves Money On the Table Again

Mike Trout is a better player than Bryce Harper and Manny Machado combined. He’s been more than twice as valuable as each of those players in their young careers. And yet Mike Trout is about to agree to a contract that, per ESPN’s Jeff Passan, will pay him like he’s one of the greatest players of this generation instead of potentially being the greatest player of this century, and one of the greatest baseball talents of all time. As first reported by Passan, Mike Trout and the Angels have agreed to a 12-year deal worth $430 million, with Bill Shaikan reporting the deal will come in at $426.5 million. Because Trout was already owed $66.5 million over the next two seasons, the contract is functionally a 10-year extension worth $360 million. Trout is essentially accepting something similar to the Harper/Machado deals two years in advance. This is not the first time Trout has made this choice, which is very much a personal decision, but it is one that has cost him potentially hundreds of millions of dollars.

In 2014, Trout was coming off an eight-win season, which itself came on the heels of two 10-win campaigns. His 29.2 WAR mark through his age-22 season was the best in baseball history. Before he signed a six-year, $144.5 million contract giving away three free agent seasons, Dave Cameron wrote about the potential for a contract extension, and expected a figure more than $100 million higher. When Trout actually signed, Cameron followed up:

You don’t need another 1,500 word explanation of why this is a hilarious steal for the Angels. Trout would have made something like $50 to $60 million in arbitration had he gone year to year, so the Angels are basically getting three free agent years for $85 to $95 million. This doesn’t come anywhere near Trout’s value, and Trout has left an enormous amount of money on the table. Even if his goal was to reach free agency again and sign a second monstrous contract, he still is worth so far more than the roughly $30 million per year he signed away three free agent years for.

That bargain five years ago made the current one possible. Because Trout had two more years left until free agency (instead of entering the market last offseason), he was limited to the Angels when it came to contract partners. Because the Angels’ risk of losing Trout wasn’t going to present itself for another two seasons, any new contract with him was going to come with a discount. In this case, the discount meant signing a deal like Harper and Machado’s instead of one like Alex Rodriguez’s.

After Harper and Machado signed their contracts, I attempted to compare the two deals because it can be difficult to put a 13-year deal and a 10-year deal for differing amounts into proper context. The present-day values of each contract is below, with the numbers translated into a 10-year deal, and Trout’s contract listed with just the extension (2021-2030), as well as with the two years Trout was already guaranteed (2019-2030). The numbers have been updated now that we know Trout is paid $36 million the next two seasons and $35.45 million each year beginning in 2021.

Present-Day Value of the Mike Trout Contract
Total Value Present-Day Value 10-Year Equivalent
Bryce Harper $330 M $220.8 M $305 M
Manny Machado $300 M $217.4 M $300 M
Mike Trout (2021-2030) $360 M $225.5 M $311 M
Mike Trout (2019-2030) $426.5 M $289.6 M $400 M

The Angels appear to have looked at Mike Trout and said, “We know we owe you about $65 million over the next few seasons. Keep that and we will give you the Harper/Machado contract right now.” Trout said yes, and now the Angels have one the best players in baseball history locked in for his age-29 through age-38 seasons. Even when you factor in the two years Trout is already owed, that $400 million is significantly below his value, assuming that Machado and Harper are worth $300 million. Those two years left until free agency meant a massive discount for the Angels.

When we call this deal a bargain, we can look at Mike Trout’s contract relative to Harper and Machado’s, and know that Trout is only receiving a little more money despite being a lot better. We can also look at potential future value. I love to look at comps and try to get a sense of a player’s future, but comps aren’t really fair for Mike Trout because there are barely a handful of players who even come close to his level of play. Consider Trout’s career trajectory by year, and the number of players ahead of him by WAR.

Mike Trout By Age
Age Season Trout WAR Players Better Since 1901
Through Age-20 10.8 Mel Ott
Through Age-21 21 NA
Through Age-22 29.2 NA
Through Age-23 38.5 NA
Through Age-24 48.2 NA
Through Age-25 55.1 Ty Cobb
Through Age-26 64.9 NA

Ty Cobb the only comp for Mike Trout. Ty Cobb! Trout ranks third right now through age-27 even though he hasn’t even played the season yet, and he needs just four wins to pass Cobb and Mickey Mantle. He’s already surpassed the average Hall of Famer. Maybe you think that the early start to Trout’s career inflates the numbers. Even taking away his first two seasons, from age-22 through age-26, the only players with more WAR are Mantle and Cobb. Even just looking at the last three years, which includes an injury-shortened 2017 campaign, only Babe Ruth, Mantle, Rogers Hornsby, Jimmie Foxx, Lou Gehrig, Tris Speaker, Alex Rodriguez, and Cobb are ahead of Trout. If Trout plays like any of those players, he’ll cost something like $4 million to $5 million per win over the last 10 years of the deal. If we wanted to conservatively estimate the current value of a win on the free agent market at $9 million without any inflation, Trout wouldn’t need to age like one of the 10-best players in history — aging like the 50th would still be a good value.

The deal is such a slam dunk for the Angels that it feels a little silly to talk about what it means in baseball terms. The Angels get to keep one of the best players in history. They can now plan for the future knowing they have Trout. It would have been fun to see what an all-in Angels team would’ve looked like in 2020 with Trout a pending free agent, but hopefully this deal means we get to see the fun of a franchise that is secure in its star ensuring that that star gets a ring. After all, Mike Trout in the playoffs is good for baseball.

When it comes to adjusting the biggest contracts in baseball history for inflation, this one is a little tough to assess. We have that $430 million, but we also have that $363.5 million that doesn’t kick in until 2021. To provide some historical context — as I did for Machado and Harper earlier this offseason and later updated — I’ve included two Trout contracts below. The first is the $426.5 million figure representing the total value of the money owed to Trout; the second is Trout’s extension, assuming 5% inflation in the following two seasons.

Biggest Contract in MLB Adjusted to 2019
Player Year Years Total Value ($/M) 2019 Adjustment ($/M) AAV 2019 ADJ ($/M)
Alex Rodriguez 2001 10 $252 M $592 M $59.2 M
Alex Rodriguez 2008 10 $275 M $448 M $44.8 M
Derek Jeter 2001 10 $189 M $444 M $44.4 M
Mike Trout 2019 12 $426.5 M $426.5 M $35.5 M
Giancarlo Stanton 2015 13 $325 M $393 M $30.3 M
Manny Ramirez 2001 8 $160 M $376 M $47 M
Albert Pujols 2012 10 $240 M $358 M $35.8 M
Bryce Harper 2019 13 $330 M $330 M $25.4 M
Ken Griffey, Jr. 2000 9 $116.5 M $330 M $36.6 M
Mike Trout (extension only) 2021 10 $360 M $327 M $32.7 M
Prince Fielder 2012 9 $214 M $319 M $35.4 M
Robinson Cano 2014 10 $240 M $310 M $31 M
Manny Machado 2019 10 $300 M $300 M $30 M
Kevin Brown 1999 7 $105 M $297 M $42.5 M
Joey Votto 2014 10 $225 M $290 M $29 M
Mark Teixeira 2009 8 $180 M $290 M $36.2 M
Joe Mauer 2011 8 $184 M $289 M $36.1 M
Mike Hampton 2001 8 $121 M $284 M $35.5 M
Clayton Kershaw 2014 7 $215 M $277 M $39.6 M
Todd Helton 2003 9 $141.5 M $277 M $30.8 M
Jason Giambi 2002 7 $120 M $276 M $39.4 M
Carlos Beltran 2005 7 $119 M $263 M $37.6 M
Nolan Arenado 2019 8 $260 M $260 M $32.5 M

When stacked up against comparable players and comparable contracts, Mike Trout was a humongous bargain in his last contract and will be one in his the next, but if we can play devil’s advocate a little, it’s tougher to determine how much Trout actually cost himself. Let’s say he had been a free agent last offseason like he would have without a contract extension. What would his contract have been? There’s a reasonable argument for 15 years and $600 million. Look at the Alex Rodriguez contract above. In another two years, might $500 million been on the table? That might have been what Trout was looking at, but what if last year the market didn’t quite develop as he had hoped, and he ended up with just $500 million? What if the top offer had only been $400 million after 2020? Does that seem so far-fetched given the way these past two offseasons have progressed?

Trout is now set to make around $460 million for the remainder of his free agent years. He jumped the gun twice and took a discount. The value he will provide will far exceed the money he is set to earn. It’s possible, however, because of the way spending has progressed, that Trout has actually cost himself little to no money by signing these extensions. Mike Trout was always going to be a bargain; we have a hard time wrapping our heads around the number he’s really worth. He’s the best player in baseball, and simultaneously the most underrated one. That’s a ridiculous feat, but with Mike Trout, we’ve grown accustomed to ridiculous feats.

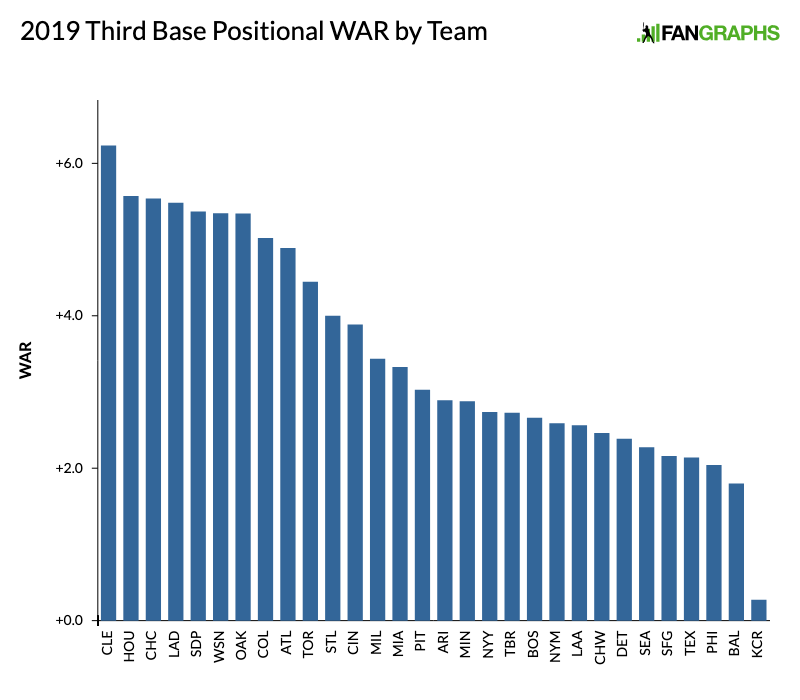
2019 Positional Power Rankings: Third Base

You’ve read the intro. You’ve read about first basemen and second basemen. You know how to count. You know what time it is. As our positional power rankings continue, let’s talk about third base.


This, friends, is a very good time to like watching baseball men play a good third base. Fully half of the top 10 players by WAR last year were third basemen, and only three of those five men make the top five of our rankings. The 8th-ranked player on this list, Nolan Arenado, is projected for nearly five wins this year, and the 10th-ranked player is the consensus top prospect in the game. Your mileage may vary, but I see roughly four tiers here: An elite No. 1-8, any one of whom can at times threaten to be among the best players in the game; a very strong second tier No. 9-13, the top of which contains players who have been in the past or could be in the future very good; a perfectly solid and mostly indistinguishable third tier running from No. 14 to No. 29, containing every possible diversity of age, experience, upside, and talent; and then the Royals. Let’s dive in. This will be fun. Read the rest of this entry »


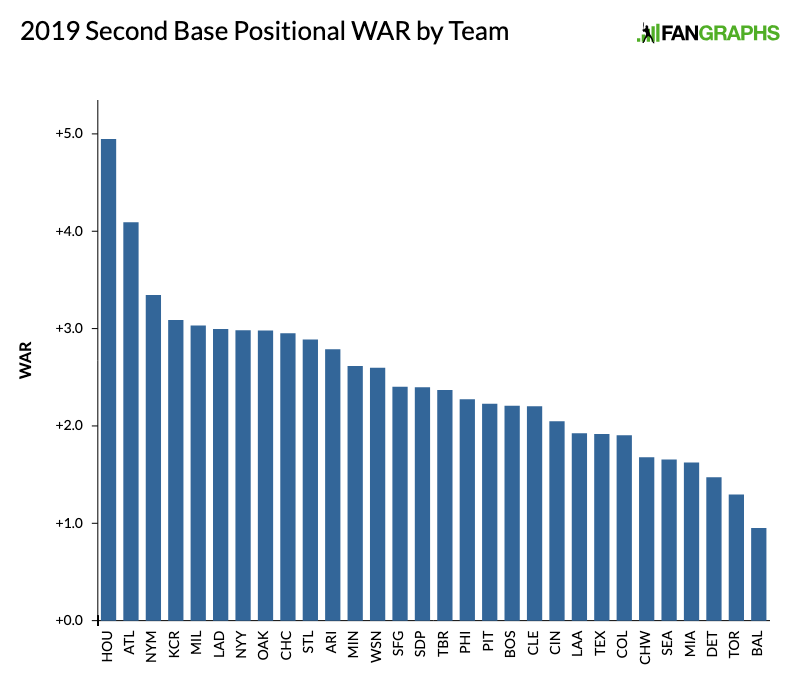
2019 Positional Power Rankings: Second Base

On Monday, Jay Jaffe kicked off our positional power rankings series by evaluating first basemen. If you need a refresher on the process or the concept behind the series, Meg Rowley wrote a handy explainer. Today, we stay on the infield and tackle second base.

The stereotype surrounding second base is that these players aren’t good enough defensive players to man shortstop and aren’t good enough hitters to play third base. There are those that defy those conventions. Jose Altuve is one of the best players in the game. Javier Baez and Ozzie Albies can handle short. Robinson Cano has been one of the better hitters in baseball for a decade. Mike Moustakas probably should be a third baseman, but weirdly won’t be one this year. There are many, however, for whom those traditional designations fit. Only two teams have four-win projections at the position, with a bunch of high-floor three-win types. That doesn’t scream stardom, but there’s a lot of hidden upside in these projections. In addition to Albies, we see possible stars in Gleyber Torres and Luis Urias. Javier Baez only gets partial playing time at second. Scott Kingery, Carter Kieboom, Keston Hiura, Bo Bichette, and Nick Madrigal don’t play a huge role below, but they do represent talented young players who could help their teams to the top of these rankings in the years to come. Read the rest of this entry »


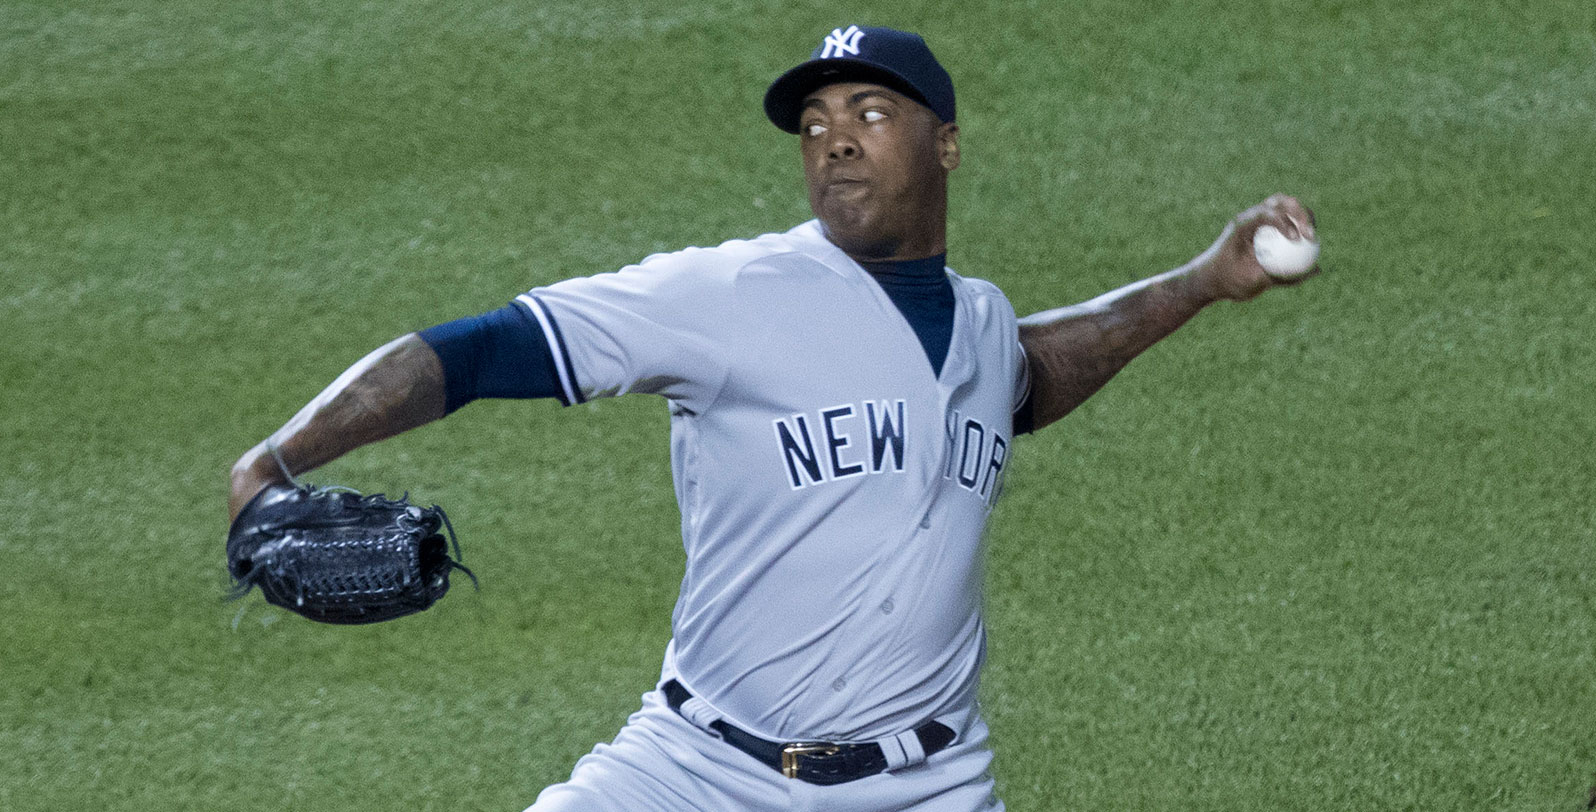
Aroldis Chapman’s Other Best Pitch

Before the 2017 season, Aroldis Chapman signed a near-record-setting contract to play for the Yankees. The club knew what they were getting, both on and off the field — they had traded Chapman to the Cubs earlier that year, and now they were bringing him back. More broadly, baseball knew what the Yankees were getting — a dominant closer with a dominant fastball. Just how much of an outlier was Chapman’s fastball? Well, when MLB created a fastest pitches leaderboard to show off Statcast, they added a button called the “Chapman filter.” In 2016, Chapman threw the thirty fastest pitches in the majors. It’s not much fun looking at a leaderboard that’s just one guy’s name over and over again.

Fast forward a year, and all the signs were trending downward. Chapman put up a 3.22 ERA and a 2.56 FIP in 2017, both the highest marks since his rookie year. He struck out a career-low 32.9% of the batters he faced (which is still pretty good for a career-low). His average fastball velocity declined by a mile an hour. By early 2018, he’d even been dethroned atop the fastest pitch leaderboard by Jordan Hicks. The human brain is an amazing pattern-matching machine, and we’ve seen this one plenty of times. Closers often break — it’s one of the reasons Chapman’s five-year contract was considered a risk when he signed it. The king has his reign, and then he dies. It’s natural.

Well, a funny thing happened on the way to irrelevance. Aroldis Chapman reinvented himself in 2018, and while he didn’t quite get back to his game-breaking 2014 highs, he recorded a 2.45 ERA and an even more absurd 2.09 FIP. He struck out 43.9% of the batters he faced, the second-highest rate of his career. How did he do it? Did he reach back a little further and take the velocity lead back from Hicks? Not even close, as his average fastball velocity declined another tick in 2018, and he finished a distant third in that category, the first time he wasn’t the hardest thrower in baseball since 2011. Instead, he leaned on his slider — one that may be the best in the game today. Read the rest of this entry »