Spend any time in a big-league ballpark in the hours before first pitch, and you’ll likely see a pitcher standing in short right or left field, throwing a flat ground. He’ll start his delivery just inside the foul line, feet planted on green grass. His catcher will be around 45 or 50 feet away, half-crouched in the shallow part of the outfield usually reserved for soft line drives. The pitcher will wind and deliver eight or nine times, usually at something like 80% effort, before huddling with his catcher and perhaps a coach or two. Then, gloves loose in their hands, the men will walk back to the dugout to continue their pregame routines.
That scene plays out hundreds of times a day in ballparks across the country. But the practice of throwing flat grounds has come under scrutiny recently, as coaches and front office personnel increasingly worry about the risk of an injury. Over the last few months, I asked a dozen or so players, coaches, and executives about flat grounds and how they’re used. After those conversations, I’m confident in two things: One, most teams who’ve thought hard about the practice have concluded that it has a neutral effect at best and could potentially be harmful. And two, that flat grounds probably aren’t going away anytime soon.
First, the case for flat grounds. For the most part, pitchers I asked told me that they just want to get a better sense of how individual pitches feel coming out of their hands. For that, they insisted, it doesn’t matter whether you’re throwing off a mound or on the field, and faced with the choice between schlepping out to a bullpen mound or simply stepping from the dugout into short right or left field, they prefer the latter. Many discounted immediately my theory that the lack of a drop-down from the mound interrupts upper-half timing based on the moment the front foot hits the ground. “I’ve been throwing flat grounds all my life,” said Marco Gonzales, “and I’ve never noticed a difference.”
But a number of coaches I spoke to expressed variations of the same concern: That practicing pitches on flat ground when they will eventually need to be thrown off a mound gives players bad information about what their repertoire will actually look like in-game.
“We’ve found that the feel guys get for the plate isn’t accurate [while throwing flat grounds],” said the Mariners’ Brian DeLunas. “For sliders and split-fingers especially, you’re just not going to get the same break. I have guys out there who’ll try to throw those pitches, and they’ll be like, damn, this pitch isn’t working! But if your slider isn’t breaking on a 50-foot throw, that’s actually good, because it really should be breaking in the last 15 or so feet.”
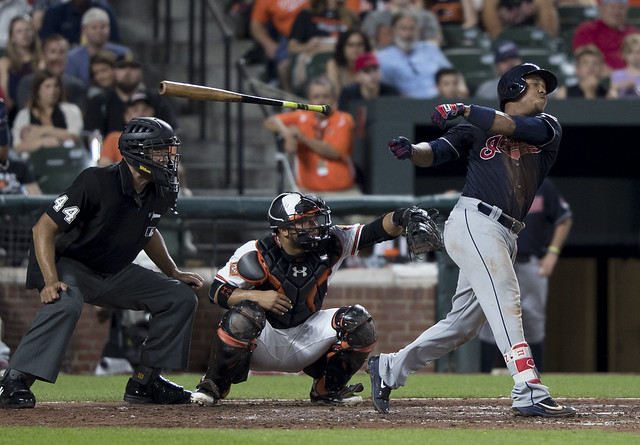
There are also elements of standard pitching deliveries that have in-game consequences but simply can’t be practiced on flat ground. “With a flat ground,” said Carl Willis, the Indians’ pitching coach, “the risk is that because you’re not able to get as much extension [on the front half], the consistency of work can suffer. Sometimes you’ll see a guy lose his posture as he comes down the slope, and you want to be able to maintain that posture throughout games. The only way you can really know it, and feel it, is to practice it on the mound.”
But the argument for flat grounds has never been that they replicate an in-game environment. The case is that they’re convenient, and require substantially less effort — and therefore presumably create less wear-and-tear for tired arms — than throwing full-speed off a mound. But is that last claim actually true?
In 2017, Driveline Baseball released a study (building off of a 2014 article in the American Journal of Sports Medicine) that suggested that, holding velocity constant, flat ground pitching generates about 6% more stress on elbows and shoulders than throwing off the mound. Critically, the study also found that stress does not decrease linearly with reduced effort, which means that if pitchers are throwing at 80-90% velocity on flat ground, the stress on their arms is likely about the same as it would be throwing full speed off the mound. Internal studies reaching similar conclusions have led the Mariners, at least, to try eliminating the practice altogether throughout their system (though with limited effect). Other teams have not gone quite as far, despite acknowledging the public evidence.
“If you’re talking about these guys throwing high-effort, it’s a proven fact that flat grounds can be more harmful at the same rate of speed than on the mound,” said Oakland’s pitching coach Scott Emerson. “But if you slow it down, it’s ok. They mostly just use it for target practice. And I’m just using it to see how the pitches look coming out of their hands. Nothing more than that.”
“In my experience, the flat ground can take a little bit of stress off of the arm for guys who are trying to recover,” said Willis. “That’s simply because they’re not working down the slope. That foot plant [which comes 4-6 inches above where it would off the mound] does hinder some extension a little bit, but if you can maintain that delivery, sometimes it tends to help with the recovery, coming back to make your next start.”
To my ear, the persistence of the practice league-wide in the face of reasonably sound evidence that its main theoretical benefit (the lower effort required) isn’t actually a benefit at all seems less about arm stress than convenience.
Most big-league teams carry 12-13 pitchers, and most big-league parks are equipped with just five outdoor mounds: two in the bullpen for each team, and one in the center of the diamond. If teams insisted that their pitchers throw exclusively off of mounds, they’d still only have two mounds to use (the mound on the field being, of course, in use for batting practice, and the remaining four divided between two teams). That would add an element of coordination to a pre-game period already rife with competing priorities for players’ time. “Besides,” one coach told me, “most of our players just aren’t going to walk their asses the 150 yards from the dugout to the bullpen to do their work.”
There’s also a degree of inertia: flat grounds persist because they’re something players have always done. This starts in amateur leagues, where the imbalance between mounds available and players using them is even more stark than in the pros, and where there is even less knowledge of the potentially harmful effects. Gonzales’s response to my question, quoted above, was typical of player responses for this story. Most reacted to my questions about flat grounds as if I had asked them if they put their pants on one leg at a time in the morning, or why they eat breakfast before lunch; they just do, and don’t think much about it. “I’d love it if we had six or seven mounds so we could do all our work there,” said Emerson. “But we don’t. For a lot of our guys this is just a part of their daily routines.”
But as conservative as baseball can be about its traditions and routines, the last two decades of constant self-evaluation and reinvention by coaches and front offices demonstrates that even long-held practices can change when they’re no longer deemed useful. “I don’t think that clubs have really thought hard enough about the risks to flat grounds,” said Bobby Evans, the former Giants’ general manager. “I think the assumption is that it’s just a warmup, when it might really be something that can put players at risk of injury. I want to know more.”
I do, too. There’s a benefit to allowing players to continue long-established routines, to be sure, and it’s probably one I underrate as an external observer of the game. But the evidence for flat grounds as a practice seems flimsy, and I’m not sure I’d be all that invested in it even if the evidence were good. At the very least, I’d welcome the opportunity to learn more about its biomechanical effects. For now, I’m with DeLunas: “Can you imagine a golfer going to the range and spending their afternoon hitting the ball with the back of the club over and over? They would never, ever do that. So why do we?”
The wonderful David Laurila contributed reporting by interviewing Cleveland’s Carl Willis.
 Jay Jaffe: Howdy folks, good afternoon and welcome to another edition of my Thursday chat. I’m still digesting my amazing weekend at the Hall of Fame inductions in Cooperstown and neck deep in Replacement Level Killers, the fifth installment of which — corner outfielders — should be up soon. Obviously, there are a lot of questions about the July 31 trade deadline, so let’s get to it.