FanGraphs Baseball

Astros Pay Alex Bregman Now To Avoid Paying Him Later

Coming on the heels of Mike Trout’s humongous contract extension, news broke that Alex Bregman and the Astros had agreed to an extension of their own worth $100 million, with Mark Berman first to report the deal. While the Trout contract is the biggest of all time, the Bregman deal is not without intrigue. Bregman, who was still a full year away from arbitration, is the first star-level player to sign a pre-arb contract extension in nearly five years. The last player at or above Bregman’s level of production to sign a contract like this was Trout, who signed his six-year, $144.5 million contract back in 2014.

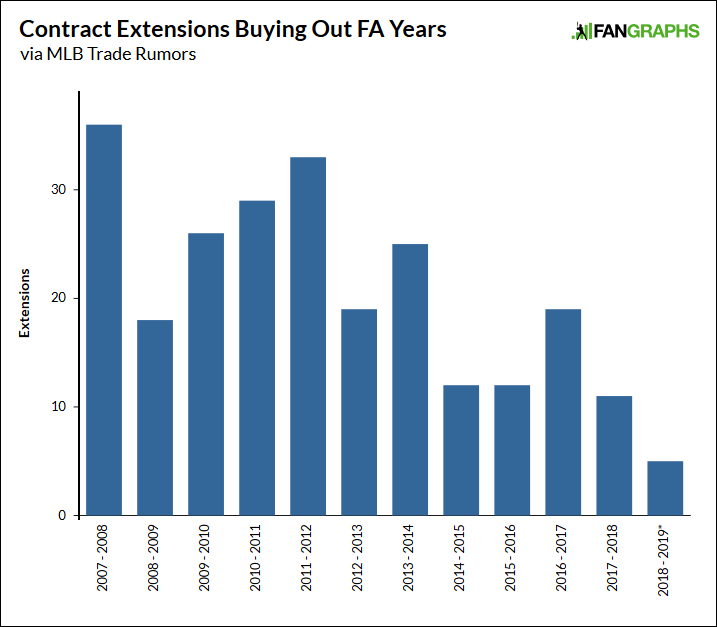
Since 2014, the number of contract extensions buying out free agent years has decreased. When Luis Severino signed his deal earlier this offseason, Jeff Sullivan ran the numbers on the quantity of extensions by offseason, providing this graph.

In the five years leading up to the 2014 season, there were about 25 or so extensions per season, and in the five years since, the numbers have dropped in half. Since Severino signed, we have had Jose Leclerc, and now Alex Bregman, but those extension figures aren’t going up a ton this year. It isn’t just that the number of extensions have gone down; the quality of players signing those extensions has declined as well. We saw Trout’s big deal ahead of the 2014 season; the year before, Buster Posey, who was Super-2 arbitration eligible, signed an even bigger contract covering more seasons. It was Andrew McCutchen the year before Posey. Matt Carpenter and Jason Kipnis, who were several years older than Bregman but also coming off very good years, signed six-year deals with options guaranteeing themselves around $50 million each. Read the rest of this entry »


Houston Rewards Pressly’s Liftoff with Two-Year Deal

It wasn’t the biggest extension announced yesterday — it wasn’t even the biggest Astros extension announced yesterday — but Ryan Pressly’s two-year, $17.5 million deal with Houston, which was first reported by Chandler Rome, was a big deal for Pressly, a big deal for Houston, and a big deal for relievers. The deal will pay Pressly $2.9 million in 2019, his final arbitration year, then $8.75 million in each of 2020 and 2021. There’s a vesting club option for 2021, as well. It’s believed to be the biggest extension ever signed by a reliever not expected to close games for his team (that’s still Roberto Osuna’s job, at least for the time being) and is a tremendous accomplishment for a player who had a 4.70 ERA (with a 4.36 FIP) as recently as 2017.

But of course that 2017 performance isn’t what the Astros are paying for. They’re paying for what he did in Houston last August and September (which is strike out 32 men and walk just three in 23.1 innings pitched) and what they think he can do for them going forward (which is presumably more of the same). Héctor Rondón, Joe Smith, Collin McHugh, and Will Harris are all expected to become free agents at the conclusion of the 2019 season, and locking Pressly up now means the Astros will have one less thing to worry about next winter. For Pressly, this deal gives him the job security that has absolutely never been a guarantee in the years since he signed with the Red Sox as an 11th-round pick back in 2007.

The conventional wisdom is that relievers are inherently volatile — with a few, Mariano Rivera-shaped exceptions — and so giving them multi-year contracts is the kind of thing you only do when you’re competing for their services on the open market. You certainly wouldn’t expect to see a forward-thinking team like the Astros locking up a reliever with such a short track record of success — during his time in Minnesota at the beginning of 2018, Pressly had a 3.40 ERA and a 2.95 FIP — for two additional years when they’re competing against nobody but themselves. Read the rest of this entry »


Kiley McDaniel Chat – 3/20/19

2:10

Kiley McDaniel: Coming to you live from ATL a little later than usual because I’m moving onto my third contractor now. Scout has chased all the squirrels and chipmunks and is taking a nap next to me. On to your questions:

2:10

Ben M: It feels like to date we aren’t getting the same type of negative reports on the high schoolers that caused players like gorman to slide last year. Is that accurate?

2:12

Kiley McDaniel: Not a question I get very often. I think Gorman may have stood out more because he was a top 10 overall prospect for us wire to wire but had some clear deficiencies that got a little worse during the spring

2:12

Kiley McDaniel: That said, we kept him in the top 10 (we settled on him at 7th, he went 19th overall) because we thought those things were fixable and the strengths were too good to pass up

2:13

Kiley McDaniel: So I wouldn’t say that was a unique amount of negative info on a top prospect. We have said Abrams probably can’t play SS longterm, Witt has real hit tool questions, Espino has a really long arm stroke and may throw too hard too early, etc. which is on par with the Gorman stuff

2:13

shf9: What’s going on with Carter Stewart?  He’s falling fast down your draft rankings.

Read the rest of this entry »


2019 Positional Power Rankings: Left Field

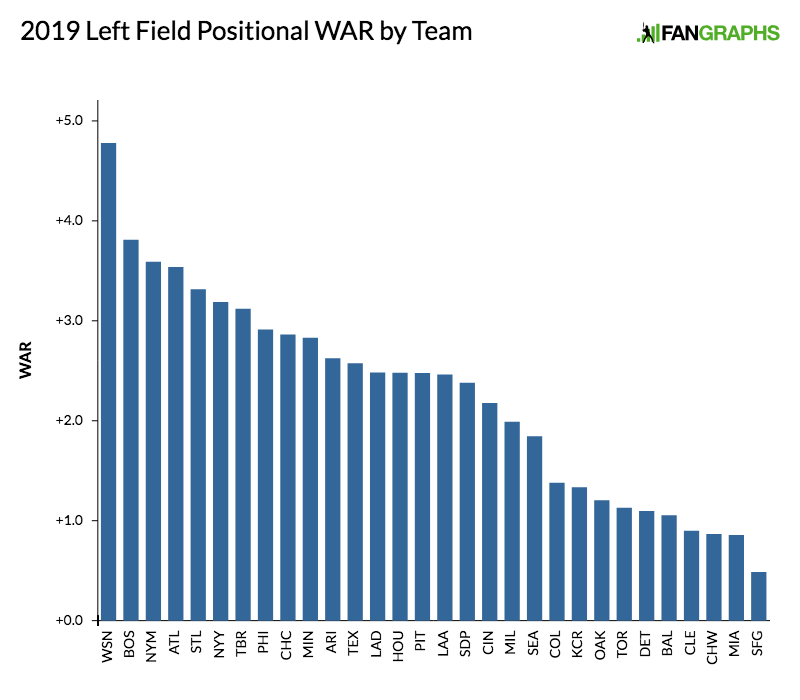
This morning, we considered the catcher position. This afternoon, the positional power rankings take us out to left field.

Has batted ball data and modern defensive positioning altered the defensive spectrum? It likely won’t surprise readers to learn that the average wRC+ by position starts with first base and right field, but it may be revelatory to learn that the gap between right and left field has been pretty wide. The last four years, the average right fielder has produced an average wRC+ 4.75 ticks higher than his counterpart in left. The offensive bar at third base has also been higher on average than in left field during the last four years.

Why? Perhaps improved defensive positioning on the infield has enabled more bat-centric players to play third base when, in years past, they’d be at first. Most hitters are right-handed, and increased focus on pulling the ball in the air could have quickly made defensive range in left field more important than it has been in the past. The average sprint speed among left fielders is now on par with that at shortstop. Is it a long term, tectonic shift that should impact things like prospect evaluation? It’s hard to say definitively at this point because so much about the game is changing and still has the potential to change. But it’s worth discussing — eventually. For now, here are our current left fielders. Read the rest of this entry »


Picking the Perfect Baseball-Themed March Madness Bracket

One of my favorite sporting events of the year is just around the corner. And no, I’m not referring to Opening Day, though it indeed fits both conditions. I am, of course, talking about March Madness.

For a stat nut like me, March Madness is the perfect time of year. It combines sports with both probability and unpredictability. It’s also quite fun to see fans from all over the country supporting their local universities and alma maters in the biggest basketball tournament (and workplace distraction) in the United States.

The only thing missing from March Madness is a baseball spin. But for those like me who enjoy both the Madness and Opening Day, I have a solution: the perfect baseball-themed March Madness bracket. When I say “perfect,” I don’t mean literally perfect. Unfortunately, there is just a 1 in 9.2 quintillion chance that this bracket (or any other bracket) will achieve perfection.

It is perfect, though, in another sense. The second qualifier, “baseball-themed,” is important. This bracket can indeed call itself the perfect baseball-themed bracket. Let me show you how.

The process behind this is rather simple. I compiled all 68 teams in the tournament, and using Baseball-Reference’s Draft Index, was able to easily search every major league player to come from one of these schools. I then ranked each school by total WAR produced by those players.

I should note that this is only in the MLB Draft era (1965-present), and that this list only includes players who were drafted from said school. For example, if Devan Fink played baseball at Michigan but then transferred to the University of Florida and was subsequently drafted out of Florida, the Gators would get all of the credit for having harbored Devan Fink.

Without further ado, the rankings: Read the rest of this entry »


The Yankees Sign Gio Gonzalez for Minimal Risk, Money

Back in 2011, the Yankees had a lot of fun after signing two aging starters to minor league contracts, when they brought on Bartolo Colon and Freddy Garcia. Colon was deemed to be done by many. He went so far as to get a stem cell injection in his shoulder to give it another go. Garcia had a so-so season in 2010 and was working with significantly diminished stuff from his prime, but the two combined for 4.8 WAR, helping the Yankees on the way to a division title. Eight years later, New York has signed Gio Gonzalez to a minor league deal. He will earn $3 million if he reaches the big leagues, with incentives based on games started. He has the ability to opt-out on April 20 should he not receive a major league assignment. The circumstances that led to signing Gonzalez now, and Colon and Garcia then, are different, but the best-case scenario might be the same: big bang for the buck from a veteran arm.

Normally, there are five starting pitchers in a set rotation; two of the Yankees’ are injured this spring. Luis Severino, the staff ace, has an inflamed rotator cuff and is expected to be out until May. CC Sabathia is recovering from angioplasty and right knee surgery, and is projected to return sometime in April. That leaves two spots open beyond the cast of James Paxton, Masahiro Tanaka, and J.A. Happ.

The Yankees already have depth arms with major league starting experience in Domingo German, Jonathan Loaisiga, and Luis Cessa. German and Cessa in particular are having pretty good springs, but we all know that spring training can be a bit of a mirage. Those three combined for 1.8 WAR last year, which isn’t inspiring. But they are young and have shown flashes of promise, so it is possible that they could break out this year. For now, they are talented question marks. And even if the Yankees decide to carry two of the three, they would still face issues when it comes to rotation depth. As we’ve seen from the 2016 Dodgers, anything could happen to human beings who throw baseballs for living. Read the rest of this entry »


2019 Positional Power Rankings: Catcher

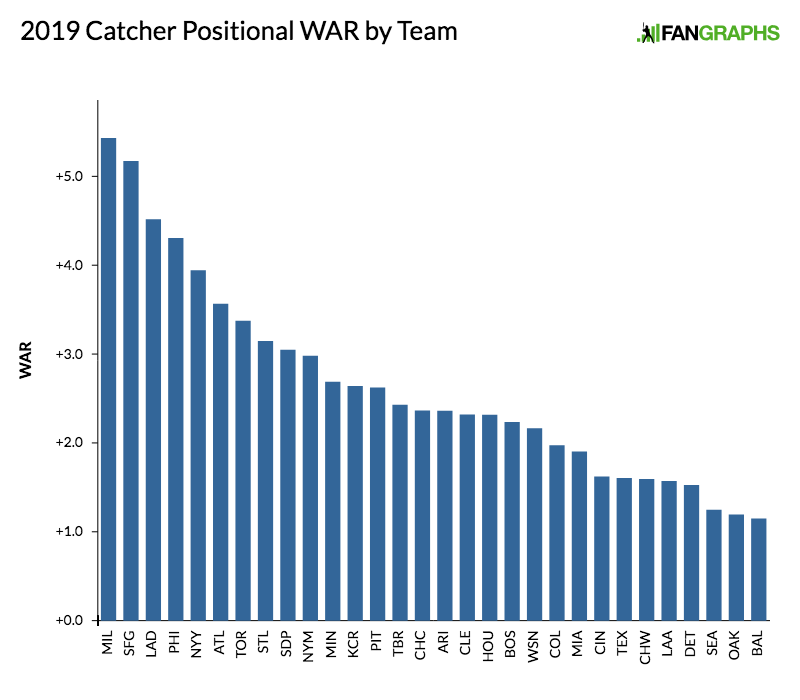
After Craig Edwards and Rian Watt surveyed the current state of second and third basemen yesterday, our positional power rankings continue today with catcher.

The catching position hit an 11-year low in wRC+ (84) and also dipped below 50 WAR for the first time in that same span (49.9). Just two guys topped 4.0 WAR, and neither Yasmani Grandal (4.9) nor J.T. Realmuto (4.8) reached a full 5.0 wins. Compare that to just five years ago, when five guys had at least 5.0 WAR and two of them rounded to eight wins: Yan Gomes (5.3), Rene Rivera (5.3), Russell Martin (6.5), Buster Posey (7.8), and Jonathan Lucroy (8.1). Part of the issue is that teams are much more open to splitting the duties among multiple players, which makes it tougher for even the top end to generate big numbers. In 2014, there were 23 catchers with at least 400 plate appearances, but that figure dipped to just 15 a year ago.

The 2019 pool has already lost a stalwart with Salvador Perez needing Tommy John surgery, although he hasn’t topped 1.0 WAR since 2014 and has surpassed an 89 wRC+ just once in that same time frame (103 in 2017). The position is aging and hasn’t backfilled with prospects quickly enough to replace the old guard. Looking at those top performers from 2014, we see that they are all still playing but managed just a combined 6.9 (nice) WAR despite four of the five logging at least 350 plate appearances.

Do not fret, though, the backfill is on the way! Danny Jansen debuted last year but will play out his rookie season in 2019. Francisco Mejia has essentially had sips of coffee each of the last two years and still holds rookie eligibility. Meanwhile, 10 other catchers made it into our Top 100 Prospects list, including three in the Top 50: Keibert Ruiz for the Dodgers (15), Sean Murphy for the Athletics (35), and Joey Bart for the Giants (41). Read the rest of this entry »


Effectively Wild Episode 1350: Season Preview Series: Astros and Tigers

EWFI
Ben Lindbergh and Sam Miller banter at length about Mike Trout’s extension, why he may have wanted to stay with the Angels, what makes him different from other players, and why he’s underpaid despite his record contract, then preview the 2019 Houston Astros (44:38) with The Athletic’s Astros beat writer Jake Kaplan, and the 2019 Detroit Tigers (1:15:05) with Detroit Free Press Tigers beat writer Anthony Fenech.

Audio intro: Heatmiser, "Why Did I Decide to Stay?"
Audio interstitial 1: Neil Finn, "Astro"
Audio interstitial 2: John Doe and The Sadies, "Country Club"
Audio outro: Flamin’ Groovies, "The First One’s Free"

Link to Ben’s Trout extension article
Link to Sam’s Trout extension article
Link to Sam’s article about Trout on every team
Link to story about MLB considering raising minor-league salaries
Link to Banished To The Pen’s team preview posts
Link to preorder The MVP Machine

 iTunes Feed (Please rate and review us!)
 Sponsor Us on Patreon
 Facebook Group
 Effectively Wild Wiki
 Twitter Account
 Get Our Merch!
 Email Us: podcast@fangraphs.com

01:55:48

FanGraphs Pitch Framing

In 2008, when Dan Turkenkopf was the first to quantify the value of pitch framing, he noted that it appeared to be alarmingly important. Bill Letson was similarly astounded when he calculated the size of the effect in 2010. Max Marchi and Mike Fast each took a turn in 2011, finding large and highly correlated catcher values despite using different methods. Other sabermetric luminaries have contributed sophisticated methods and sanity checks, some of which I’ll touch on below. And yet, this terrifically important, seemingly well-established, and impressively repeatable defensive skill has been left out when calculating FanGraphs player WAR and ignored when Steamer forecasts pitchers and catchers. . . until now.

In what follows, I’ll briefly lay out a series of steps for calculating how many framing runs each catcher contributed as well as and how many extra strikes each pitcher was granted (or, in some cases, earned). This much has all been done and clearly described before thanks to Dan Brooks and Harry Pavlidis; that research was updated and expanded upon by Pavlidis and Jonathan Judge. I’ll then compare the values I’ve obtained to the ones created by Baseball Prospectus, StatCorner, and Sports Info Solutions and demonstrate (I hope) that those extra strikes really do result in extra strikeouts and fewer walks. Lastly, I’ll discuss what this means for Steamer forecasts.

Modeling the Strike Zone

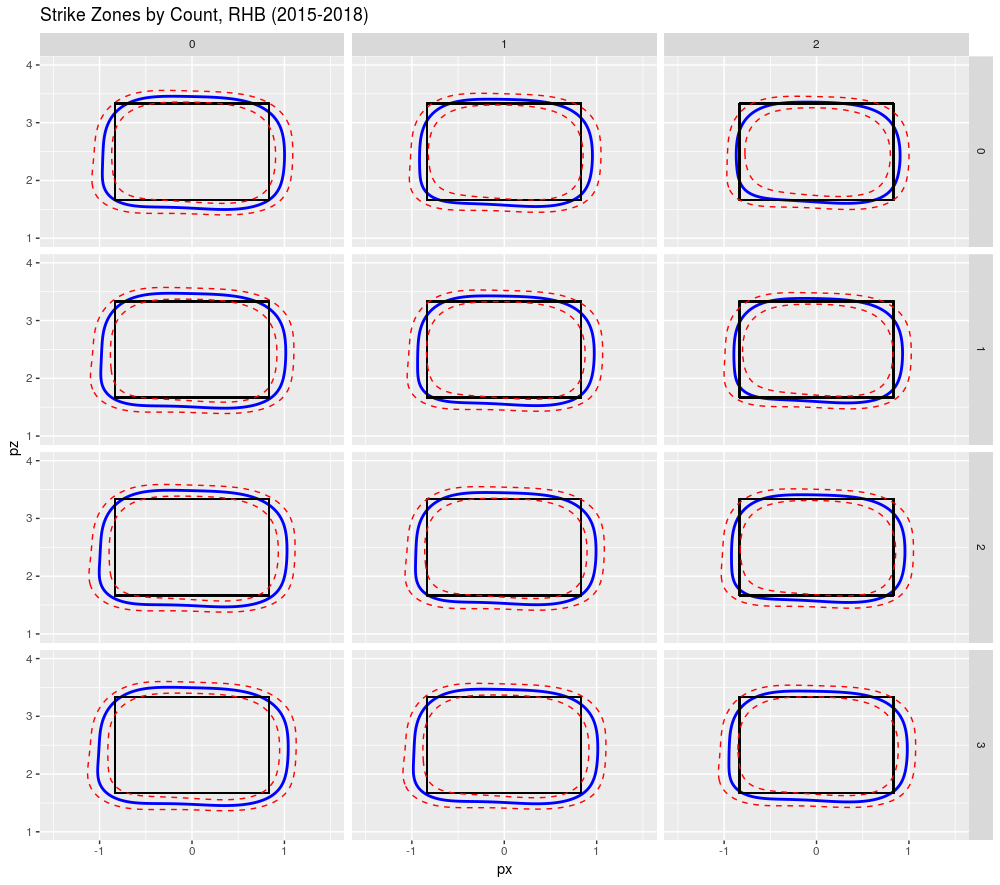
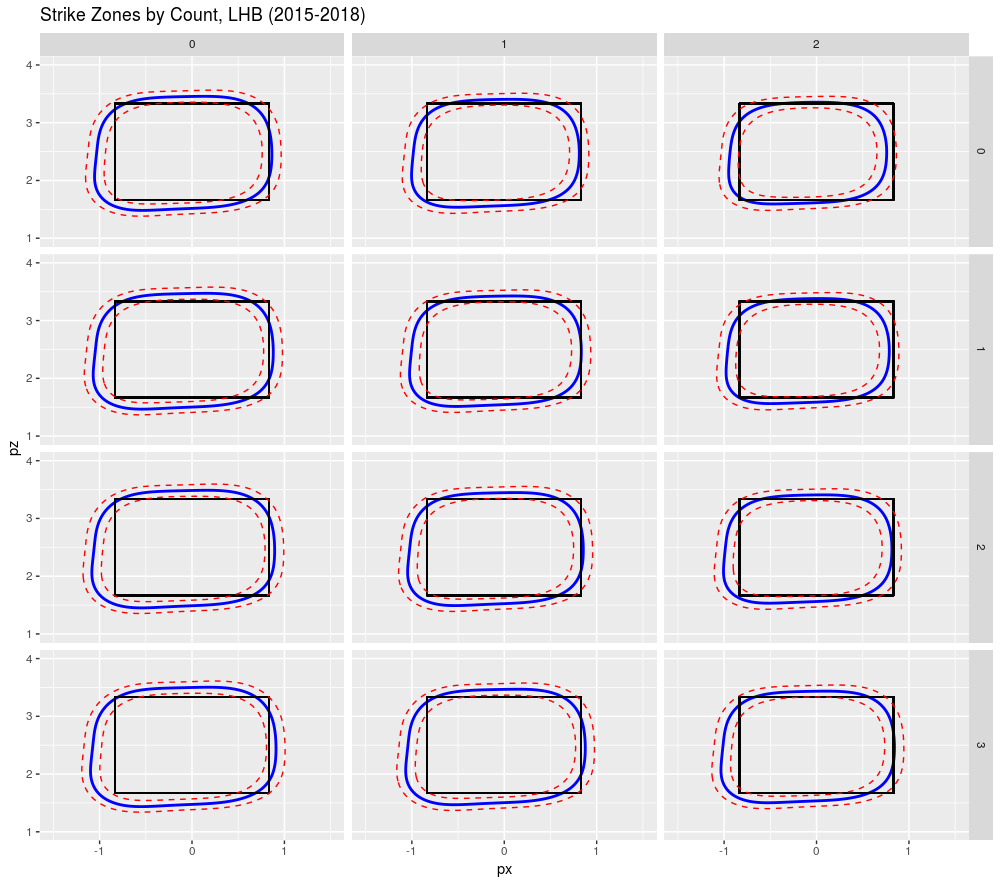
It all starts with the strike zone and I started by using generalized additive models to estimate the probability of a strike in any count, to either left-handed or right-handed batters at each location in and around the plate. On the first pass (shown below), I created strike zones averaged across seasons and, on the second pass, looked for changes in the strike zone by season. The blue contour lines in the images below show where strike calls are a coin flip and the red dashed lines show where we’d expect a 25% or 75% chance of a strike. If you’re read Matt Carruth or Jon Roegele, you’ll be unsurprised to see a small 0-2 strike zones (shown in the upper right facets) and large 3-0 strike zones (in the lower left).

Read the rest of this entry »


WAR Update: Catcher Framing!

Update: An earlier bug that impacted updated pitcher WAR has now been resolved. The pitcher tables below have been updated to reflect that. Thanks to everyone who pointed out the issue!

I’m very pleased to announce that FanGraphs has finally added catcher framing data to the site, with full thanks to Jared Cross, who you may know as the co-creator of the Steamer projections. We’ve also incorporated catcher framing into WAR.

Including catcher framing in WAR has been a topic of internal debate at FanGraphs for the past half-decade. The problem has never been with the inclusion of framing numbers on the catcher side of things. That’s a fairly simple addition. The problem has always been what to do with the pitchers. For instance, the 2011 Brewers were some 40 runs above average in catcher framing. When you add those 40 runs to catchers, do you subtract 40 runs from pitchers? As it turns out, you do, but those runs are not attributed equally to each pitcher:

2011 Brewers Starting Rotation
Player IP Catcher Framing Framing per 9
Randy Wolf 212.1 -0.45 -0.02
Yovani Gallardo 207.1 7.79 0.34
Shaun Marcum 200.2 7.47 0.34
Zack Greinke 171.2 5.95 0.31
Chris Narveson 161.2 5.12 0.29
Positive framing numbers for pitchers indicate a pitcher was helped by the catcher’s framing ability; negative numbers indicate a pitcher was hindered by the catcher’s framing ability.

While most of the pitchers on the 2011 Brewers benefited from Jonathan Lucroy’s otherworldly framing, Randy Wolf was stuck with George Kottaras most of the time. In this instance, the entire Brewers pitching staff, with the exception of Randy Wolf, was a little bit worse once catcher framing is taken into account than their previous, non-catcher framing inclusive WAR would indicate.

Exactly how do you add catcher framing to WAR you ask?

For catchers, you take the catcher framing runs above average, divide by the runs to wins converter, and add it to your existing WAR total.

WAR = (Batting + Base Running + Fielding + Catcher Framing + Replacement Level) / Runs to Wins

On the pitcher side, we adjust FIP by the catcher framing runs above average per 9 innings. If Zack Greinke’s 2011 FIP was 3.00, and he was helped to the extent of 0.31 framing runs per 9 innings, we now use 3.31 in the WAR calculation instead of the original 3.00 FIP. We also adjust the pitcher’s dynamic runs to wins converter. In Greinke’s case, this would increase his personal run environment and also increase the runs to wins converter.

WAR = (((League FIP – (FIP + Catcher Framing / 9)) / Dynamic Runs to Wins Converter + Replacement Level) * IP / 9) * Game Start Leverage / 2

The RA9-WAR calculation has been adjusted in the exact same way.

Let’s take a look at how the inclusion of catcher framing has changed things:

Largest Career WAR Increases (2008 – 2018)
Player Catcher Framing Old WAR New WAR Difference
Brian McCann 181.9 30.4 49.2 18.8
Russell Martin 165.6 29.5 46.7 17.2
Yadier Molina 151.6 34.8 50.5 15.7
Jose Molina 140.4 0.6 15.2 14.6
Jonathan Lucroy 126.8 22.6 36.2 13.6
Miguel Montero 127.0 15.6 28.9 13.3
Yasmani Grandal 119.6 15.1 27.6 12.5
Buster Posey 118.0 38.7 51.1 12.4
Tyler Flowers 89.4 8.6 17.8 9.2
David Ross 80.7 10.0 18.3 8.4
Ryan Hanigan 79.2 8.8 17.1 8.3
Martin Maldonado 69.2 4.6 11.7 7.2
Jeff Mathis 69.1 -1.1 6.0 7.1
Chris Stewart 66.2 2.9 10.0 7.1
Mike Zunino 49.5 7.7 13.0 5.3
Hank Conger 48.1 1.7 6.9 5.2
Rene Rivera 48.1 3.9 9.1 5.1
Largest Career WAR Decreases (2008 – 2018)
Player Catcher Framing Old WAR New WAR Difference
Ryan Doumit -156.6 5.7 -10.4 -16.1
Gerald Laird -109.1 4.0 -7.2 -11.2
Nick Hundley -90.7 11.3 1.9 -9.4
Chris Iannetta -89.5 17.7 8.3 -9.3
Kurt Suzuki -86.1 18.1 9.0 -9.1
Carlos Santana -78.6 14.7 6.4 -8.3
Salvador Perez -79.9 17.8 9.5 -8.3
A.J. Ellis -77.1 8.2 0.1 -8.1
Carlos Ruiz -68.9 21.2 14.0 -7.3
Dioner Navarro -65.4 5.6 -1.2 -6.8
Lou Marson -57.6 2.5 -3.5 -6.0
Welington Castillo -52.1 13.2 7.6 -5.6
John Buck -52.4 7.2 1.7 -5.6
John Jaso -51.9 8.0 2.5 -5.5
Rob Johnson -48.4 -1.5 -6.5 -5.0
Robinson Chirinos -47.7 8.3 3.4 -5.0
Largest Single Season WAR Increases (2008 – 2018)
Player Season Catcher Framing Old WAR New WAR Difference
Jonathan Lucroy 2011 42.4 1.4 5.9 4.5
Brian McCann 2008 37.5 5.1 8.9 3.7
Brian McCann 2011 34.1 3.8 7.4 3.6
Jonathan Lucroy 2013 31.8 3.4 6.8 3.4
Jonathan Lucroy 2010 32.4 0.6 4.0 3.4
Jose Molina 2008 32.1 0.4 3.6 3.2
Tyler Flowers 2017 31.9 2.4 5.6 3.2
Brian McCann 2009 31.6 3.7 6.9 3.2
Jose Molina 2012 27.1 0.8 3.6 2.8
Buster Posey 2012 27.0 7.5 10.4 2.8
Yadier Molina 2010 27.2 2.2 5.1 2.8
Russell Martin 2011 26.6 2.5 5.3 2.8
Russell Martin 2008 28.1 4.8 7.6 2.8
Brian McCann 2012 26.4 1.5 4.2 2.8
Buster Posey 2016 26.7 3.8 6.5 2.7
Jonathan Lucroy 2012 26.1 3.4 6.2 2.7
Y Grandal 2016 25.7 2.8 5.5 2.6
Miguel Montero 2014 23.8 1.1 3.7 2.6
Hank Conger 2014 22.9 0.3 2.8 2.5
Mike Zunino 2014 22.8 1.7 4.2 2.5
Largest Single Season WAR Decreases (2008 – 2018)
Player Season Catcher Framing Old WAR New WAR Difference
Ryan Doumit 2008 -57.8 2.9 -2.8 -5.8
J Saltalamacchia 2014 -31.8 1.5 -2.0 -3.5
Gerald Laird 2009 -32.3 1.6 -1.6 -3.2
Carlos Santana 2011 -30.3 3.4 0.2 -3.2
Carlos Santana 2012 -27.6 3.0 0.1 -2.9
Chris Iannetta 2008 -26.6 3.1 0.5 -2.7
Jorge Posada 2010 -24.2 1.5 -1.0 -2.5
Kurt Suzuki 2014 -22.8 1.9 -0.6 -2.5
Ryan Doumit 2009 -24.6 0.6 -1.9 -2.5
Chris Iannetta 2013 -22.8 1.9 -0.5 -2.5
Dioner Navarro 2014 -22.0 2.0 -0.4 -2.4
Gerald Laird 2008 -23.9 1.4 -1.0 -2.4
Ryan Doumit 2012 -22.2 1.0 -1.4 -2.3
Dioner Navarro 2008 -22.6 1.9 -0.3 -2.3
Miguel Olivo 2011 -21.2 0.2 -2.0 -2.2
Jonathan Lucroy 2017 -22.1 1.1 -1.1 -2.2
Lou Marson 2011 -20.4 1.0 -1.2 -2.2
Lou Marson 2010 -20.3 0.5 -1.6 -2.1
Rob Johnson 2009 -20.8 -0.1 -2.2 -2.1
Dioner Navarro 2016 -20.2 -0.2 -2.3 -2.1
Wilin Rosario 2012 -19.5 1.2 -0.8 -2.0
John Buck 2010 -19.1 2.8 0.8 -2.0
W Castillo 2013 -18.3 3.2 1.2 -2.0

And the Pitchers, where the differences are considerably smaller:

Largest Pitcher WAR Increases (2008 – 2018)
Player Framing Old War New War Difference
Felix Hernandez -23.3 42.7 45.4 2.7
Justin Masterson -20.7 14.2 16.4 2.2
Jason Vargas -21.0 12.9 15.0 2.1
Justin Verlander -17.6 57.0 59.0 2.0
Ricky Nolasco -12.4 23.6 25.0 1.4
Mike Pelfrey -13.6 11.8 13.2 1.4
Kevin Correia -12.3 5.5 6.8 1.2
Cole Hamels -11.1 41.4 42.6 1.2
Anibal Sanchez -11.7 25.7 27.0 1.2
Zach Duke -12.4 8.3 9.5 1.2
Ubaldo Jimenez -10.8 26.6 27.8 1.1
Ian Snell -11.9 1.6 2.7 1.1
Derek Holland -10.5 13.2 14.3 1.1
Danny Duffy -10.2 11.7 12.8 1.1
Luke Hochevar -10.1 8.0 9.1 1.0
Paul Maholm -10.2 11.4 12.4 1.0
Edwin Jackson -10.1 16.1 17.2 1.0
Jeff Karstens -9.6 3.2 4.2 1.0
Roberto Hernandez -9.7 4.2 5.1 1.0
Largest Pitcher WAR Decreases (2008 – 2018)
Player Framing Old War New War Difference
Yovani Gallardo 25.6 21.3 18.4 -2.9
Bronson Arroyo 28.6 8.9 6.1 -2.8
Madison Bumgarner 23.4 30.7 28.0 -2.7
Tim Hudson 24.5 14.5 12.0 -2.6
Kyle Lohse 21.7 14.9 12.6 -2.3
Adam Wainwright 18.6 35.3 33.2 -2.1
Jair Jurrjens 19.2 9.7 7.7 -2.0
Derek Lowe 19.0 12.4 10.5 -2.0
Ryan Vogelsong 18.4 5.8 3.9 -1.9
Tommy Hanson 17.2 9.5 7.6 -1.8
Johnny Cueto 16.9 29.5 27.7 -1.8
Marco Estrada 16.6 13.3 11.6 -1.7
Matt Cain 15.7 21.1 19.4 -1.7
Ian Kennedy 14.7 16.3 14.6 -1.6
CC Sabathia 14.7 40.3 38.7 -1.6
Zack Greinke 13.8 50.7 49.1 -1.6

Now you know everything there is to know about how we added catcher framing to WAR. Please note the following:

  • Catcher Framing (abbreviated as FRM) is available on the leaderboards and player pages in the fielding sections.
  • WAR has been updated with catcher framing data everywhere WAR is available on the site.
  • Catcher Framing data is available in batter and pitcher sections of the leaderboard as a custom stat.
  • Fielding (the WAR component) now includes Catcher Framing runs above average.
  • Steamer projections and depth chart projections both include projected catcher framing for catchers and pitchers.