Archive for 2019 Positional Power Rankings

2019 Positional Power Rankings: Summary

Over the past week and a half, we’ve published our annual preview of the upcoming season, ranking each position based on a blend of our projections (a 50/50 split between ZiPS and Steamer) and our manually maintained playing time estimates. The result was a document nearly the length of Infinite Jest (I am only somewhat kidding), so if you missed any of the posts, or would like to refresh your memory of what all it is that we’ve said, you can use the handy navigation widget above.

Today I’m going to summarize the results of the rankings. Before I get started, a brief note. I will throughout this post make reference to our Team WAR Totals. We maintain a total of projected future value by position, which updates regularly throughout the season. As such, the totals you see there may vary slightly from what you see on the positional power rankings, mostly because they are aware of injuries and transactions that have altered playing time estimates since the power rankings went live. I’ll provide a snapshot of those totals at the end of the post, but when you see that they are a little different here and there, don’t be surprised. Now you know why, and will be prepared. Now on to some trends.

First, we’ll take a look at where each team stacked up across positions. This table is sortable, so feel free to poke around.

2019 Positional Power Rankings
Team C 1B 2B 3B SS LF CF RF SP RP DH
Angels 25 27 22 22 4 16 1 22 18 23 3
Astros 18 22 1 2 3 15 9 12 3 2 6
Athletics 30 6 8 7 13 23 8 11 22 3 5
Blue Jays 7 11 29 10 26 24 14 14 21 21 13
Braves 6 1 2 9 17 4 11 26 20 18
Brewers 1 9 5 13 28 19 2 3 24 17
Cardinals 8 2 10 11 11 5 15 19 11 16
Cubs 15 3 9 3 8 9 20 15 10 14
Diamondbacks 16 18 11 16 16 11 18 21 15 25
Dodgers 3 8 6 4 2 13 6 5 7 10
Giants 2 7 14 26 10 30 27 28 25 7
Indians 17 21 20 1 1 29 22 25 1 15 9
Mariners 29 25 26 25 23 20 12 7 19 28 8
Marlins 22 28 27 14 25 27 29 30 28 29
Mets 10 13 3 21 15 3 19 10 6 5
Nationals 20 20 13 6 5 1 17 6 4 9
Orioles 28 30 30 29 30 26 23 27 30 20 14
Padres 9 16 15 5 19 17 16 16 17 13
Phillies 4 5 17 28 14 8 21 4 12 4
Pirates 13 17 18 15 29 14 7 18 9 6
Rangers 26 26 23 27 22 12 26 23 23 12 12
Rays 14 19 16 19 20 7 4 24 8 8 11
Red Sox 19 23 19 20 6 2 5 1 5 27 1
Reds 23 4 21 12 21 18 10 8 16 22
Rockies 21 12 24 8 7 21 25 17 13 26
Royals 12 29 4 30 9 22 24 29 26 30 10
Tigers 27 24 28 24 27 25 28 20 27 24 15
Twins 11 14 12 17 18 10 13 13 14 11 2
White Sox 24 15 25 23 24 28 30 9 29 19 7
Yankees 5 10 7 18 12 6 3 2 2 1 4

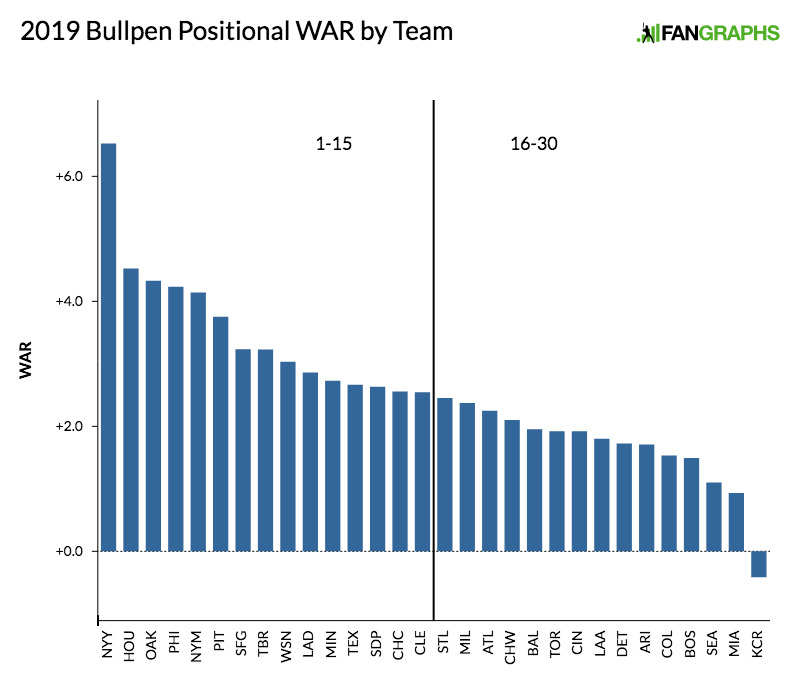
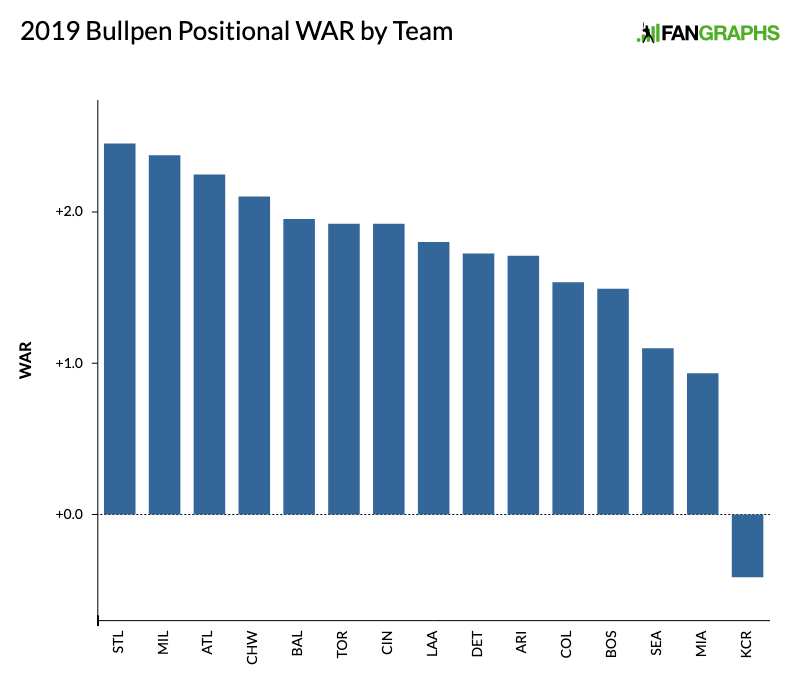
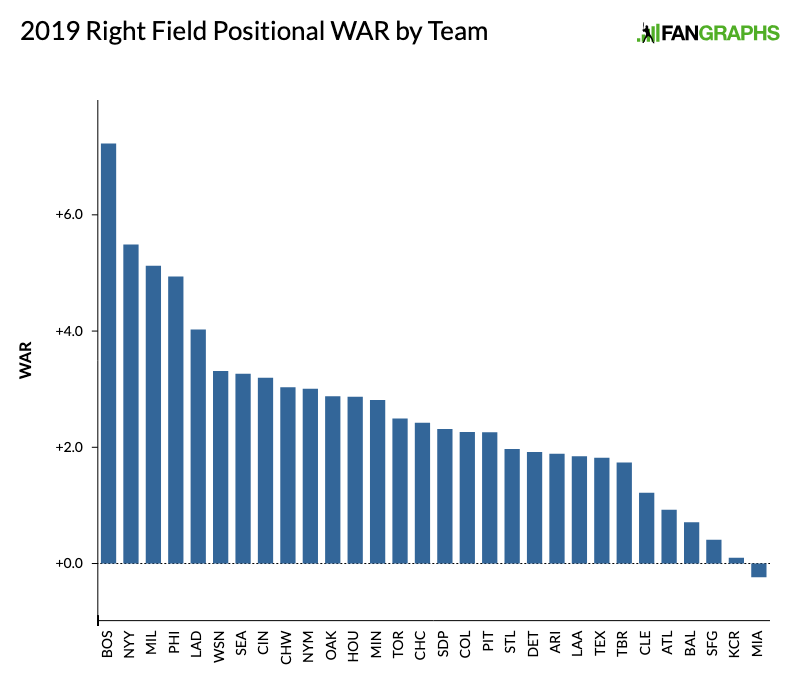
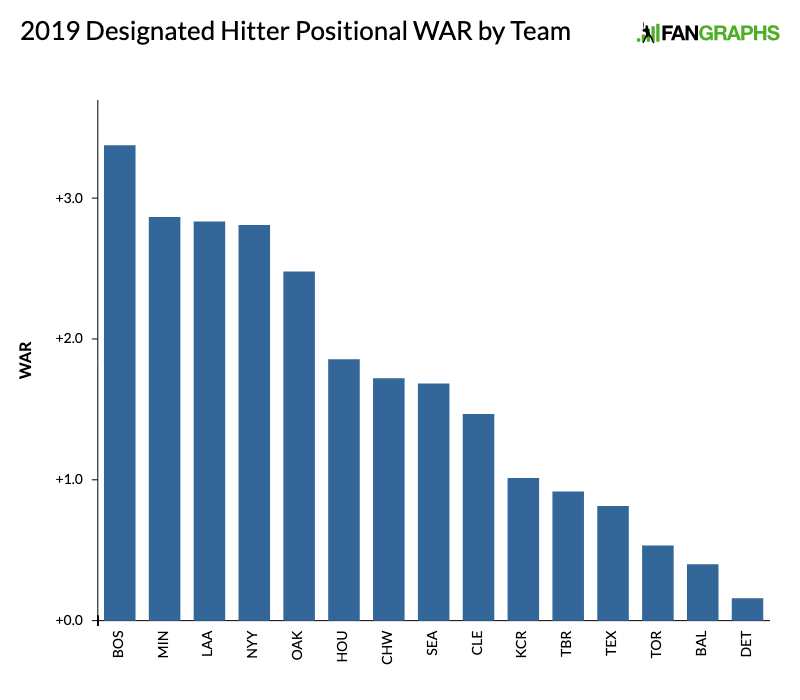
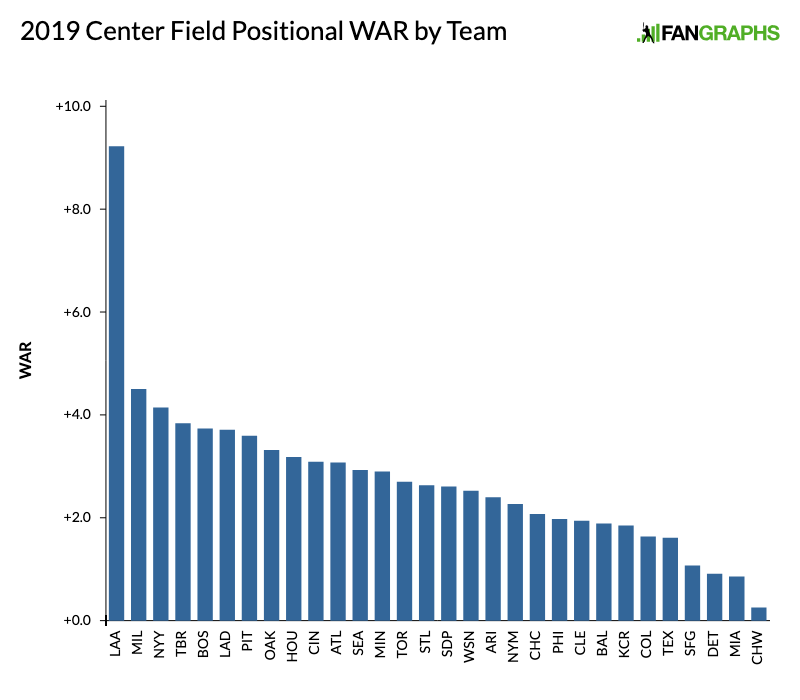
Eight different teams check in with at least one first-place finish (the Angels, Astros, Braves, Brewers, Indians, Nationals, Red Sox, and Yankees). Only Cleveland (three) and Boston (two) can boast more than one such finish, though they present interesting and opposing case studies in how best to construct a roster. The Red Sox are one of eight teams (more on the others in a moment) that has six or more categories in which they rank in the top 10. The Red Sox are tops at both designated hitter and right field (J.D. Martinez and Mookie Betts: pretty good at baseball!) but are also sixth at shortstop, second in left field, fifth in center field, and fifth in their starting rotation. They have an incredibly deep, well-rounded team, though I would be remiss if I didn’t mention their bullpen, which came in at 27.

The only team among the eight I referenced above with a worse positional ranking was the Athletics, whose catching corps of Josh Phegley, Nick Hundley, Chris Herrmann, and Beau Taylor are projected to combine for a solitary win. Meanwhile, if you toggle over to the Team WAR Total projection for baseball’s remaining free agents, you’ll see that Craig Kimbrel accounts for 2.0 WAR of the All-Unemployed Team’s 2.2 relief WAR. He has the same projection as Edwin Diaz. The two of them only trail Aroldis Chapman and his 2.2 projected WAR. Those things are all facts that are being stated near to facts about the Boston Red Sox. Just some bullpen facts for your enjoyment.

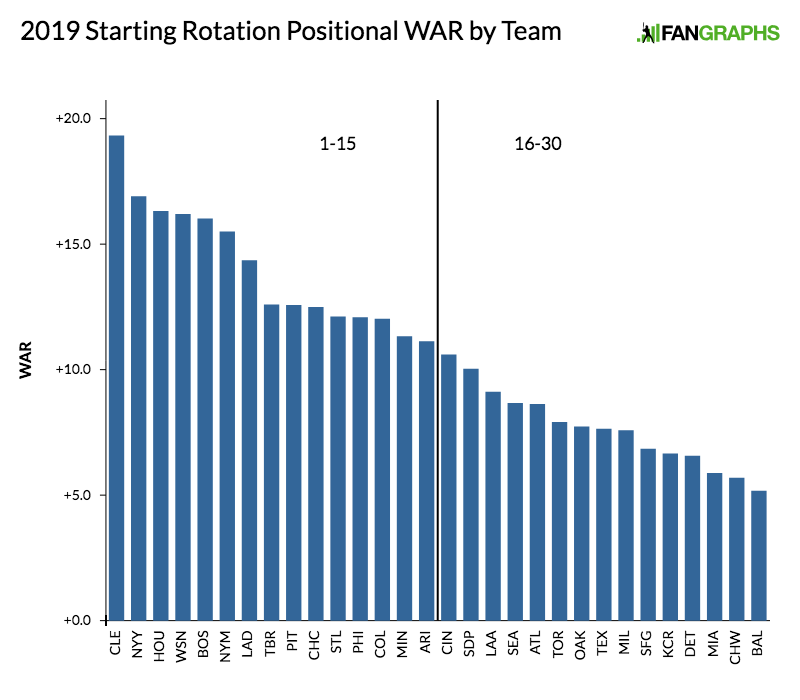
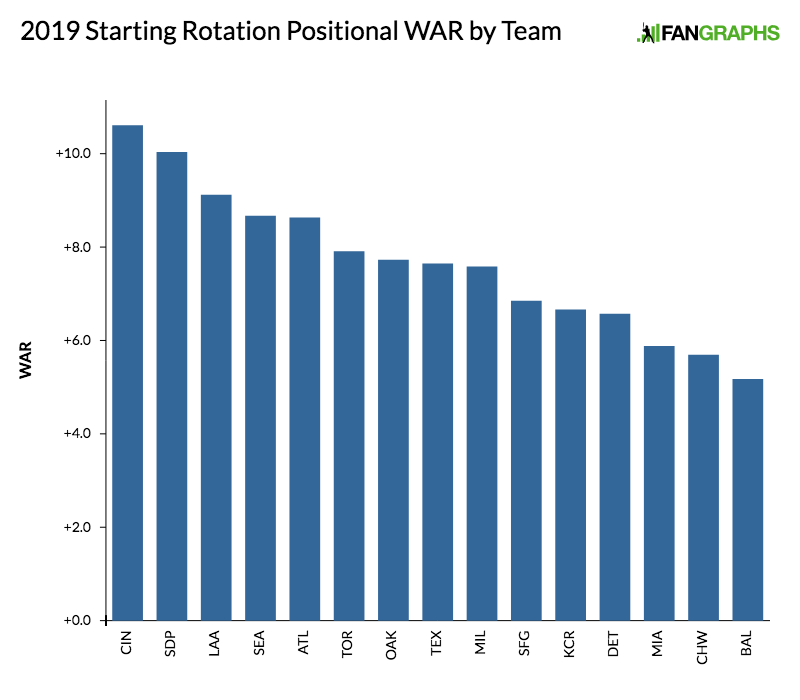
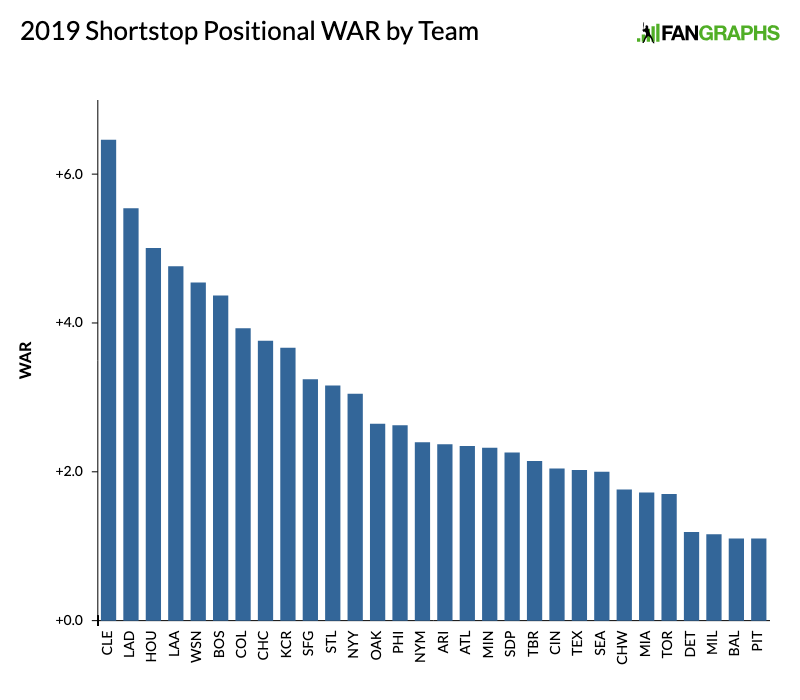
Cleveland, on the other hand, has concentrated its wins rather sharply. Having Jose Ramirez and Francisco Lindor on the roster means the Indians are ranked first at third base and shortstop; Corey Kluber and Co. mean that their rotation is projected to be the best in baseball. But things fall of sharply from there. As I noted in my right field preview, Cleveland’s outfield is a mess, projected to be better than just the Tigers, Orioles, Royals, Giants, and Marlins in terms of its production across all three spots. They enjoy a weak division, but they also have a surprising thin margin for error given their advantage over bad competition, and it looks like their strategy will be tested early, with Ramirez dinged up while Lindor’s timeline for return is uncertain after he sustained an acute ankle sprain on Tuesday. Cleveland will almost certainly still find its way to October baseball (going into today, they had an 86.8% chance of winning their division according to our playoff odds), but its fate upon arriving there is far less assured.

I want to spend some time on the teams at the top and bottom of these rankings. The Yankees and Dodgers tally nine (nine!) positions a piece in those positions’ respective top 10s. The Astros can count seven. We’ve already talked about the Red Sox. That is impressive (there are five teams that don’t have a single top 10 finish), but it doesn’t necessarily give you a complete picture. The Cardinals are projected to win 86 games, tied for fifth-most in the NL with the Phillies, and they only have four top 10 finishes, as do the Giants, who we expect to win just 75 games. Ordinal rankings can make small differences appear larger than they are or obscure large gaps. But even with that proviso in mind, the Yankees and Dodgers impress. The Dodgers have four positions not just in the top 10, but the top five! They’re third at catcher, fourth at third base, second at shortstop, and fifth in right field. They don’t play with a designated hitter, being famously a National League team, but their projected 1.3 wins at DH in our Team WAR Totals page, which uses the expected value from pinch hitters to arrive at its NL DH forecast, is better than the Tigers’ 0.2 wins at the position, and the Tigers’ lineup is almost entirely composed of designated hitters playing out of position.

Meanwhile, the Yankees have a staggering six positions in that position’s top five. Their bullpen is first; their starting pitching is second. Right field comes in second; center field is in third. They’re fourth at DH and fifth at catcher. The Dodgers are projected for 93 wins and, despite an increasingly tough division, have an 85.9% chance of repeating as NL West champs. The Yankees have the best projected win total in baseball (97), and even with the Red Sox and Rays nipping at their heels, have a 62.2% chance of winning the division, not to mention the best odds to win the World Series. Contending teams can be balanced and pretty good at a lot of things, or they can be really good at a few things and cross their fingers about the rest. But the question the Yankees and Dodgers, and to a slightly lesser extent, the Astros and Red Sox, pose is: what if you were just really, really good at everything? Very good teams have faltered before, but at least on paper, this is the creme de la creme.

On the opposite end of the spectrum are the Orioles and the Marlins. The Orioles’ average power rankings position was 26.09; the Marlins’ was 25.90. If we were to pretend that Baltimore had suddenly transferred to the National League and thus lost the DH (at 14, it was their only position ranked in the teens or better), that average drops to 27.3. We don’t have to belabor the point; Orioles and Marlins fans have suffered enough. But jeez are they bad.

As we’ve discussed, the rankings by themselves are helpful, but not totally helpful. We need some additional context to see how close and far apart these are to get a better sense of relative strengths and weaknesses, and to see how the last week of activity and injury affects things (poor Steven Souza Jr.). Remember, the NL DH values reflect expected value from pinch-hitters.

2019 Projected Values by Position
Team C 1B 2B SS 3B LF CF RF DH SP RP WAR
Angels 1.6 0.8 1.9 4.8 2.5 2.5 9.2 1.8 2.8 9.1 1.8 39.0
Astros 2.3 1.4 5.0 5.1 5.6 2.5 3.2 2.9 1.9 16.3 4.6 50.8
Athletics 1.0 2.9 2.8 2.7 5.3 1.2 3.2 2.9 2.5 7.7 4.3 36.7
Blue Jays 3.4 2.1 1.3 1.7 4.5 1.1 2.7 2.5 0.5 7.8 1.9 29.6
Braves 3.6 4.6 4.1 2.3 4.9 3.5 3.1 1.0 0.5 8.7 2.3 38.6
Brewers 5.4 2.2 3.1 1.2 3.4 2.1 4.6 5.2 0.8 7.5 2.3 37.8
Cardinals 3.2 4.4 2.9 3.2 4.0 3.3 2.6 2.0 1.1 12.1 2.5 41.1
Cubs 2.4 4.3 3.0 3.8 5.5 2.9 2.1 2.5 0.9 12.6 2.6 42.5
Diamondbacks 2.4 1.6 2.8 2.4 2.8 2.6 2.6 0.4 0.7 11.2 1.7 31.2
Dodgers 4.5 2.5 3.4 5.5 5.4 2.5 3.7 4.0 1.3 14.3 2.9 50.0
Giants 5.1 3.0 2.4 3.2 2.1 0.4 1.0 0.4 0.4 6.9 3.2 28.2
Indians 2.3 1.4 2.2 6.5 6.2 0.9 2.0 1.2 1.5 19.4 2.6 46.2
Mariners 1.2 0.9 1.7 2.0 2.3 1.9 2.9 3.3 1.6 8.7 1.1 27.6
Marlins 1.9 0.3 1.6 1.7 3.3 0.9 0.9 -0.2 0.5 6.9 0.9 18.8
Mets 3.0 2.1 3.3 2.4 2.6 2.6 2.3 3.0 0.9 15.5 4.1 42.0
Nationals 2.1 1.4 2.6 4.5 5.3 4.8 2.5 3.3 0.8 16.2 3.0 46.6
Orioles 1.1 0.1 1.6 1.1 1.5 1.1 1.9 0.7 0.3 5.2 2.0 16.5
Padres 3.0 1.6 2.4 2.1 5.4 2.3 2.6 2.3 0.8 10.1 2.7 35.1
Phillies 4.3 3.6 2.3 2.7 2.0 2.9 2.0 4.9 0.6 12.0 4.2 41.5
Pirates 2.6 1.6 2.2 1.1 3.1 2.5 3.6 2.2 0.9 12.6 3.8 36.2
Rangers 1.6 0.9 2.0 1.9 2.2 2.2 1.6 1.8 0.8 7.7 2.7 25.2
Rays 2.4 1.5 2.4 2.2 2.8 3.1 3.9 1.7 0.9 12.6 3.3 36.8
Red Sox 2.1 1.3 2.2 4.4 2.7 3.8 3.7 7.2 3.4 16.1 1.5 48.3
Reds 1.6 3.9 2.5 2.1 3.8 2.2 2.5 3.2 0.8 10.6 1.9 35.2
Rockies 2.1 2.0 1.9 3.9 5.0 1.4 1.6 2.3 0.5 12.0 1.5 34.1
Royals 2.7 0.3 3.1 3.6 0.3 1.3 1.7 1.2 0.8 6.6 -0.4 21.2
Tigers 1.7 1.0 1.5 1.3 2.4 1.1 1.1 1.9 0.2 6.4 1.7 20.3
Twins 2.7 1.9 2.6 2.3 2.9 2.8 2.9 2.8 2.9 11.4 2.7 37.9
White Sox 1.6 1.7 1.7 1.8 2.5 0.7 0.3 3.0 1.7 5.5 2.1 22.5
Yankees 4.0 2.2 2.9 3.1 2.6 3.1 4.1 5.5 2.8 16.9 6.5 53.7

The Yankees are good. The Dodgers are good. The Astros, Red Sox, and Nationals are good. The Indians play in the AL Central. The Cubs and Cardinals are going to beat up on each other all season long; ditto the Phillies and Mets. The bad teams are very, very bad, and the middle is thin. It’s baseball in 2019. Tomorrow, real baseball with real stakes will be played in US time zones. We’ll look back and feel silly about some of these projections and haughty about others. We hope you’ve enjoyed this year’s installment of the positional power rankings and that the format provided you with something useful. We hope it helped to pass the time. We can’t wait to watch baseball along with all of you this season. It’s almost here.


2019 Positional Power Rankings: Bullpen (No. 1-15)

This morning, Dan Szymborski took us through the back end of the bullpen rankings. Now, we conclude the player rankings (a summary will run tomorrow) with the best bullpens in baseball.

“Relievers are volatile” is something that people say all the time. I happen to believe it is true, and here are two illustrations of how. First, Craig Kimbrel is not in these rankings because he has yet to sign. Below you will find the 15 best-projected bullpens. If Kimbrel were to sign with all but the Marlins or Royals on the list of the 15 worst-projected bullpens, they would appear on this list. Further, he would take any team covered below and put them in second place except for the Yankees, who would still be in first.

The second illustration has to do with the narrow band of reliever performances given the small sample they work under. If we were to consider a good but not great position player projected for three wins, and that player finished anywhere between two and four wins, we might not even notice. At any rate, we’d see that player as having come close to his projected result. If we were to take a good reliever, projected for one win, and that player finished between zero and two wins, that reliever was either really bad or one of the best relievers in the game. It makes breakouts a bit easier, but also takes presumably valuable relievers and makes them a lightning rod for fans. What I’m saying is, don’t get too worked up over these rankings. Look for the potential two-win relievers and dream on them. Bullpens already cause enough stress to fret too much over rankings.


2019 Positional Power Rankings: Bullpen (No. 16-30)

This is the second-half of the bullpen rankings, so there will be no Yankee ‘pens packed from top-to-bottom with scarily elite arms. You will not find a dominating Blake Treinen or a deep Astros corp or a team that made some big offseason signing.

What you will find is despair, hopefully tinged with some kind of hope. As the fan experience goes, nothing seems to feel as bad as a bullpen, because when a bullpen does its job poorly, you see late-game wins evaporate into losses. For those at the game, beer sales are likely over, so even an alcohol-fueled respite is hard to find. Fans of teams with terrible bullpens are always convinced they could add 20 wins with a top closer and while that’s ludicrous, a bad relief corps does cast a pall of doom over a game.

When you have a below-average bullpen, your challenges vary. For a contending team, how do you minimize the damage to the rest of your team? For a rebuilding team, can you find arms that are interesting with upside?

So, how’d they do? Read the rest of this entry »


2019 Positional Power Rankings: Starting Rotation (No. 1-15)

Last week, we covered most of the position players as part of our positional power rankings. Earlier today, Meg Rowley covered right fielders, before Kiley McDaniel took you through the 16th-through-30th ranked rotations. Now, we get to the good stuff.

The American League comes out firing on the top 15 list with the first three entrants made up of the reigning kings of the West and Central, as well as this year’s projected East champion. The Senior Circuit takes over from there, with seven of the next nine rotations, including two from the East and three from the Central divisions. Those staffs have been the talk of the offseason, as the top four in the NL East are all contenders to win the division while all five NL Central clubs could carve out a realistic scenario that finds them atop the group and headed to the playoffs.

The ever-dwindling workloads of starters are made clear as just six pitchers are projected for 200-plus innings; meanwhile, six clubs have just one (or fewer) arms tabbed for even 180 frames. The No. 2 ranked team doesn’t get anyone to 175, yet their depth is on display with six guys who could capably put up 100-plus innings. On the other end, some teams made this list purely on the strength of their top five, so any injuries could be catastrophic to their season outlook.

It’s probably a safe bet that at least one of the arms on here with a sub-70 inning projection ends up delivering 130-plus in a breakout campaign, but without a crystal ball to identify which injuries will create such a path, it’s hard to know exactly who that will be right now. My guesses would include Domingo German, Seth Lugo, Jordan Lyles, and Jerad Eickhoff. Last year’s were Walker Buehler, Jack Flaherty, and Zach Eflin, which perhaps means that I should include prospects Forrest Whitley and Alex Reyes, but they almost feel too easy.

Who is your favorite breakout pitcher on these 15 teams, and which is your favorite team in the 11-15 range to break the top 5?


2019 Positional Power Rankings: Starting Rotation (No. 16-30)

We closed out the position players with right field this morning. Now we move to the pitching side, starting with bottom half (16-30) of the starting rotation rankings.

There are some easy similarities to be found between the clubs on this list. There are several that have one or two generic, No. 4 quality veteran arms without much raw stuff. The better clubs have a couple more No. 4 types beyond that, with either durability or track record as the concern, while the lower-ranked clubs have a bunch of lesser, unproven prospects and guys who should top out as sixth starters or long relievers.

One of the more interesting clubs is Toronto, which has two young starters who have shown No. 2 or 3 upside (Marcus Stroman and Aaron Sanchez), three veterans with consistency or durability issues on one-year deals (Matt Shoemaker, Clayton Richard, Clay Buchholz), a couple of intriguing prospects who can contribute in some way this year (Ryan Borucki, Sean Reid-Foley, Trent Thornton), and a few depth guys. Cincinnati falls along the same lines, with Luis Castillo as the anchor and Anthony DeSclafani as the injured but talented second piece, then three veterans in walk years (Sonny Gray, Alex Wood, Tanner Roark), and some post-hype prospects (Tyler Mahle, Cody Reed, Michael Lorenzen, Lucas Sims, Sal Romaro).

On the younger side, both the Padres and the Braves could have a full rotation of recently-graduated prospects, though the Braves probably won’t with Julio Teheran, Kevin Gausman, and Mike Foltynewicz likely taking up a couple of spots in the rotation while the kids fight it out for what is left. San Diego’s top five in projected innings were all prospects at this time last year except for Matt Strahm, who’d only lost his eligibility by a few innings. Behind them, the Pads have even more young arms coming, with Mackenzie Gore, Luis Patino, Adrian Morejon, Michel Baez, Anderson Espinoza, and Ryan Weathers all within a few years of possibly reaching their mid-rotation or higher potential.


2019 Positional Power Rankings: Right Field

We wrap up the position player portion of the positional power rankings with a look at the right fielders.

The top half of this list features some of baseball’s brightest stars, including two reigning MVPs (Mookie Betts and Christian Yelich), a $330 million man (Bryce Harper), and one of the game’s most vivacious personalities (Yasiel Puig), not to mention one of its literal biggest stars (Aaron Judge). There are a number of very talented young guys here (Cody Bellinger, Eloy Jimenez, Michael Conforto, Mitch Haniger) some of whom can boast of hardware of their own, and all of whom could become part of that star tier, even if their wattage isn’t nearly as bright as that of the Betts and Harpers of the world. There are also some platoons that could bear fruit, but outside of the top five teams, I’m struck by how much sameness there appears to be in the middle, as many teams are fielding aging veterans playing out the string, some of which are interested in winning, and others of which are decidedly not. An extreme to note: the Marlin’s right field situation is the only position player group currently projected for negative wins. Poor Curtis.


2019 Positional Power Rankings: Shortstop

After taking a look at center fielders and designated hitters yesterday, our positional power rankings continue with shortstop.

We’re in a golden era for shortstops. The late-1990s/early 2000s heyday of Alex Rodriguez, Derek Jeter, Nomar Garciaparra, and Miguel Tejada was not only pretty cool — at least before injuries and position changes broke up the band, and PED revelations retroactively dimmed our appreciation — but it ushered in an era of bigger, more powerful players at the position, and that trend has raised the bar for offensive production. Last year, shortstops hit a collective .259/.317/.416 for a 97 wRC+, five points higher than it had been in any other season since 2002 (as far back as our splits go), and trust me, it was worse than that previously, despite occasional concentrations of thumpers. In 2018, shortstops even outhit second basemen (93 wRC+) by a handy margin, something unseen within the narrow timeframe of our splits and constituting roughly a 10-point swing relative to the 2002-2017 period, in which second basemen outhit shortstops by a 95-89 margin according to wRC+.

It’s true that last year’s surge was helped by the inclusion of Manny Machado — who led all shortstops with a 141 wRC+, but has returned to third base as a Padre — and Javier Baez. But the top two hitters for the position from 2017, Zack Cozart (!) and Corey Seager, missed most of the season, with the former playing more third base than second base as well, and even Carlos Correa wasn’t really himself.

No, this is about the likes of Baez, Francisco Lindor, Xander Bogaerts, Trevor Story, Didi Gregroius, and even Jose Peraza — all of them 28 or younger, all but Gregorius 25 or younger — breaking out while offsetting the declines of Elvis Andrus and Brandon Crawford, the position’s geezers. More than ever, shortstop is a young man’s position. In 2018, nobody older than 31 (Crawford, Alcides Escobar, Jordy Mercer) made even 150 plate appearances as a shortstop. That trio all played at least 100 games at short, the lowest total of over-30 shortstops to do so since the majors expanded to 30 teams in 1998. As recently as 2016, there were six such players, and in 2014, 10; for the 1998-2017 period, the average was 7.4. Read the rest of this entry »


2019 Positional Power Rankings: Designated Hitter

Perhaps no position has been more impacted by the phenomenon of tanking than designated hitter. Teams that fancy themselves contenders splurge on elite bats like J.D. Martinez and Giancarlo Stanton, while teams out of contention rotate light-hitting utility infielders through without regard for the offensive demands of the position. The result is yet another year with a clear divide between the haves and the have-nots – a line that doesn’t really correlate well with how much is spent. Yes, the Red Sox, Yankees, and Twins brought in their primary DHs on lucrative contracts, but guys like Khris Davis and Shohei Ohtani cost far less. The Astros embraced the idea of using a homegrown positionless bat, employing Tyler White at a relative pittance. At the other end of the spectrum are teams like the Blue Jays and Orioles, who spent big a few years ago on positionless sluggers and now find themselves with sunk costs.

We can recognize four distinct tiers of DH in 2019. There’s the elite tier, which consists of one player alone – albeit one player who is arguably the best pure hitter in the majors. Then we have four teams with near-elite bats. What’s most interesting about those top two tiers is that none of those hitters came up as, or have experience at, first base; all but one are, at least nominally, outfielders. Those teams that do utilize erstwhile first basemen form a secondary tier of four well-above average hitters. The rest of the league employs hitters who either aren’t something yet, or used to be something, but aren’t now. If there’s a lesson to be learned from these rankings, it’s that spending on elite bats works. Spending on designated hitters doesn’t. Read the rest of this entry »


2019 Positional Power Rankings: Center Field

Our yearly project of ranking each team at each position continues with center fielders, the position of Mays and Mantle, the position at the crossroads of the offensive and defense parts of baseball’s positional spectrum. Let’s get straight down to the business of ranking the players who come after Mike Trout.

Nowadays, center field is largely seen as a position made up of Mike Trout and Everybody Else. And with a major identity crisis, that conclusion isn’t so far off. There’s no clash of center field greats, with Trout largely lapping the field. Looking at many of the leaders in WAR at the position over the last five years, a great many won’t play center field in 2019 or have already moved off the position: Andrew McCutchen, Charlie Blackmon, Adam Jones, Marcell Ozuna, Christian Yelich, and so on. After Trout and Lorenzo Cain, who jumps out as an all-around star at the position, the way a Carlos Beltran or Jim Edmonds did?

Nor, with baseball’s traditional roles changing, can center field claim to be the most popular home for leadoff hitters. In 2018, leadoff hitters played centerfield only 24% of the time, the lowest figure in the Split Leaderboards (which go back to 2002) and well off the 41% mark for 2013, just six years ago. Center fielders hit .253/.319/.407 in 2018, the position’s second-worst OPS since 2002, and amassed -3.4 wRAA, also their second-worst. Read the rest of this entry »


2019 Positional Power Rankings: Left Field

This morning, we considered the catcher position. This afternoon, the positional power rankings take us out to left field.

Has batted ball data and modern defensive positioning altered the defensive spectrum? It likely won’t surprise readers to learn that the average wRC+ by position starts with first base and right field, but it may be revelatory to learn that the gap between right and left field has been pretty wide. The last four years, the average right fielder has produced an average wRC+ 4.75 ticks higher than his counterpart in left. The offensive bar at third base has also been higher on average than in left field during the last four years.

Why? Perhaps improved defensive positioning on the infield has enabled more bat-centric players to play third base when, in years past, they’d be at first. Most hitters are right-handed, and increased focus on pulling the ball in the air could have quickly made defensive range in left field more important than it has been in the past. The average sprint speed among left fielders is now on par with that at shortstop. Is it a long term, tectonic shift that should impact things like prospect evaluation? It’s hard to say definitively at this point because so much about the game is changing and still has the potential to change. But it’s worth discussing — eventually. For now, here are our current left fielders. Read the rest of this entry »