There are generally three ways of bringing new players into a baseball organization: trades, free agency, and amateur signings, either through the draft or international free agent market. There isn’t necessarily a “best” way, as successful teams are built using a wide variety of methods. The table below shows WAR totals for the first half of the season split into the three categories above, along with waivers and Rule 5 picks, which constitute a very small portion of the total:
As the chart shows, homegrown talent and players acquired through trade come out pretty far ahead of free agency. In terms of the sheer number of players, there are over 400 in each of the homegrown and trade sections, with around 300 in free agency. As for the impact, it’s hard to argue with the importance of homegrown players when looking at the graph above. Breaking the homegrown section down, we can see how each team has done this season with players they’ve drafted or signed internationally and then developed in their organization:
Adam Ottavino has had a strange 2019. Last year, he reinvented his game in a single offseason. This year, he’s mostly sticking with what worked in 2018, and the results have been pretty good. Despite pitching in homer-happy Yankee Stadium, he’s posted a 1.80 ERA (39 ERA-), and his strikeout rate is a gaudy 32.2%. He easily could have been an All-Star, even if his FIP is a less-inspiring, if still good, 3.85. His walk rate, too, has spiked — to 15.8%, near a career high. It’s too early to say whether Ottavino will back up his breakout 2018 or regress closer to his FIP by season’s end.
What it’s not too early to say, however, is that watching Ottavino pitch this year is an absolute joy. His slider, which he throws more than 40% of the time, has always been his calling card, and it’s as fun as ever, taking a great liquid arc across the plate that can make you question physics. His fastball, a hard two-seamer that he uses more like a four-seam fastball, locating it high in the zone, is a delightful offset to the slider. His cutter — well, his cutter isn’t as fun to watch as the other two pitches, but it sits in between them in velocity and movement and helps disguise everything else. What’s so great about Ottavino, though, isn’t just his raw stuff. It’s the way he uses those pitches that is so fun, and this year, he’s using them to get called strikes by the bucketload.
When you picture a 2019 slider in your mind’s eye, you might picture Ottavino’s, or maybe Patrick Corbin’s. Big break, the batter desperately trying to adjust his swing to hit something that’s falling down and away from him, and the catcher blocking a bouncing ball to record a strikeout. Ottavino still has that pitch in his arsenal, of course. Take a look at him going right after noted slider-masher Lourdes Gurriel and coming out on top:
The past year has been a whirlwind for Liam Hendriks. A little over a year ago, he was designated for assignment by the Oakland Athletics. At that point in the 2018 season, he was sporting a 7.36 ERA with an ugly 6.43 FIP while also missing more than a month with a groin strain. No one claimed him on waivers and he was sent outright to Triple-A. He worked hard to regain his confidence while also honing his repertoire. He was recalled in September and pitched well enough as an opener to get the start in the Wild Card game against the Yankees. However, that game didn’t go to plan after an Aaron Judge two-run homer got the home team on the board early.
Even after all those setbacks, Hendriks has flourished as a critical piece in the A’s bullpen this year. He started the year in a familiar role, making a couple of opener starts and coming out of the pen as a middle reliever. But as the back-end of the Oakland bullpen began to struggle, Hendriks found his way into higher leverage situations. The climax of his year-long turnaround came when he was named to the American League All-Star team as a replacement for Charlie Morton.
Here’s how Hendriks stacks up against his fellow All-Star relievers and a few other top candidates.
Highlighted relievers selected to All-Star roster.
Any of the other candidates listed above could have been chosen and no one would have batted an eye (ok, maybe not Ian Kennedy). But Hendriks leads the AL in WAR as well as park- and league-adjusted ERA. He’s been terrific, and the adjustments he’s made since last September are driving his newfound success. Read the rest of this entry »
Pitchers learn and develop different pitches, and they do so at varying stages of their lives. It might be a curveball in high school, a cutter in college, or a changeup in A-ball. Sometimes the addition or refinement is a natural progression — graduating from Pitching 101 to advanced course work — and often it’s a matter of necessity. In order to get hitters out as the quality of competition improves, a pitcher needs to optimize his repertoire.
In this installment of the series, we’ll hear from three pitchers — Pete Fairbanks, Jack Flaherty, and Will Smith — on how they learned and developed their sliders.
———
Pete Fairbanks, Texas Rangers
“My coach — this was in summer ball when I was 14 or 15 years old — was Matt Whiteside, who I believe pitched for the Rangers back in the day. He showed me a grip and said, ‘Hey, kind of just turn your wrist; turn it on the side when you throw it.’ It’s possible that it was originally taught to me as more of a curveball, but looking back it’s always had slider characteristics to it. Regardless, that was my introduction to a breaking ball.
Pete Fairbanks’ original slider grip.
“The grip was similar to the one I have now, although it has varied over time. My slider has been good and bad. For instance, it was really cutter-y in 2017; it was very flat. It had six-to-eight inches of lift to it, which obviously isn’t what you’re looking for from a slider. You’re trying to get closer to zero. But with the tweaks I’ve made to it this year, it’s really taken off.
“I worked with one of our systems guys, Sam Niedrorf, when I was down in High-A. He was the guy who was feeding me all of my numbers on it, so I could fiddle with it to get it where it needed to be this year. We had a portable TrackMan, and I threw a couple of bullpens in front of that. Read the rest of this entry »
One of the effects of the top-heavy American League and the middle-heavy National League was the NL posting a 158-142 record in interleague play last season. While the AL took the All-Star Game in extra innings and the Boston Red Sox won the World Series, the NL won more regular season games. We don’t yet know how this year’s All-Star Game or World Series will play out, but the NL has again taken a healthy lead when it comes to interleague play with an 83-65 record through games on July 1. Last year, the AL appeared to have the edge on paper when it came to the All-Star Game rosters, but the teams seem evenly matched this season.
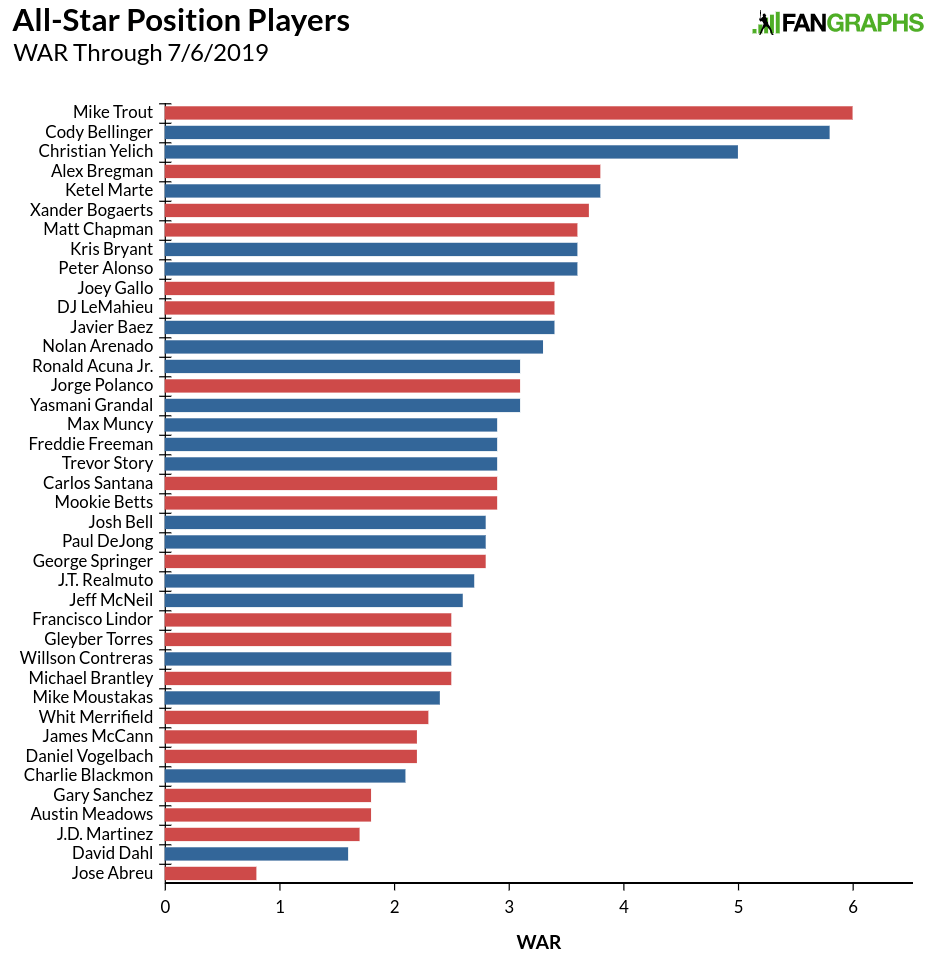
The graph below shows all position players named to the initial All-Star Game rosters through play on July 6.
The National League has three of the top five spots with Mike Trout and Alex Bregman representing the AL. After Trout, the NL is represented by 12 of the next 17 players. The American League does have some pretty big names with better track records near the bottom of the graph like Mookie Betts, Whit Merrifield, Francisco Lindor, and J.D. Martinez, those players have yet to put everything together this season. The NL has a roughly seven-win advantage at 62.9 to 55.9, which amounts to roughly a third of a win per player. As Devan Fink noted last week, the All-Star starters by WAR weren’t too far off from the actual results, and Xander Bogaerts‘ late inclusion means the top nine players by first-half WAR made the team. Of the top-30 position players by WAR, only Marcus Semien, Max Kepler, Rafael Devers, Yoan Moncada, and Eduardo Escobar failed to make the rosters.
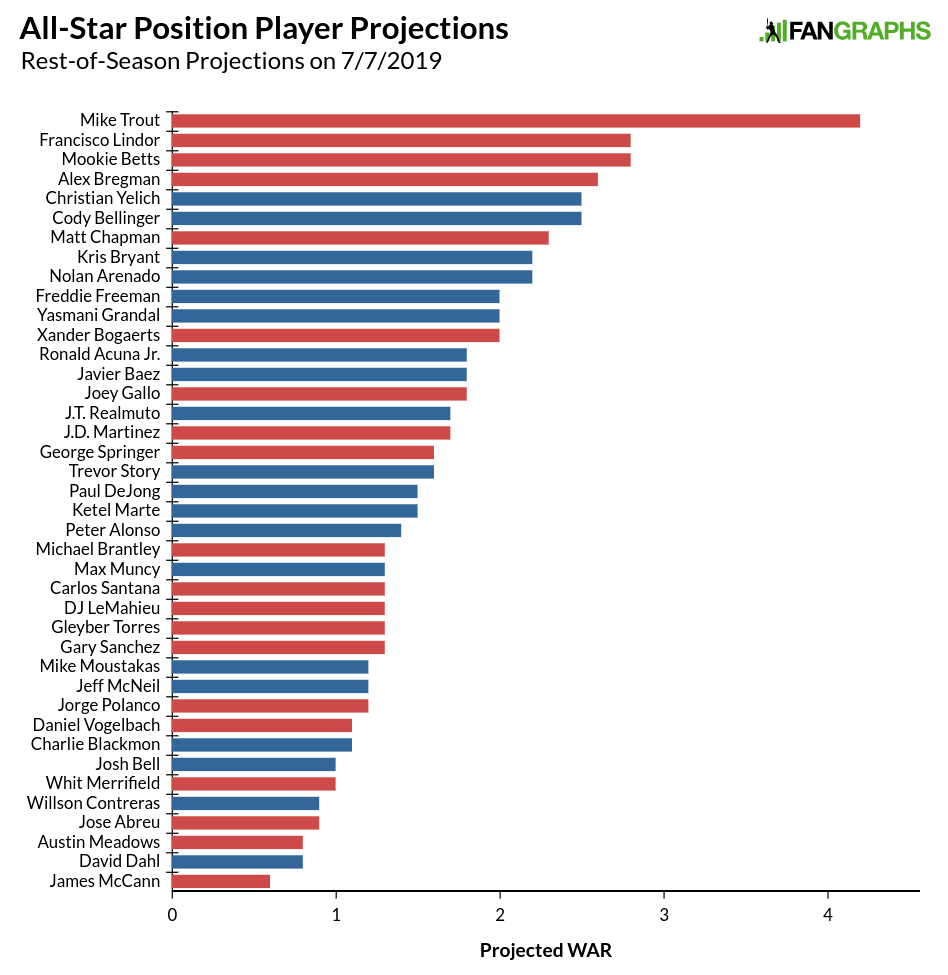
Looking solely at half a season’s worth of games isn’t necessarily the best indicator of talent. One could argue that the best measure of how good a player is right now might be that player’s projections over the course of the rest of the season. Here are those projections in graph form.
That Mike Trout is something else. His 4.2 projection for the second half of the season is far and away ahead of everyone else. His half-season projection would have placed him among the top 30 preseason projections. Put another way, if Mike Trout only played in every other game, he would still be All-Star worthy. We see Betts and Lindor’s talent level rise near the top of the graph above, and the NL can’t quite recover. Before roster changes, the NL had the advantage, but taking away Anthony Rendon from the NL and replacing Hunter Pence in the AL shifted the projections toward the AL with a 33.9 to 32.2 WAR advantage. Even with Trout, the AL still trails the NL in projected WAR, 34.9 to 33.7.
This how the position player side of the rosters break down.
2019 All-Star Position Players
WAR
ROS Projections
Total
NL
62.9
32.2
95.1
AL
55.9
33.9
89.8
Difference
7.0
-1.7
5.3
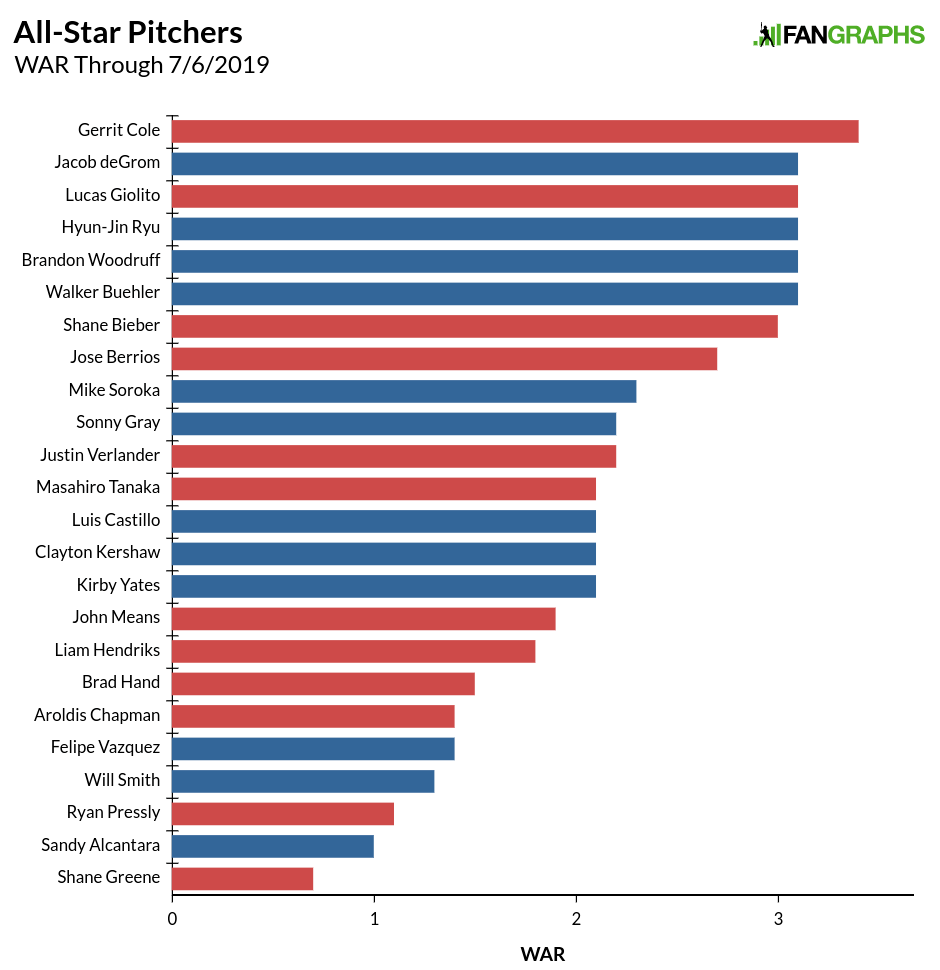
On the pitching side, the AL is bringing two more relievers than the NL, so in total WAR, the NL has a built-in advantage given the innings starters can pile up, though removing Max Scherzer leaves a pretty big dent in the NL squad’s top of the rotation.
The NL tops the AL 26.9 to 24.9, with the additional starters tipping things to the senior circuit. Given ERA’s relative prominence, we might expect a few more missing players from our WAR leaderboards in the midsummer classic, though we still have a pretty good representation based on WAR. Lance Lynn, the AL’s WAR leader, did not make the squad. The only other pitcher in the top 12 not to make the roster at some point in this process was Stephen Strasburg. In the top 20, Frankie Montas, who is suspended, didn’t make the team for obvious reasons, while Matthew Boyd, Chris Sale, Zack Wheeler, and German Marquez also failed to make the team. Several players in the bottom half of the graph above were their respective team’s lone representative, indicating that some of the choices are more roster filler than picking the most deserving players.
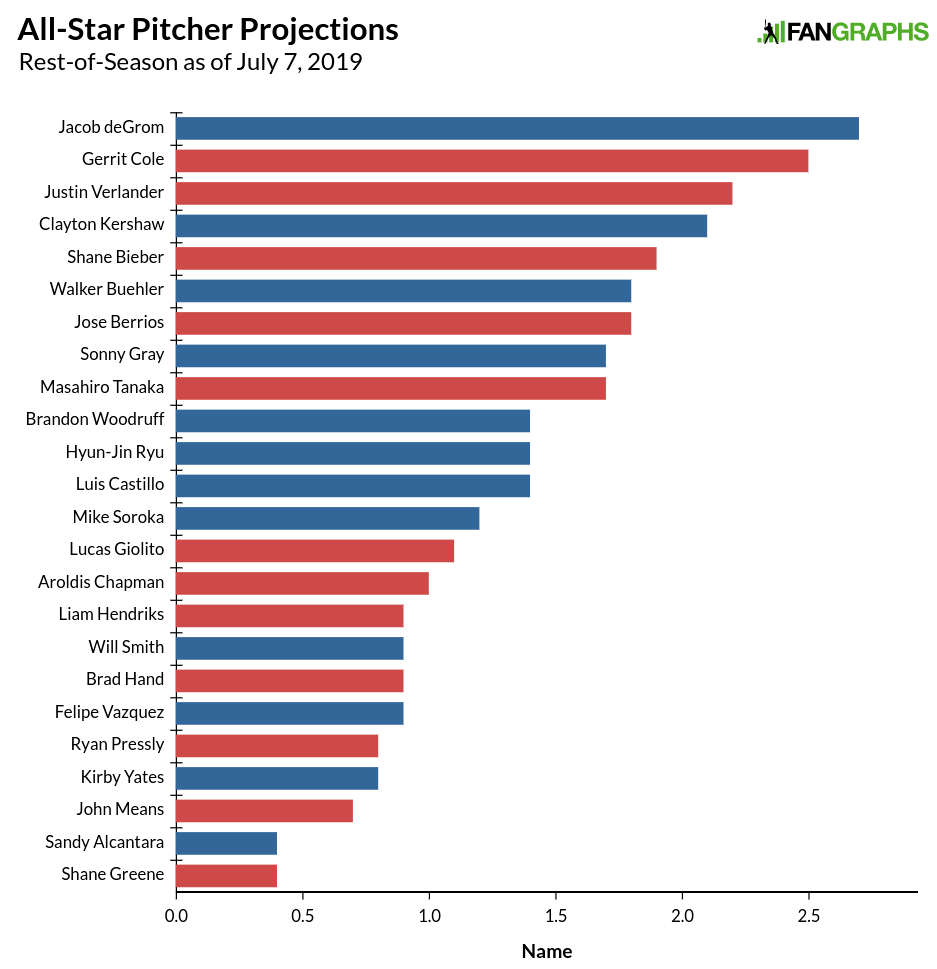
As for the projections, even without Scherzer, the NL still has the top projected pitcher in Jacob deGrom.
Without Scherzer, a sizable NL advantage shrinks down to less than a win. All of the relievers near the bottom along with Baltimore’s John Means and Miami’s Sandy Alcantara help create the NL’s small advantage due to fewer relievers. In terms of projections, Chris Sale is the big name missing. In comparing the pitching staffs, the leagues look like this:
2019 All-Star Roster Pitchers
WAR
ROS Projections
Total
NL
26.9
16.7
43.6
AL
24.9
15.9
40.8
Difference
2.0
0.8
2.8
When we put it all together, the NL has the advantage in performance so far this season, but the projections are nearly identical.
2019 All-Star Rosters
AL
NL
Difference
Position Player WAR
55.9
62.9
7.0
Pitching WAR
24.9
26.9
2.0
TOTAL
80.8
89.8
9.0
Position Player Proj. WAR
33.9
32.2
-1.7
Pitching Proj. WAR
15.9
16.7
0.8
TOTAL
49.8
48.9
-0.9
Before the injury replacements, the NL’s advantage was sizable. Losing the two Nationals’ stars in Rendon and Scherzer was a pretty big blow and essentially leveled the playing field in terms of talent. At the end of the year, the NL squad is likely to outproduce their AL foes. As for how much this advantage will actually matter in the All-Star Game, it probably won’t. It is a one-game exhibition and the game isn’t played repeatedly over the course of a season. With similar projections, the leagues looked pretty balanced. The American League has won the last six All-Star Games, but that history isn’t likely to matter for this year’s contest.
Nathan Eovaldi hasn’t pitched in a major league game since April 17, and he won’t until sometime after the All-Star break, but this week, before even beginning a rehab assignment, he’s been cast as a potential solution for one of the Red Sox’s biggest weaknesses: their bullpen. On Tuesday, in the aftermath of the team’s drubbing by the Yankees in the two-game London Series — during which that bullpen was torched for 21 runs and 23 hits in 12.1 innings — manager Alex Cora and president of baseball operations Dave Dombrowski announced plans to use Eovaldi as their closer, a job the 29-year-old righty has never held before.
Eovaldi, who is recovering from arthroscopic surgery to remove loose bodies in his right elbow, struggled with his command and control while making just four starts in April, getting hit to the tune of a 6.00 ERA and 7.12 FIP. That comes after last year’s strong rebound from his second Tommy John surgery, during which he threw 111 innings with a 3.81 ERA, 3.60 FIP, and 2.2 WAR. Integrating a relatively new cut fastball into his arsenal, he set career bests with a 22.2% strikeout rate and 4.4% walk rate. As Jeff Sullivan pointed out last November, his penchant for pounding the strike zone with such precision is rare among pitchers with such high velocity — and oh, can he bring it. According to Pitch Info, his average fastball velo of 97.4 was tied for third among all starters with at least 50 innings.
Eovaldi has rarely pitched out of the bullpen during his eight-year major league career, not only never notching a save in eight regular season relief appearances — four with the Dodgers as a rookie in 2011, three with the Yankees in an exile from the rotation in 2016, and one last year — but never even pitching in a save situation.
That said, he shined amid his crash course in high-leverage relief work last October, making four appearances during Boston’s championship run, two of them in save situations and one in extra innings. He threw 1.1 scoreless innings in front of Craig Kimbrel in the ALCS Game 5 clincher against the Astros, two days after making a strong six-inning start, then added scoreless innings in Games 1 and 2 of the World Series against the Dodgers, and pitched the final six innings of the 18-inning epic Game 3, taking the loss when he served up a solo homer to Max Muncy but winning the hearts of New England for his gutsy, 97-pitch effort. That was the only earned run he allowed in 9.1 relief innings; he yielded four hits and walked one while striking out seven.
I’m here today to tell you about a player who has been hitting the ball tremendously hard of late. That’s nothing new — it’s a common genre of FanGraphs article. You know the deal, because I’ve written plenty of them this year already. Josh Bellis great now, Pete Alonso only hits lasers, Niko Goodrumcan apparently hit, etcetera. Inevitably, these stories catch players near a performance peak. That’s just the nature of the beast; when you look for noteworthy and exceptional performances to write about, there’s very likely some luck involved, even if the underlying statistics look good.
The ideal form of this type of article finds something that’s truly different about the player, something other than mere batted ball luck. Josh Bell’s simplified stance, for example, really is different. Even so, baseball is a game with a lot of inherent luck to it, and if you single someone out for doing tremendously well, there was probably some luck involved. Today, though, we’re going to subvert the genre. Today, let’s look at a player who is, per the trope, hitting the ball harder than ever and turning fly balls into home runs at the highest rate of his career. There’s a twist, though: Wil Myers is doing all that, but he’s also having his worst season in five years. That sounds like something worth writing about.
Myers has always had power. He’s had a 30 home run season and a 28 home run season despite playing in a home park that suppresses home runs. Despite that, 2019 is seeing the highest HR/FB% of his career. (All stats are through Tuesday’s action.) His exit velocity on line drives and fly balls is in the 97th percentile of hitters with 50 air balls this year, tied with teammate Franmil Reyes. He doesn’t fare quite as well in terms of barrels per ball hit in the air, as he’s been a bit inconsistent, but he’s still in the top 20% of baseball. There are no two ways about it; Wil Myers is hitting baseballs as hard as he ever has.
So, what have the offensive rewards of Myers’ bruising new power been? He’s batting .218/.314/.399, good for a 91 wRC+. His batting average is the lowest of his career, and his OBP and slugging percentage are higher only than his disastrous 2014 Rays campaign. That batting average is especially jarring when you consider that it’s not BABIP-driven; he’s batting .316 on balls in play, higher than his career average and significantly higher than his Depth Charts projections. High BABIP and low batting average? Strikeouts have to be the culprit here, and my goodness, Myers has struck out a lot this year — 35.6%, to be exact. Read the rest of this entry »
Last week, I saw Dodgers lefty Clayton Kershaw in person for the first time. While he’s no longer the dominant force of nature he was at his peak — Kershaw’s fastball now sits 89-91, rather than sitting 92-94 and touching 97 as it did 2015-2017 — he’s still a very effective big league starter, on pace for a 4 WAR season, and the owner of a 3.51 xFIP across just under 100 innings pitched ahead of the All-Star break.
This is far from the first piece on this website to chronicle what makes Kershaw great as, over the last decade, he’s improved his command, and altered his pitch mix and pitching approach. What I suggest today is that part of his continued success also has to do with, simply, how he releases the baseball, and that this trait is identifiable in prospects.
It’s probably obvious to you that things beyond mere raw velocity contribute to fastball effectiveness. You can probably deduce what some of those things are through simple pattern recognition; the System Summary from this prospect list is an example of that. From having done this for a while now, there are common, visually identifiable characteristics shared by pitchers whose strikeout results outperform what we might anticipate given just their velocity, just as there are common mechanical/stuff-related attributes targeted by successful teams in the draft. (Those teams have also made mechanical and/or approach alterations to players they’ve acquired.) Spin rate, extension, vertical and horizontal approach angles, and spin direction/efficiency all play a role, too, as does command.
The more those traits serve to support vertical movement — a.k.a ‘rise’, life, carry, Z-break — the more swings and misses a fastball tends to generate. And when a fastball exhibits several of these traits, you can end up with a dominant heater despite limited velocity. Without them, I’ve been bamboozled by otherwise visually pleasing stuff. And indeed Clayton Kershaw’s fastball has some of these attributes. At 88-91, his fastball is still fine. In the mid-90s, it was utterly dominant.
The way we talk about these traits in scouting and player development is not yet entirely consistent across baseball. I was on the phone with an in-office analyst last week discussing what would eventually become this article, and we were using the same terms to describe different things, which caused us to argue for about 10 minutes before we realized we were simply miscommunicating. This video and these twoarticles provide a great foundation for understanding how pitches need to spin in order to create vertical movement. The version that has been most intuitive for me is the Rapsodo/TrackMan version, which describes spin direction by using a clock face from the pitcher’s perspective. The closer fastball tilt gets to 12:00, the more backspin it has. For the purposes of this article, I’m just looking at lefties, but you’ll be interested to know that some frequently-asked-about prospects like Zac Gallen (12:30 spin axis on the fastball), Astros RHP Jose Urquidy (91-95, up to 97, plus changeup and command, smart breaking ball usage, a 12:30 spin axis on the heater), and Ashton Goudeau (90-93, also has 12:30 spin axis, plus split/change) have some of the traits I’ve talked about.
It’s fair to watch a pitcher’s arm angle and assume that vertical arm slots create the kind of backspin we’re looking for, but we can better see the ball/hand relationship, including sub-optimal ones, using our high-speed camera, Slomie. If you didn’t read the Driveline and Laurila background articles, we’re looking for something close to pure backspin and seam uniformity. You’ll be unsurprised to see Clayton Kershaw exhibit both. At peak, he was averaging over 12 inches of Z-break on his fastball. He’s closer to 10 inches now, which is still above league average:
Spin rate is a factor here, too, and we have those for most of the minors. So based on information we have, here some lefty pitching prospects who I think also exhibit some of these Kershawian traits. I don’t anticipate any of them becoming as incredible as Kershaw, but they do possess mechanical characteristics that will enable them to get the most out of their stuff. Full scouting reports for most of these players can be found on THE BOARD.
MacKenzie Gore, San Diego Padres
Gore has all the components: the velocity, the spin axis, the seam uniformity, elite athleticism, some natural mechanical deception. He doesn’t spin his curveball as well as Kershaw, but his changeup is better. He’ll be in Sunday’s Futures Game.
Joey Wentz, Atlanta Braves
Wentz doesn’t have the quality breaking ball but his fastball plays well above it’s 88-91, and he has good changeup feel.
Ethan Small, Milwaukee Brewers
The Brewers 2019 first rounder is Kershaw’s mechanical doppelgänger. In 2019, he struck out 176 hitters in 107 innings for Mississippi State, most of them in the SEC, while sitting 88-92.
Joey Cantillo, San Diego Padres
Cantillo, a 2017 16th rounder out of a Hawaii high school, only sits about 88-92, but the life on his fastball and the quality of his secondary stuff has him missing lots of bats in the Midwest League. He hasn’t allowed more than one run in a start since April 26.
Tarik Skubal, Detroit Tigers
Skubal’s full report is on The Board. He ranks 14th in the minors in swinging strike rate.
Erik Miller, Philadelphia Phillies
He doesn’t get into his legs the way Kershaw does, and the velocity fluctuations Miller has experienced over the last year and a half is a bit concerning, but he has the pitch specifications I’ve outlined above and knows how to mix his stuff.
Burl Carraway, Dallas Baptist University
I anticipate Kiley will have high speed of Carraway in the coming days, as he’s been electric for Team USA recently, up to at least 97 with a knockout breaking ball.
Drew Dowd, Junipero Serra HS (CA) and Ross Dunn, Cottonwood HS (UT)
These were the two high schoolers at PG National whose fastballs I thought played up above their velocity for the reasons I’ve outlined above, though Dowd might be better off working with a four-seamer.
Pitchers learn and develop different pitches, and they do so at varying stages of their lives. It might be a curveball in high school, a cutter in college, or a changeup in A-ball. Sometimes the addition or refinement is a natural progression — graduating from Pitching 101 to advanced course work — and often it’s a matter of necessity. In order to get hitters out as the quality of competition improves, a pitcher needs to optimize his repertoire.
In this installment of the series, we’ll hear from three pitchers — Carson Fulmer, Lucas Giolito, and Clayton Richard — on how they learned and developed their changeups.
———
Carson Fulmer, Chicago White Sox
“I’ve always thrown a four-seam fastball, so early on I wanted to throw a four-seam changeup. I could never get enough velocity off of it, so I needed to come up with something else. What I came up with was kind of a fosh. This was about two years ago. But I couldn’t find enough consistency in the zone — it would throw me into bad counts — so I kind of got away from it. Read the rest of this entry »
In April, Matthew Boyd gave up two homers. In May, five balls left the yard against the Tigers lefty. Last month, Boyd’s breakout season slowed as he gave up 10 homers. As we enter July, Boyd has a solid 3.57 FIP and a 3.72 ERA, and has been worth 2.6 WAR, which ranks 17th among pitchers this season. Those are good numbers to be sure, but as June began, Boyd’s ERA and FIP were both 2.85 and his 2.5 WAR ranked third for pitchers behind only Max Scherzer and Stephen Strasburg. Boyd’s strikeouts and walks have been slightly better than they were earlier in the season; his BABIP is slightly higher and his LOB% is a little bit lower. But that doesn’t explain his 5.90 ERA and 5.37 FIP. It’s the home runs that are hurting Boyd, and with the trade deadline a month away, trying to determine whether they are randomly bunching across a few starts or the beginning of a trend is an important exercise for teams looking to reinforce their rotations.
As for how Boyd broke out in the first place, the answer is a bit easier to find — the work has already been done for us. Sung-Min Kim detailed Boyd’s transformation earlier this season, showing how Boyd lowered his arm slot to gain spin on his fastball, and raised the location of the pitch. He also buried his slider more often, gained a consistency in his delivery, and basically eliminated the two-seamer. David Laurila also wrote on Boyd earlier this season, discussing his work with Driveline to create a better slider.
Boyd’s season can be carved up any number of ways depending on how you might want to use (and abuse) arbitrary endpoints. If we took away the first three spectacular Boyd starts of the season, where he struck out 29 and walked six, his FIP is 4.09, his ERA is 3.95, and he’s averaging nearly two homers every nine innings. If we look at just his first 10 starts, he’s one of the best pitchers in baseball. He has five starts with 0 or 1 runs. He’s only got two starts where his strikeouts don’t at least equal his innings pitched. The only time he walked as many as three batters, he struck out 13 Yankees. If Boyd had evenly spaced out his 17 homers across his starts, we’d be discussing a moderate breakout. Instead, we have a massive breakout followed by concern. Read the rest of this entry »