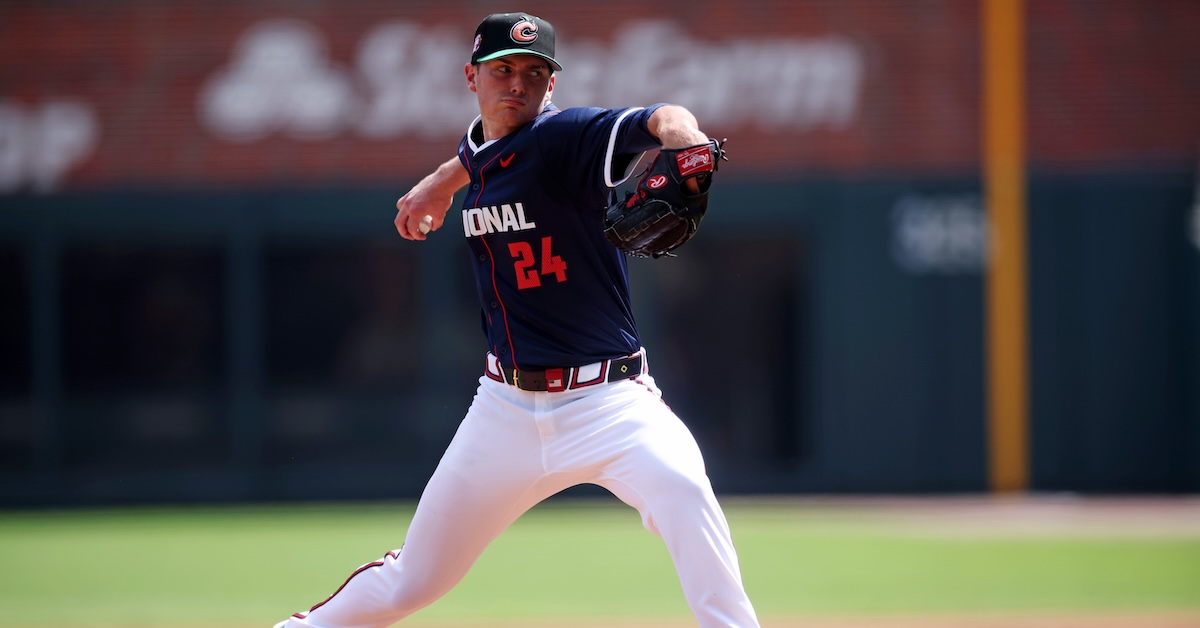
Chase Lee is now a Blue Jay after enjoying a mostly successful 2025 rookie season as a Tiger. The 27-year-old, sidewinding right-hander made 32 relief appearances with Detroit, logging a 4.10 ERA, a 24.3% strikeout rate, and a 6.1% walk rate over 37-and-a-third innings. He allowed 32 hits, seven of which left the yard, and was on the winning end of four of five decisions. Toronto acquired him in exchange for 24-year-old farmhand Johan Simon in mid-December
He was originally in the Rangers system. Texas took Lee in the sixth round of the 2021 draft out of the University of Alabama, only to move him to Motown at the 2024 trade deadline as part of the Andrew Chafin deal. Lee then headed into last season with Eric Longenhagen calling him a “a sinker/slider sidearmer who has posted strikeout rates up around 30% his entire minor league career… a high-probability up/down look reliever.” That proved accurate. Lee rode the Detroit-Toledo shuttle multiple times, making 23 appearances as a Mud Hen.
Talking to him Jays camp on Friday, I learned that the well-educated hurler places a high value on the information he gets from hitters.
“That’s where pitchers get a lot of their information,” the Alabama graduate told me. “When I’m working on new pitches, new shapes, new locations — whatever it may be — I normally go to the hitting coaches. It’s like, ‘Hey, if your team were to face me, what would the plan be?’ I take that, then it’s, ‘OK, how can I mess up that plan?’
“I did this the other day,” the former walk-on to the Crimson Tide baseball team added. “I talked to Cody Atkinson, who is one of our hitting coaches here. I knew Cody in [the Texas Rangers organization]. I asked him to write me a 30-second report on what he would tell hitters to do if we were on different teams and I was coming into a game. He said he would tell them to look in a certain location, for these two pitches. If I were to instead throw a fastball up, or a fastball in, that would ruin the entire plan.” Read the rest of this entry »
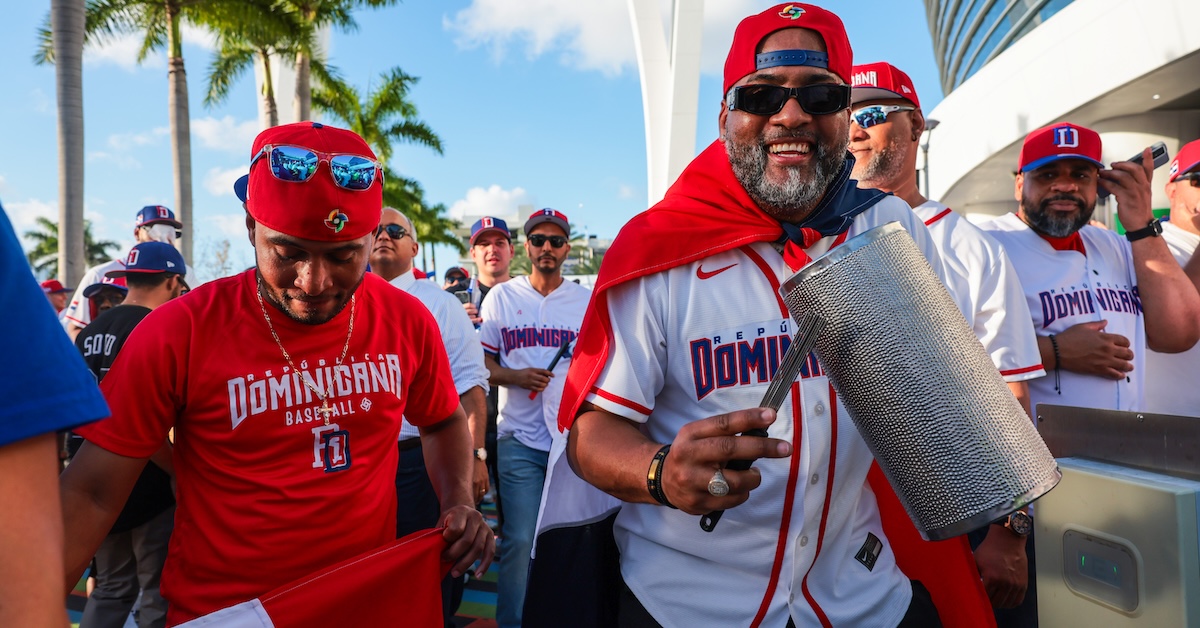
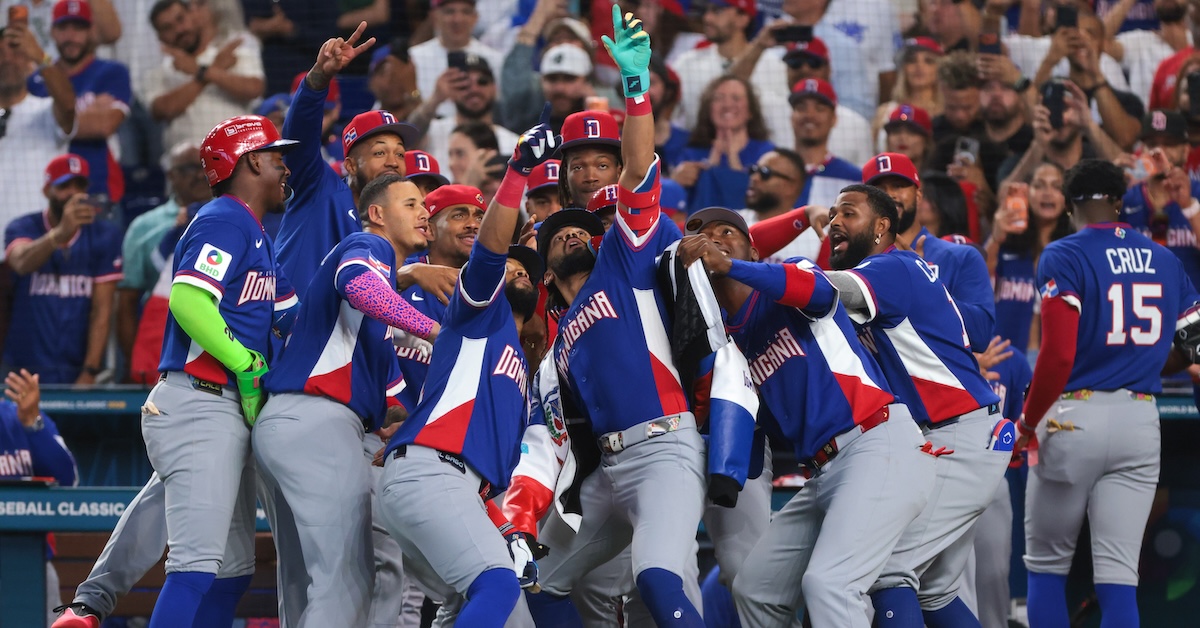
I’ve covered Red October playoff games in Philadelphia, and white out football games at Penn State. I’ve also attended professional games in Panama and covered plenty of Little League World Series games, giving me a taste of how different cultures enjoy baseball. But I have never witnessed a sporting event quite like Wednesday night’s World Baseball Classic game between the Dominican Republic and Venezuela.
It wasn’t just the chanting, the instruments blaring, or the dancing that made for such an exhilarating experience; all of those things were also a part of the previous Pool D games played by the Dominican Republic and Venezuela. I know what passionate fandom looks and sounds like, and this was something altogether different. Venezuelan and Dominican fans don’t merely watch baseball; they participate in it. It’s kinetic, and when the force of their fandom collided under the closed roof of loanDepot park, it created a unique, unforgettable energy. I hope all of you reading this can experience something like it at some point in your life, because getting to feel that power pulsing through the stadium is one of the great privileges of this job.
That’s the last we’ll talk about the WBC in this week’s mailbag. Instead, we’ll be answering your questions on how baseball would change if it were played exclusively left-handed, how often we might see an Ultimate ABS Challenge, and whether the 2026 Angels roster would’ve been a playoff team in 2024. But first, I’d like to remind you that this mailbag is exclusive to FanGraphs Members. If you aren’t yet a Member and would like to keep reading, you can sign up for a Membership here. It’s the best way to both experience the site and support our staff, and it comes with a bunch of other great benefits. Also, if you’d like to ask a question for an upcoming mailbag, send me an email at mailbag@fangraphs.com.
__
How would baseball change if there was no such thing as right-hand dominance? All hitters and pitchers from the game’s inception to the present performed exactly the same, except now all as left-handed throwers and hitters, exclusively?
How different would that be from a baseball universe in which everyone was exclusively right-handed?
From,
“Transmission”
Michael Baumann: I’d like to begin by saluting you, Transmission — I’m gonna call you Mish for short — for submitting the best mailbag question I’ve ever received. Better than the dog first baseman one, better than the one about why God hates the Reds. Nothing’s even close.
The first thing that comes to mind is that if everyone in the world were left-handed we would absolutely be running the bases the other way. Most obviously because of the way the infield is oriented now, three of the toughest defensive positions are incredibly awkward to play as a left-handed fielder. So much so that you never see it past the dandelion-picking levels of Little League.
I know that lefties get an advantage over righties by being closer to first base, but there’s a logic in having the batter run to the base he’s facing. The big question is whether baseball’s founding fathers would have bothered to create a right-handed batter’s box at all. And conversely, would an all-right-handed baseball league have created a left-handed batter’s box? (For what it’s worth, if everyone threw with the same hand, I don’t think it’d matter which hand it was; all-lefty baseball would look the same as all-righty baseball, just in reverse.)
But if everyone in baseball hit from the same side of the plate, pitching strategy would be enormously different than it is in our ambidextrous world. The value of the platoon advantage was understood very early on in the history of the game; switch-hitters came into existence around the same time as the baseball glove, in the 1870s.
If every player in the league were left-handed, and it was understood that hitters fared better against breaking pitches that moved toward them, would anyone have ever developed the sinker or the changeup? Probably — even now, you see pitchers whose offspeed pitches are dominant enough to be effective against same-handed hitters — but the shape and deployment would probably be different. Creating screwball action would take a backseat to deception; for that matter, maybe breaking pitches would have developed on a continuum of shape and speed, rather than being distinct, the way we separate sliders and curveballs now.
But if I had to guess, I’d say that entirely left-handed baseball would have developed symmetrical batting positions, as ambidextrous baseball has in real life. I’m not aware of a stick-and-ball sport that forces the player to address the ball from a specific side — then again, we live in a world where right-handed people exist, which would not be the case in Mish’s hypothetical.
A left-handed grip on a baseball bat — which is to say, left hand on top, right hand on the bottom — is also a left-handed grip on a variety of tools that would’ve been familiar to 19th Century Americans: axes, brooms, shovels, even swords. It stands to reason that baseball would’ve evolved along those lines.
But maybe not universally so.
When I was growing up, the kids in my neighborhood would play street hockey every afternoon, from when school got out to when it got dark. Hockey has left- and right-handed shooting positions that correspond with the batting positions of the same name. I write right-handed, I throw and hit right-handed, and I play hockey right-handed. Most of the kids I grew up with were also right-handed and played baseball right-handed, but in hockey they shot lefty.
In both baseball and hockey, the fine control of the bat or stick is done with the top hand — that’s where you want your dominant hand. But because the baseball bat is held up, the top hand is further from the knob, while the hockey stick — held close to the ground — has the top hand at the knob. In order to put the dominant hand in control of the stick, a right-handed hockey player would have to shoot lefty.
Most of my left-handed-shooting friends learned how to play hockey before they learned how to play baseball, so if they were right-handed they were taught to shoot lefty. I came to hockey later, after already having committed to a right-hand-over-left baseball grip, so I played hockey with the same hand position.
The point is, it’s easier to hit right-handed if you’re naturally right-hand dominant, but not by much. It can be learned or unlearned fairly quickly; plenty of high-level ballplayers who don’t switch-hit in games will switch-hit in practice for their own amusement.
If a right-handed batter’s box were available by rule, it would take about 10 seconds for someone to try to figure out how to gain an advantage by using it. It would start with the kind of jailbreak swing you see from left-handed fast-pitch softball players. (Remember, we’re running the bases clockwise in this hypothetical.) Before too long, an enterprising switch-hitter would realize that he was having an easier time seeing left-handed breaking pitches and commit to hitting righty full-time.
Eventually, the entire league would follow suit. If every pitcher you face is left-handed, why would you ever subject yourself to a platoon disadvantage if you could avoid it? So eventually, some left-handed pitchers would experiment with throwing righty, which would be awkward but not impossible. Remember, Billy Wagner is naturally right-handed. (So is Michael Vick, if you want a non-baseball example.)
From the start of the National League in 1876, it took 119 years for Greg Harris to come along and pitch with both arms in a single game. That was a novelty act from a pitcher on the verge of retirement; it’d be another 20 years before Pat Venditte reached the majors. Soon, Jurrangelo Cijntje will come to the majors with conventional big league-quality stuff from both sides.
In a world where every pitcher throws left-handed and every hitter is left-handed but bats righty, the evolution toward non-dominant-hand pitching would not take nearly that long. Eventually, we’d see a mix of switch-pitching and switch-hitting players, and maybe even right-handed-throwing first basemen.
From there, how long until baseball players start trying to write with their non-dominant hand, too? Would baseball bring an end to this wholly left-handed world? Is this thought experiment inherently self-negating? Fascinating stuff.
__
Dear Mailbag,
Let’s define the Ultimate ABS Challenge as the following: bottom of the ninth or later, bases loaded, two outs, full count, and either a walk or a strikeout is challenged. Is it possible to estimate the likely frequency of future UABSCs? We would be looking for past walks and strikeouts in that area in which Statcast suggested the ball was within, say, 1.5 inches of the edge of the zone on either side of it, I should think.
Thanks!
Andrew
Ben Clemens: What an incredibly specific query! The answer is that this is probably going to happen almost never. Forget the distance from the borders of the strike zone. From 2021 to 2025, there were exactly 23 pitches that meet the rest of your criteria: bases loaded, bottom of the ninth or later, full count, two outs, taken for a strike or ball. Here’s a Baseball Savant search string for that.
Out of those 23 pitches, 15 were taken for balls. Those balls were all pretty far outside the strike zone. The closest one was 1.7 inches off the plate, and that’s grading generously. Statcast measures the location of the center of the ball; I, of course, included the radius of the ball in my calculations. Sure, the Cardinals would have challenged that one, but I don’t think there’d be much drama. No one on either team thought that it was a strike.
Out of the eight pitches taken for a strike, only one had a location within 1.5 inches of being overturned on a challenge. That’s this bending changeup from Tyler Holton, and it would have been overturned. The closest among the others was this slider from J.B. Bukauskas that dotted the inside corner. I’m sure Amed Rosario would have challenged it, but the truth is that it was in the zone by a lot. It’s a strike if any part of the ball clips the zone, and the center of this one was in the zone. The inside edge of this pitch was nearly two inches into the strike zone; it wouldn’t have been close to getting overturned.
In other words, you might get a few challenges – five pitches in the last five years within two inches, for example – but probably not that many overturns. Maybe zero overturns, in fact. Batters don’t get into this situation — bases loaded, 3-2 count, two outs, bottom of the ninth — very often in the first place. And I doubt they’re going to suddenly start taking more pitches either. When batters swing at close pitches in these situations, it’s not because they’re worried the ump will botch the call. Rather, it’s because they’re tracking a spinning projectile in flight, making a swing decision well before they see where it ends up, and trying to approximate a trajectory. They don’t even know exactly where the strike zone border is. I don’t think this behavior will change much at all. No one’s that good at knowing where a pitch will end up before they swing; even Juan Soto chases. I hope that we see at least a few, but I’m glad that they’ll happen pretty rarely.
__
The Angels are accumulating a large number of players who were good roughly a few years ago, mostly in 2023. Some are declining vets like Jorge Soler and Mike Trout. Some are young enough guys that only had one really good year, like Josh Lowe and Alek Manoah. Some probably had really good projections some spring but never launched, like Grayson Rodriguez and Vaughn Grissom and Oswald Peraza. Some blew out their arms, like Jordan Romano and Robert Stephenson. If you took the best preseason projections in the 2022-2024 period for each player you probably have a playoff team. Could you run the projections to see if my theory is true? — Jason
Dan Szymborski: Hi, Jason, I always appreciate an attempt to make the 2026 Angels seem like an interesting team. We elected to do this exercise for the current Angels roster with their projections entering the 2024 season. You’ll see why in a moment.
The time machine 2024 Angels, in a ZiPS simulation, continue to struggle in the current AL West, though they do improve. You get better projections from Mike Trout, Logan O’Hoppe, Jorge Soler, and Nolan Schanuel, but you also lose Zach Neto’s breakout. Alek Manoah gets a bit of a boost, but both Yusei Kikuchi and José Soriano lose some of their current projected value.
In the end, it’s enough to bump the Angels from what is currently a 69-win projection to a 73-win projection, and their playoff probability from 2.9% to 9.1%, but it’s a team that would still need an awful lot of things to go right.
However, since we’re already using a time machine to violate baseball’s rules, and possibly physical laws of the universe, how about we take the approach of “in for a penny, in for a pound” and also purloin Shohei Ohtani himself entering the 2024 campaign? After all, as Tom Verducci reported in a March 2024 Sports Illustrated cover story, that might’ve happened if Arte Moreno had been willing to match the offer Ohtani got from the Dodgers, deferrals and all.
Now, with Ohtani and the pre-2024 projections, the Angels project as an 81-win team with a 32% chance of making the playoffs in 2026. If that still feels a little disappointing, you have to remember that this is a team that could give a TED Talk about how not to build a good baseball team while employing both Trout and Ohtani, which is a little like losing the Tour de France despite being allowed to use a motorcycle.
__
As someone fascinated by baseball player birthdays, I loved Ben’s response last week about birthday and WAR. It reminded me that a few years ago, I noticed that then-Diamondback teammates David Peralta and Jeremy Hazelbaker were born on exactly the same day (8/14/1987). They, in fact, batted back-to-back one game. It got me to wondering if – besides twins like the O’Briens or Rogers – what other teammates born the same day ever played in the same game as teammates?
Enjoying all of the great work. — jds
Jon Becker: Fun question! Upon querying our game-by-game database, I was surprised to find that this has happened more often than I would have guessed. Teammates with the same birthday (including twins) have played in the same game 4,477 times, with 10 of the 187 distinct pairs doing so at least 100 times:
Same-birthday-teammate games occurred 84 times last year alone, mostly thanks to two pairs: Brandon Nimmo and Clay Holmes, and Matt McLain and Hunter Greene. Nimmo and Holmes are no longer teammates, of course, but McLain and Greene — who’ve shared the field for the Reds 24 times already — will keep moving up the list when Greene returns from his elbow injury around midseason.
George Lombard Jr. Photo: Nathan Ray Seebeck-Imagn Images
Below is an analysis of the prospects in the farm system of the New York Yankees. Scouting reports were compiled with information provided by industry sources as well as our own observations. This is the sixth year we’re delineating between two anticipated relief roles, the abbreviations for which you’ll see in the “position” column below: MIRP for multi-inning relief pitchers, and SIRP for single-inning relief pitchers. The ETAs listed generally correspond to the year a player has to be added to the 40-man roster to avoid being made eligible for the Rule 5 draft. Manual adjustments are made where they seem appropriate, but we use that as a rule of thumb.
A quick overview of what FV (Future Value) means can be found here. A much deeper overview can be found here.
All of the ranked prospects below also appear on The Board, a resource the site offers featuring sortable scouting information for every organization. It has more details (and updated TrackMan data from various sources) than this article and integrates every team’s list so readers can compare prospects across farm systems. It can be found here. Read the rest of this entry »
MIAMI — It was the most anticipated, cacophonous World Baseball Classic game of the week, a raucous rivalry featuring the national teams of two baseball-obsessed cultures playing in front of some of the loudest fanbases in professional sports. With air horns blaring, drums pounding, and more than 36,000 people shouting for the entirety of the game’s three-hour run time, the Dominican Republic outslugged and outlasted Venezuela, 7-5, on Wednesday night at loanDepot park.
All that for a game that didn’t matter much. Sure, the winner would finish first in Pool D and not have to face reigning WBC champion Japan in the quarterfinals, but South Korea is also a formidable foe. And yes, the winner would also have a better opportunity to secure one of the two spots in the 2028 Olympics reserved for non-United States teams from the Americas. But no matter the result of Wednesday night’s game, both teams would still have a chance to earn both the WBC title and an Olympic berth.
And yet, from another perspective, the game meant everything, because for the fans of these two countries, baseball means everything. Read the rest of this entry »
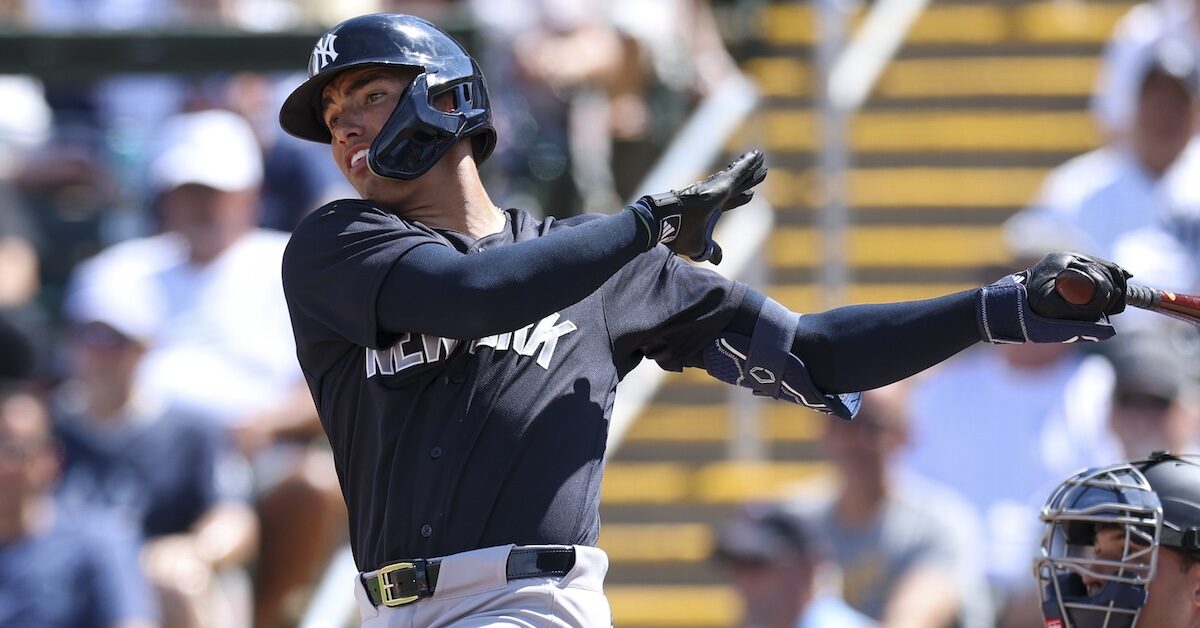
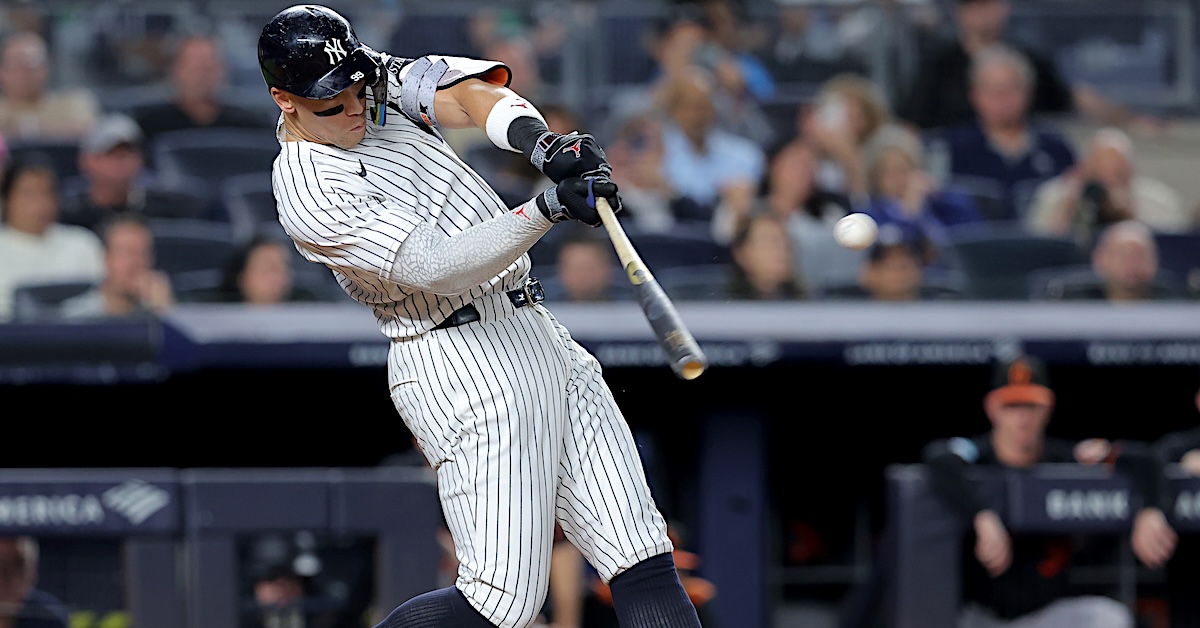
The baseball season will soon be upon us, which means it’s time for an age-old question: How long until the best hitter’s reign ends? This year, and seemingly every year of late, that means Aaron Judge. You can quibble about who the best overall player is, but Judge is pretty clearly the best offensive player on the planet. Over the last four years, he has a composite 204 wRC+, miles clear of the competition, and he just put up that exact number in 2025. In 2026, we think he’s going to be the best hitter again, obviously.
Will we in 2027, though? It depends, of course. If Judge looks like his usual self this year, it’s hard to imagine anyone taking the crown. I wanted a little bit more rigor than that, however, so I dusted off the Marcel projection methodology. Marcel is what Tom Tango dubbed the minimum sufficient projection system. It’s as simple as taking the last three years of performance, weighting them, and tossing in some league average.
Let’s take Judge’s last few seasons as an example. I grabbed his wOBA and plate appearances for 2023-2025 and threw them into a table. Then I calculated league average across those three years (the exact calculation uses some weighting to match Judge’s playing time by season). That looks like this:
Aaron Judge, Marcel Projections
Year
PA
wOBA
2025
679
.463
2024
704
.476
2023
458
.420
League Average
600
.313
Turning those into a Marcel projection is simple. Multiply the most recent year’s plate appearances by five, the next-most-recent year’s by four, the next by three, and the league average by two. Take a weighted average of these new values. The result is Judge’s 2026 Marcel projection – which works out to a .440 wOBA. That tracks logically, which is the point of Marcel. It’s really close to what you and I would think about a player’s skill. Post a wOBA above .450 for two straight years, and I’ll expect you to come back to the pack a little but still do something outrageous the next year.
Using this methodology, here are the top projected hitters for 2026:
Below is an analysis of the prospects in the farm system of the Atlanta Braves. Scouting reports were compiled with information provided by industry sources as well as my own observations. This is the sixth year we’re delineating between two anticipated relief roles, the abbreviations for which you’ll see in the “position” column below: MIRP for multi-inning relief pitchers, and SIRP for single-inning relief pitchers. The ETAs listed generally correspond to the year a player has to be added to the 40-man roster to avoid being made eligible for the Rule 5 draft. Manual adjustments are made where they seem appropriate, but we use that as a rule of thumb.
A quick overview of what FV (Future Value) means can be found here. A much deeper overview can be found here.
All of the ranked prospects below also appear on The Board, a resource the site offers featuring sortable scouting information for every organization. It has more details (and updated TrackMan data from various sources) than this article and integrates every team’s list so readers can compare prospects across farm systems. It can be found here. Read the rest of this entry »
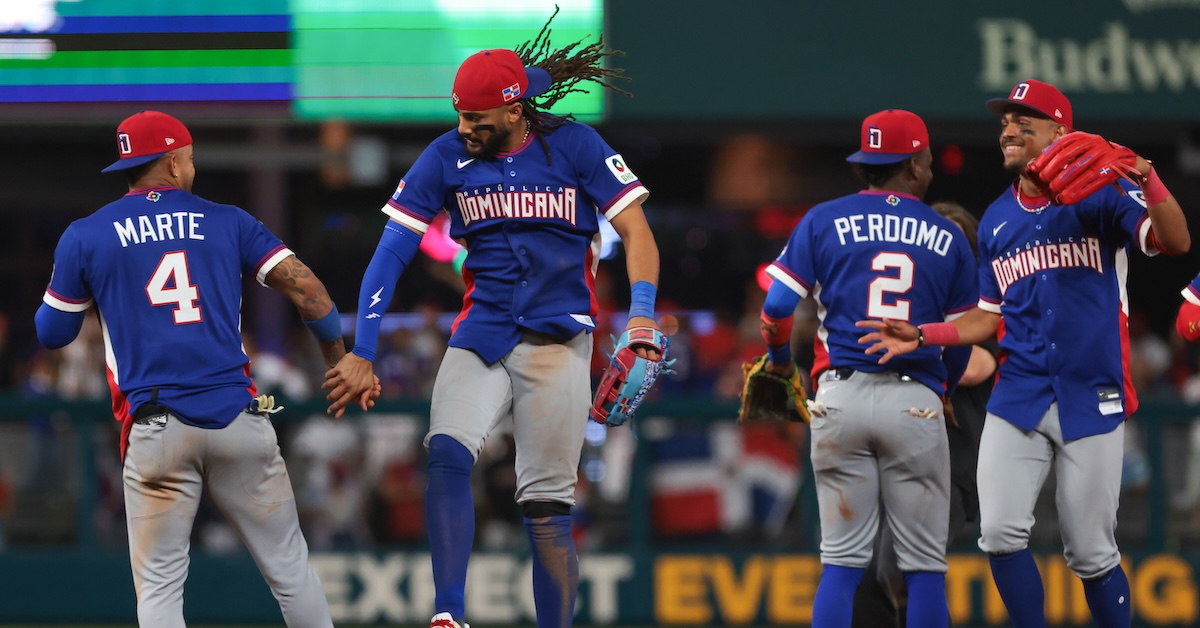
MIAMI — Through the first two games of the World Baseball Classic, the Dominican Republic had scored 24 runs, recorded 22 hits, and drawn 18 walks. Fifteen of those 24 runs had come on the team’s seven home runs. Collectively, the Dominican hitters were slashing .361/.506/.754; their 1.260 OPS was two points better than Babe Ruth’s was in 1927. They couldn’t possibly keep this up.
They cooled off some in Monday afternoon’s 10-1 win over Israel, lowering that slash line to a pedestrian .319/.488/.692. Those slackers.
Obviously, these numbers are staggering. Across three games, the Dominican squad has scored 34 runs and tallied 29 hits, nine home runs, and 29 walks; they’ve struck out just 13 times. Their OPS is now 1.180, slightly better than Ruth’s career mark of 1.164.
Charles LeClaire and Mark Hoffman/Milwaukee Journal Sentinel-USA Today Network via Imagn Images
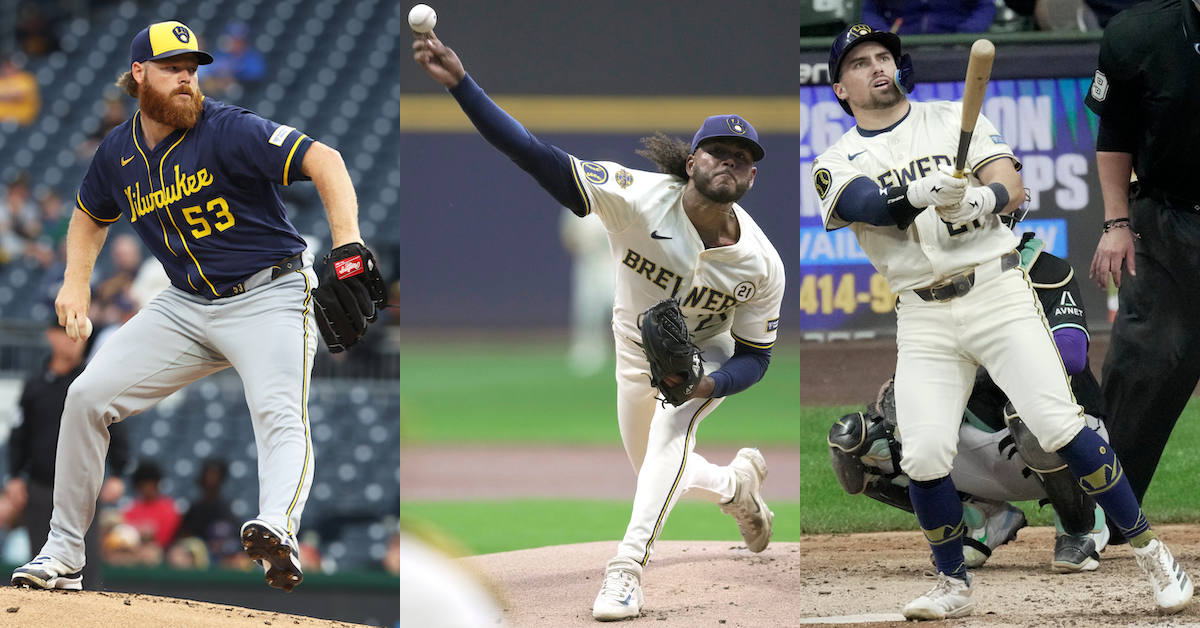
This offseason, I’ve taken high-level looks at the offseason decisions made by the New York Mets and the Boston Red Sox. It’s been a popular series, so today, I’m going to use the same framework to offer a holistic evaluation of the Brewers. As a refresher, here’s how I’ve been thinking about the exercise:
“How should we evaluate a front office, particularly in the offseason when we don’t have games to look at? I’ve never been able to arrive at a single framework. That’s only logical. If there were one simple tool we could use to evaluate the sport, baseball wouldn’t be as interesting to us as it is. The metrics we use to evaluate teams, and even players, are mere abstractions. The goal of baseball – winning games, or winning the World Series in a broad sense – can be achieved in a ton of different ways. We measure a select few of those in most of our attempts at estimating value, or at figuring out who “won” or “lost” a given transaction. So today, I thought I’d try something a little bit different.”
I won’t be offering a single grade. Instead, I’m going to assess the decisions that Matt Arnold and the Brewers made across three axes. The first is Coherence of Strategy. If you make a win-now trade, but then head into the season with a gaping hole on your roster, that’s not a coherent approach. It’s never quite that simple in the real world, but good teams make sets of decisions that work toward the same overarching goal. Read the rest of this entry »
If there’s something even more satisfying than spending your hard-earned money, it’s spending someone else’s money that you didn’t earn. When we’re talking baseball, unless you’re an extremely high-net-worth individual who can casually spend hundreds of millions of dollars — if this describes you, call me and we can totally hang out or something — you only have the option to spend other people’s cash. I mean, I haven’t technically asked American Express to up my credit limit to $300 million, but I’m guessing the answer would be no. Every year around this time, I make a whole piece out of it, naming seven players I think teams should attempt to sign to long-term contracts now, rather than waiting until later. There are some additional complications, of course, with a lockout likely coming after this season, but teams and players could be willing to act with more urgency to sign contracts now before all the uncertainty ahead of them.
I’ve (hopefully) chosen seven players whose possible extensions would benefit both the player and the team, as all good contracts ought to do. I’ve included the up-to-date ZiPS projections for each player, as well as the contract that ZiPS thinks each player should get, though that doesn’t necessarily mean I think the player will end up with that figure or even sign an extension. Read the rest of this entry »
Collin Snider is with Chicago looking to recapture what he had two seasons ago with Seattle. Currently in camp with the Cubs, the 30-year-old right-hander was a pleasant surprise for the Mariners in 2024, logging a 1.94 with a 27.8% strikeout rate over 42 relief outings comprising 41-and-two-thirds innings. Last year was a different story. Hampered by a flexor strain and unable to get back on track, Snider struggled to the tune of a 5.47 ERA across 24 appearances in the majors, then posted an even uglier 8.06 ERA across 25 games with Triple-A Tacoma. Cut loose by Seattle in November, he subsequently inked a deal with the Cubs in December.
Despite the dismal results, Snider wasn’t without suitors. He had options — every team can use more pitching — and in the case of the Cubs, he also had connections. Tyler Zombro, the NL Central club’s Vice President of Pitching Strategy, previously worked at Tread Athletics, where Snider trained in previous offseasons. As the erstwhile Vanderbilt Commodore put it, “That really steered my decision. I like the way the pitching development is here.”
Asked about his poor 2025 performance, Snider pointed to how his injury contributed to bad mechanical habits that resulted in a drop in velocity, as well as “pitch shapes that weren’t the same.” He knew what was happening, but correcting it was another matter.
“I was very rotational, throwing too side-to-side, whereas I need to be north-south,” Snider said. “Side-to-side made the velo go down, because I couldn’t get behind the baseball. I was aware of what was going on, but I didn’t know why I was doing it, or how to make the adjustment quickly. It ended up being one of those things where I needed the offseason to straighten it out.”
Snider averaged 92.5 mph with his four-seamer last season, whereas in the prior two years that number was 94.2 and 95.3. His sweeper was also impacted by his delivery being out of sync. Read the rest of this entry »