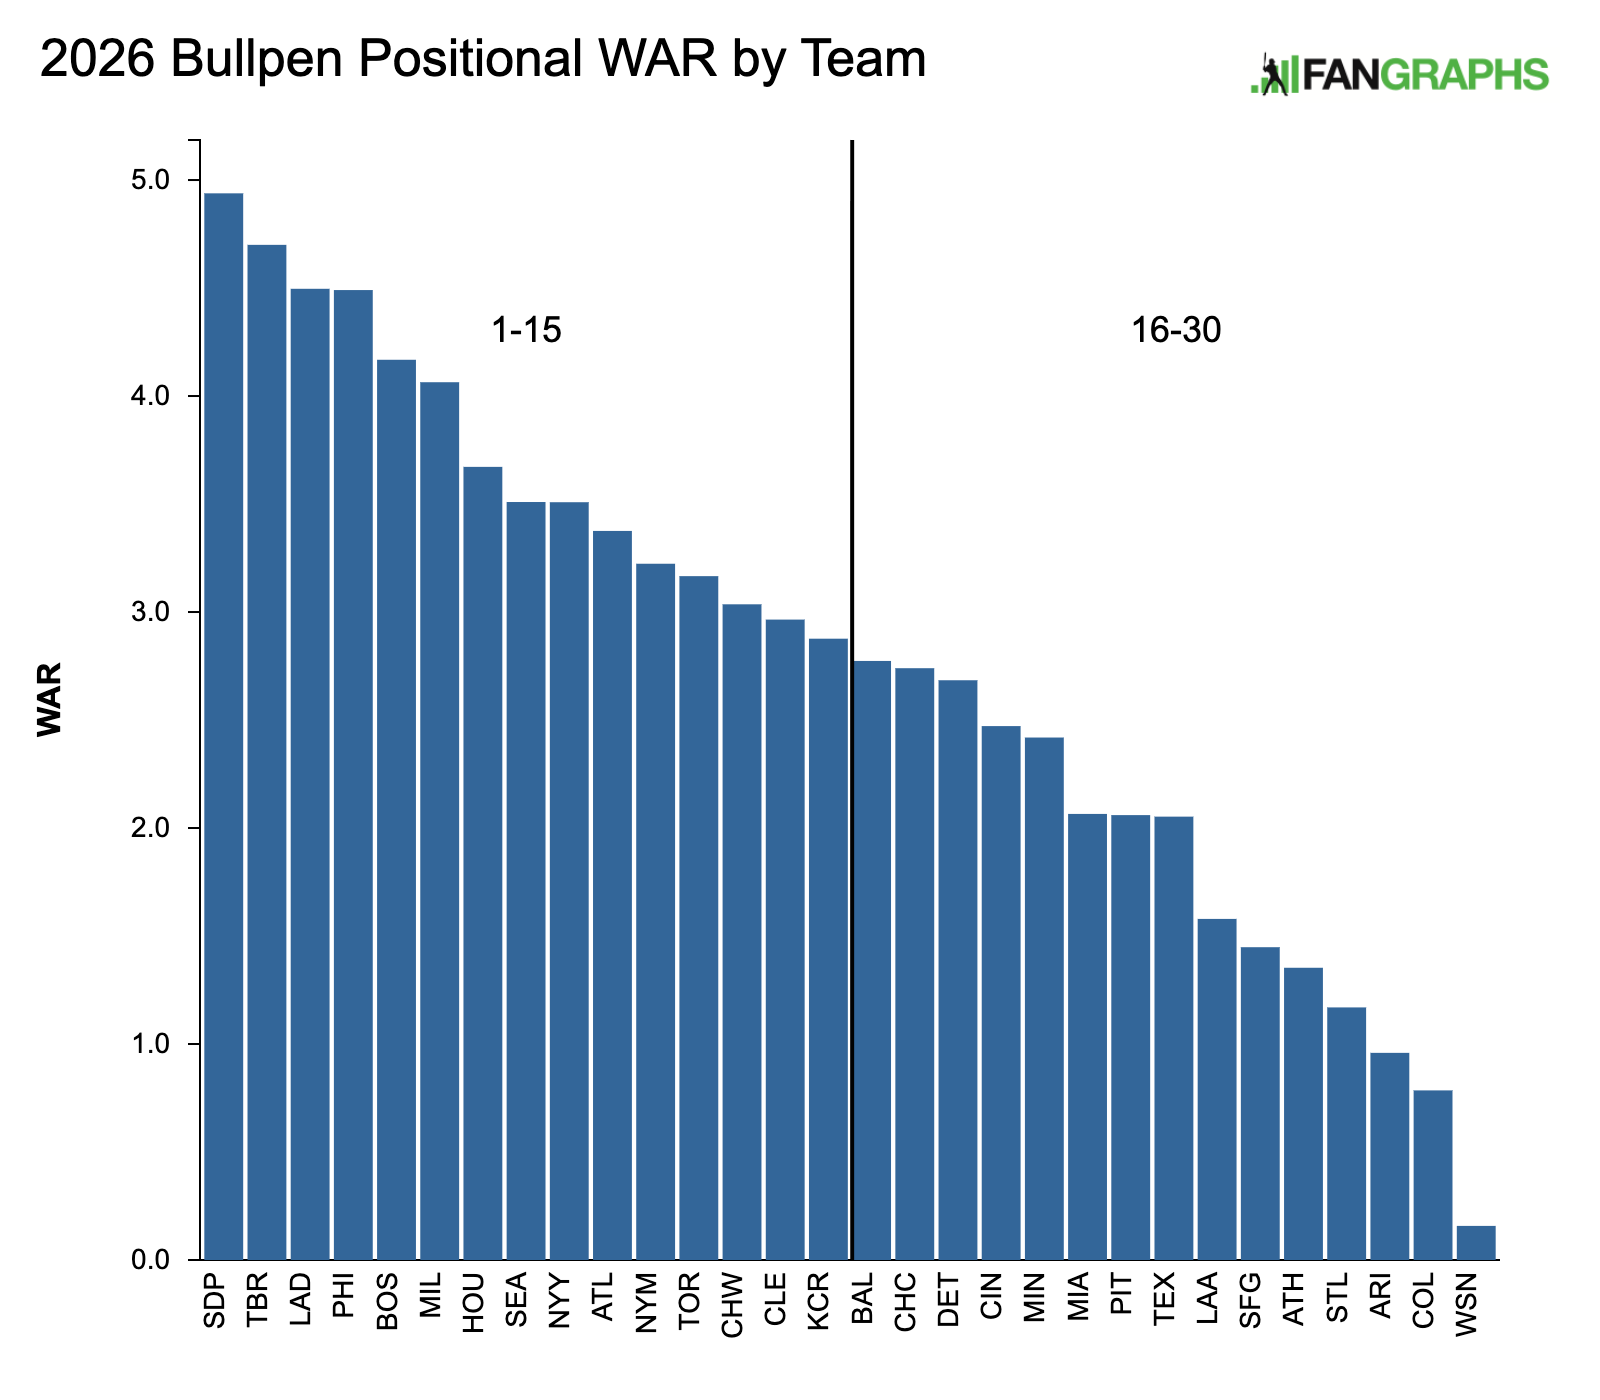
There are some positions for which a cleaner, wider gap exists between the top teams and the bottom, where we can more definitively say that some teams are better than others. For instance, the talent that the Dodgers and Astros have at DH separates their projections from the rest of baseball in a meaningful way. Relief pitching is not one of these positions. As you digest the forecasts and player details below, make sure to note how thin the margins tend to be from one team to the next. Also know that relief inning sample sizes are small enough that this is where WAR is the least good at properly calibrating impact and value, a dynamic heightened in the playoffs when the remaining bullpens are all turbocharged by the way the postseason schedule allows for rest, or for an elite starter to work an inning on his bullpen day. Things like coherent managerial usage, roster management, and good or bad health luck tend to play a huge role in the way bullpens perform throughout a season, and those are factors we can’t totally control for here. I felt free to point out the situations in which I think the projection is off base. Read the rest of this entry »
I love relievers. Sure, starters are the belles of the ball, making the big bucks and responsibly scaling back their velocity and throwing six pitches. They’ve got it all together. Not relievers. Relievers are freaky. They’ll throw it crazy-style. They’ll spam a million breaking balls. They’ll have 20-grade command, or an 85-mph fastball, or a pitch you’ve never seen in your entire life. They will burn bright and fast, and then you’ll never see them again.
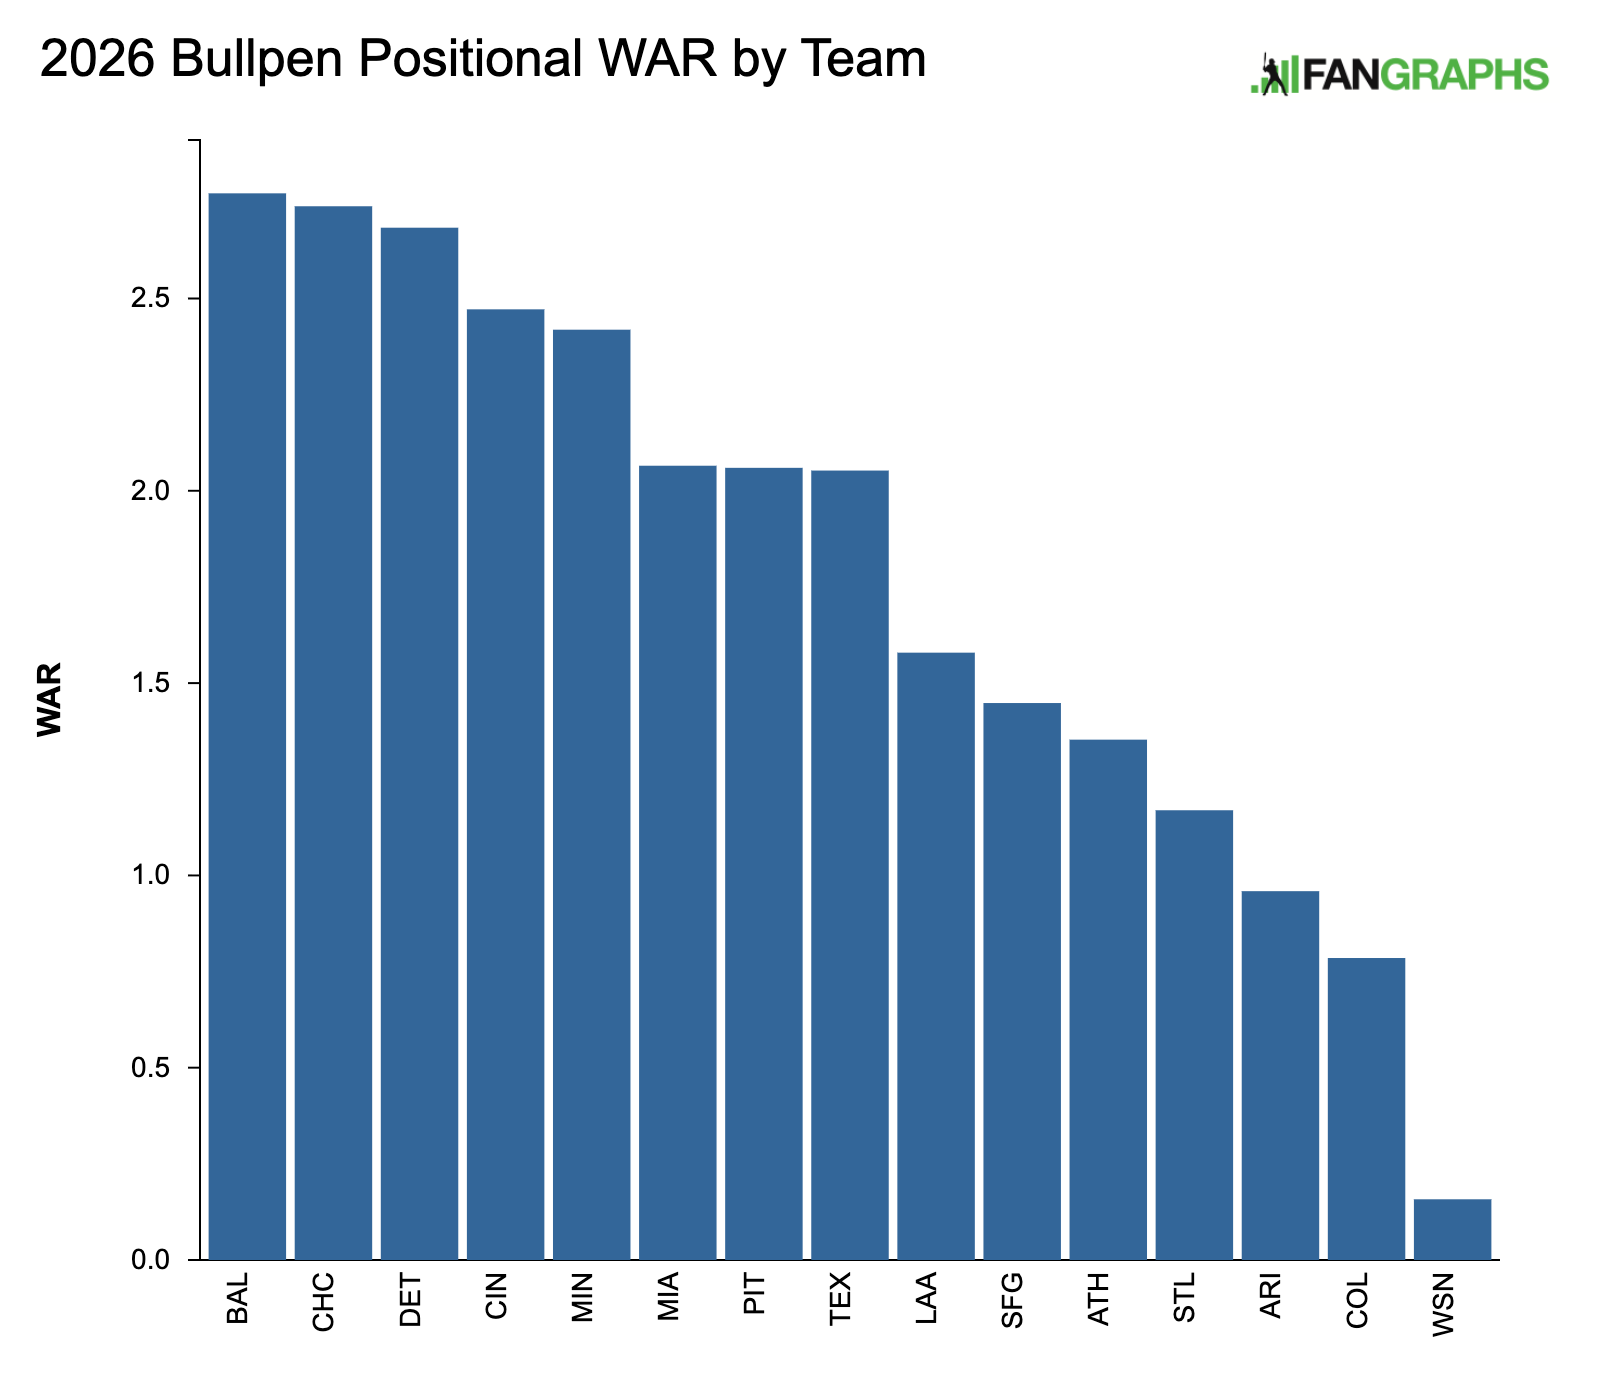
These are not the best bullpens in baseball. In fact, they are the worst. But every single one has something fascinating going on inside of it. Usually, it’s more than one something. So come along with me on a journey into the deep, dark wilderness of baseball’s mediocre bullpens. This one is for the sickos. Read the rest of this entry »
During the championship game of the World Baseball Classic, a Nolan McLean sweeper made me jump off of my couch. It wasn’t even a strike; it just moved so much from such an innocuous starting point that I reacted instinctively. I clearly wasn’t alone; Davy Andrews wrote about how nasty McLean’s pitches look last week. “Dang,” I thought to myself after I’d calmed down. “It’s too bad someone hasn’t gotten PitchingBot to take a look at that one.”
Then I thought about that slightly longer and chuckled. That someone is me. PitchingBot lives in the cloud, but I have a duplicate copy isolated in a sandbox on my computer. MLB records Statcast data for WBC games. I have a machine that ingests Statcast data and turns it into pitch modeling grades. This wasn’t rocket science (give or take how you feel about the machine learning algorithms powering the model) – I took the data, fed it into the machine, and tinkered with the exact settings until I got model grades to come out.
The tournament features a wide variety of skill levels, from Paul Skenes down to semipros and high schoolers. Setting the population average equal to the average quality of WBC pitching would mean that the grades aren’t comparable to the ones we’re all used to looking at. Thus, I ran the PitchingBot model for every pitch in the WBC, but instead of using the WBC average to mean a 50 grade, I used the 2025 MLB average. That means the model is calibrated to how you’d expect the pitches thrown in the WBC to perform against average major league opposition. Read the rest of this entry »
Trey Yesavage profiles as a strong Rookie of the Year candidate, but he won’t have a chance to begin building his case in the near term. The 22-year-old Toronto Blue Jays right-hander landed on the injured list due to shoulder impingement and won’t be ready when the season gets underway later this week. His return is expected to come sooner rather than later — fingers are crossed throughout Canada — but for now, Yesavage is on the shelf.
Five months ago he was turning heads in the World Series. With just six MLB outings under his belt — three in the regular season, and three across the ALDS and ALCS — Yesavage bedeviled LA batters with an array of high-riding heaters and diving splitters. He was especially dominant in Game 5, fanning a dozen Dodgers while allowing three baserunners and a lone run over seven frames.
His meteoric rise and eye-popping postseason performances raised his public persona, but the Pottstown, Pennsylvania native hasn’t otherwise changed since being drafted 22nd overall in 2024 out of East Carolina University. He’s still polite and unassuming, and his overpowering arsenal has remained in place.
“I’m pretty much the same dude,” Yesavage told me at Blue Jays camp last week. “The pitches are the same. The velocity and movement are the same. I also don’t look at [the metrics] all that much. Whenever Trackman is up on the board, all I really look at is the vert on my heater, and the velo. The only questions I’ll ask my pitching coach are to make sure that my most-used pitch is in line.”
That would be his four-seam fastball, which averaged 94.7 mph and 19.5 inches of induced vertical break across his smattering of regular season outings. Thrown at a 45.2% clip, the offering was augmenting by a slider (28.4%) and a splitter (26.4%), the last of those offerings being the righty’s most lethal weapon. A quintessential complement to his well-elevated heaters, Yesavage’s splitter induced a 57.1% whiff rate and a .111 BAA against big-league hitters.
He began tinkering with his signature pitch in the middle of his three collegiate seasons, but it wasn’t until his draft year that the efforts bore fruit. Read the rest of this entry »
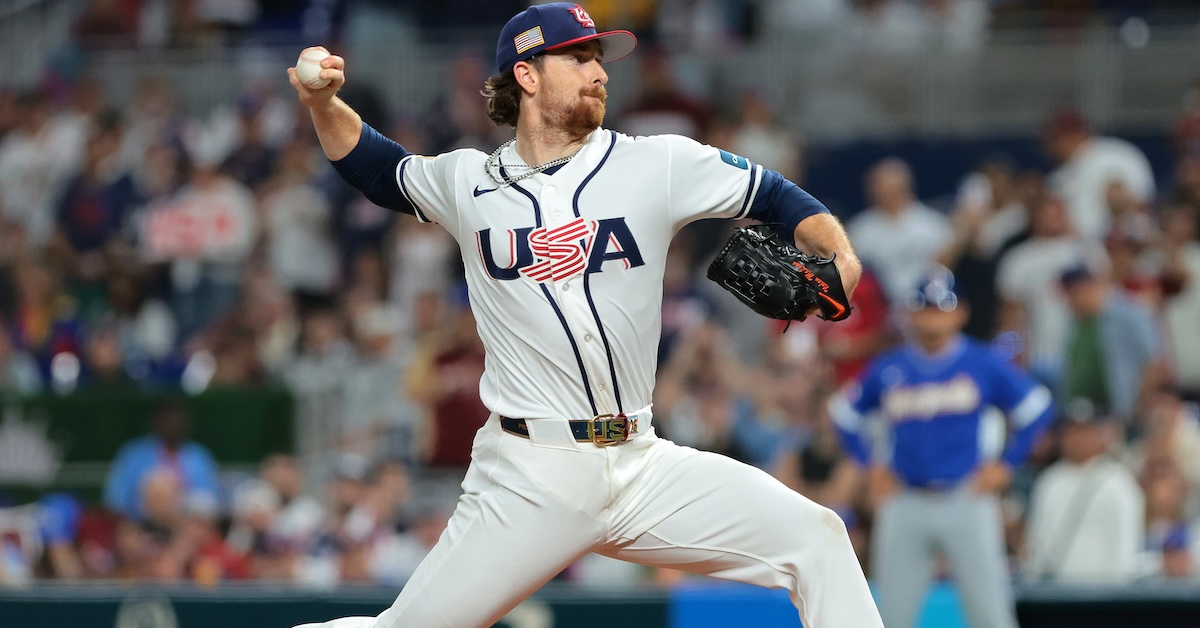
It’s a great time to be a baseball fan. We just finished watching an exhilarating World Baseball Classic, which ended in a thrilling 3-2 Venezuela win over the United States, and we’re less than a week away from Opening Day. Part of the fun in the days leading up the start of the season is playing catchup with all the transactions that went down over the previous months. Sure, we all know that Kyle Tucker is a Dodger and Alex Bregman is a Cub, that Cody Bellinger returned to the Yankees and Pete Alonso joined the Orioles. We also don’t need to be told that Marcus Semien, Bo Bichette, and Luis Robert Jr. now play for the Mets, or that both Sonny Gray and Ranger Suarez slot in behind Garrett Crochet in the Red Sox rotation. But it can be hard to have a handle on how all these moves shape the outlook of teams across the league as we begin the season. The good news is that we at FanGraphs have been keeping tabs on everything throughout the offseason and spring training, so we’ve got you covered with everything you need to know about the coming year in baseball.
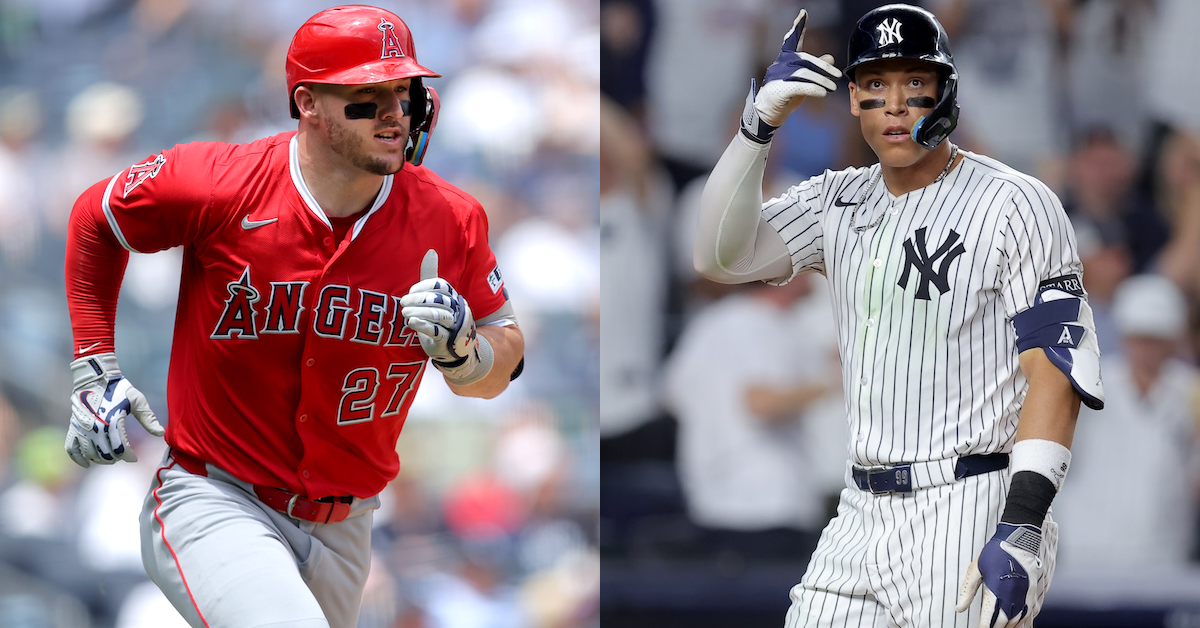
We won’t be talking about any of those topics in this week’s mailbag. Instead, we’ll answer your questions about whether Aaron Judge might finish with more career WAR than Mike Trout, where Juan Gonzalez’s 1996 season ranks among undeserving MVP wins, and which national soccer team would be the best at baseball. But first, I’d like to remind you that this mailbag is exclusive to FanGraphs Members. If you aren’t yet a Member and would like to keep reading, you can sign up for a Membership here. It’s the best way to both experience the site and support our staff, and it comes with a bunch of other great benefits. Also, if you’d like to ask a question for an upcoming mailbag, send me an email at mailbag@fangraphs.com. Read the rest of this entry »
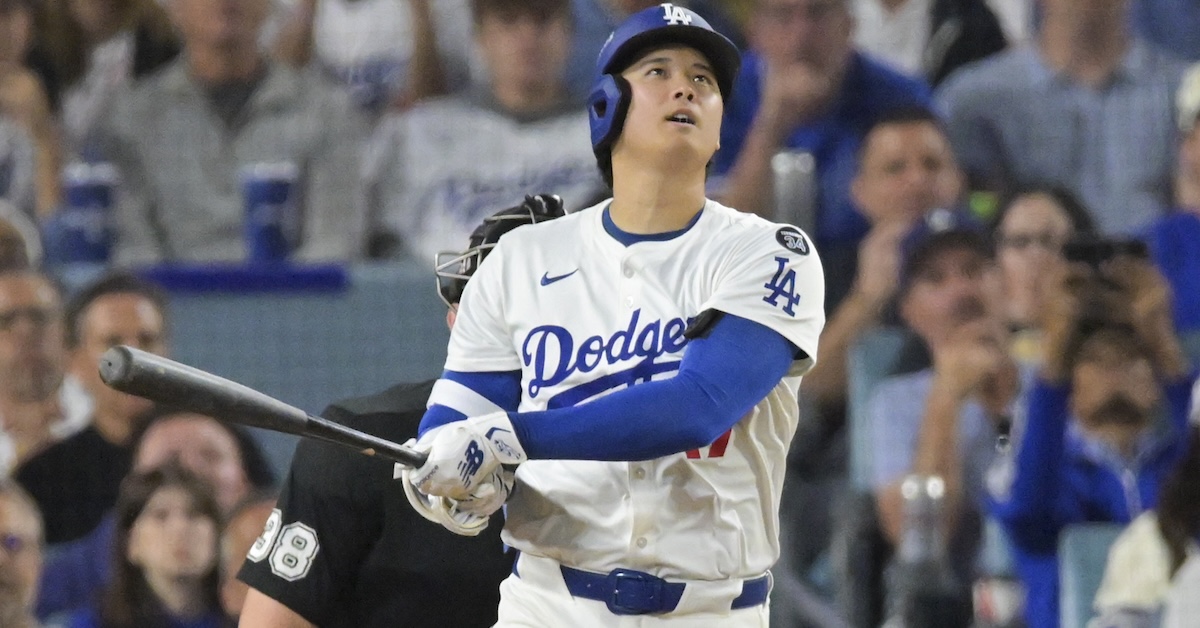
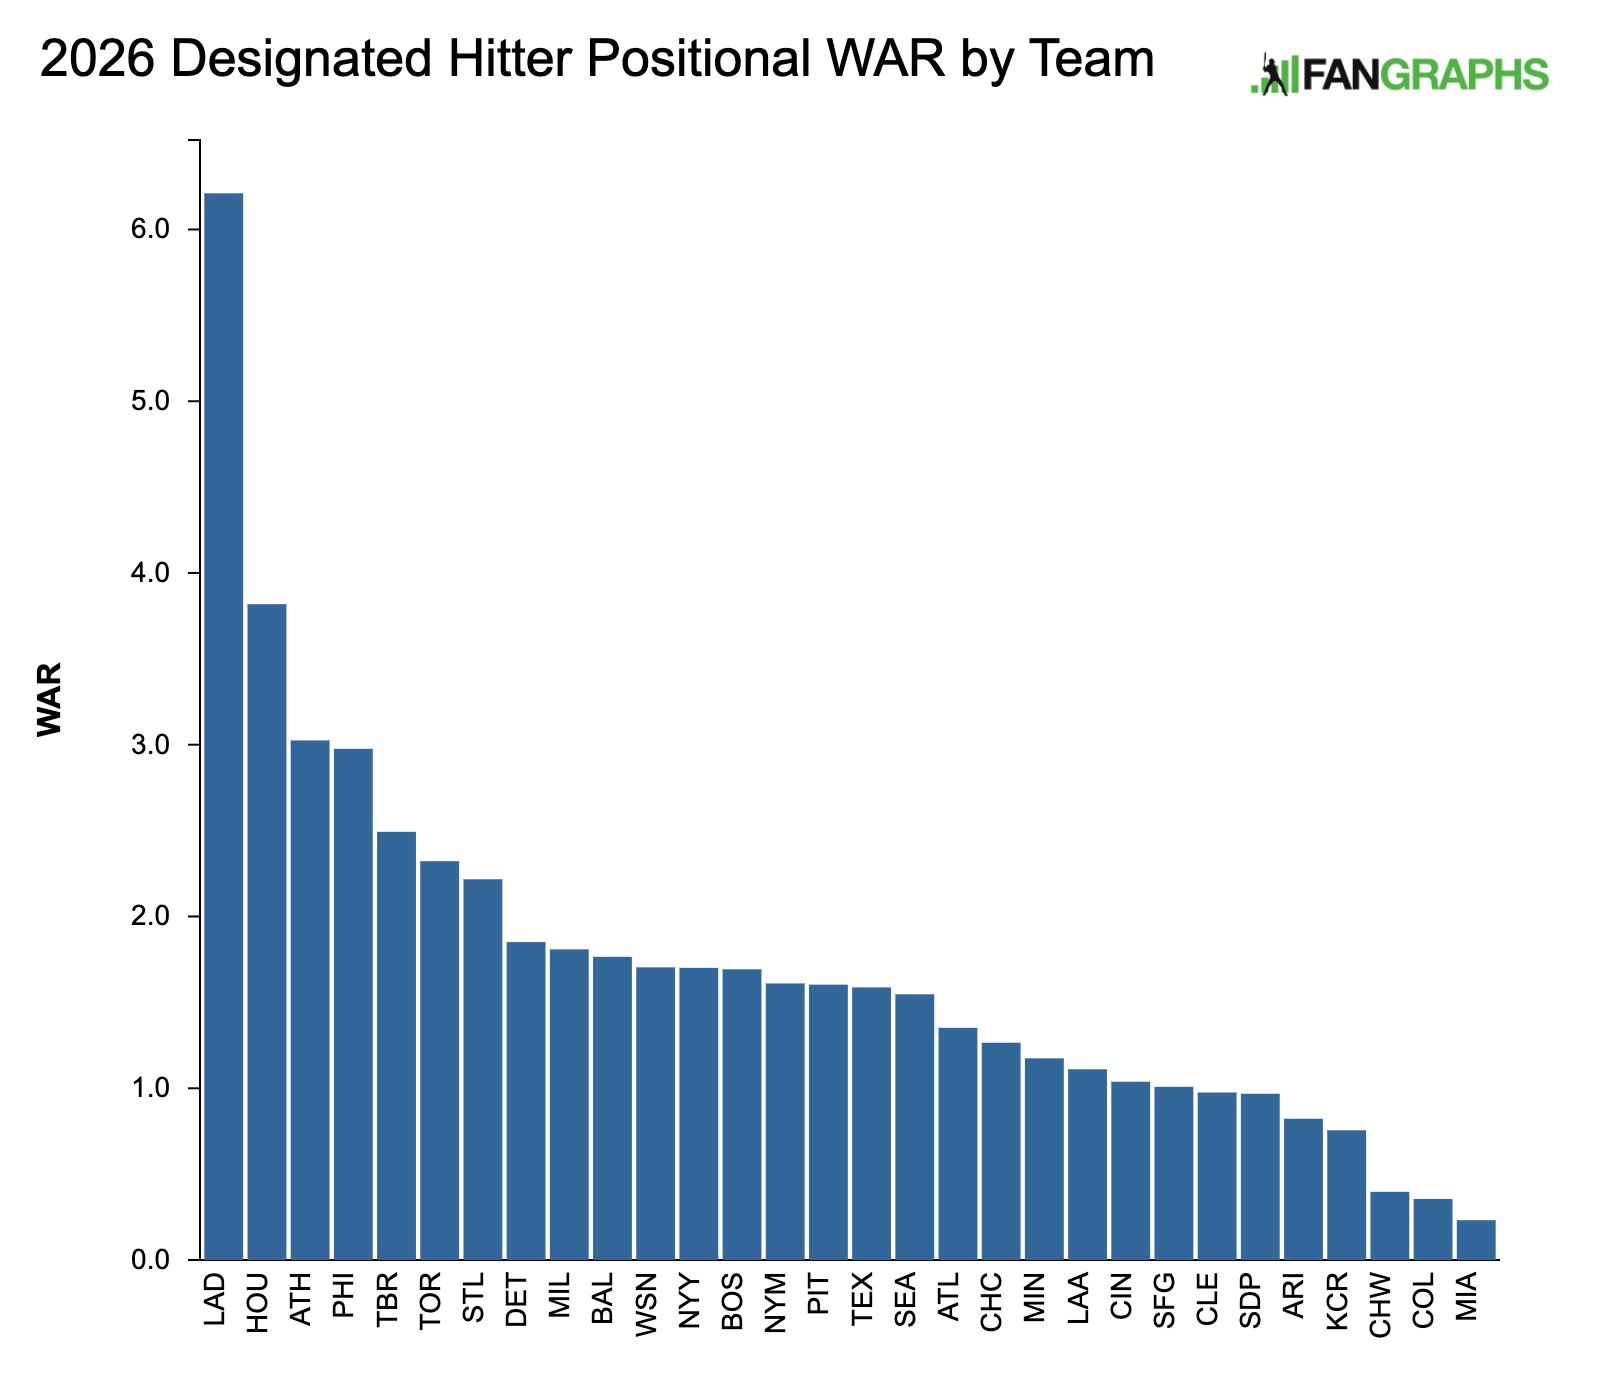
Sometimes, we fail to appreciate the vastness of the mysterious forces behind projections systems. The data speak to each other and sometimes combine in unexpected ways to form unexpected outcomes. Regarding the question of how to rank each team’s designated hitters, what you see here is based not only on projections about player performances but well-informed speculation about how each team will line up. Put it all into the kettle and, well, shock of shocks, there’s an unexpected upset at no. 1 on this list.
Actually, no, it’s Shohei Ohtani and the Dodgers again, by more than two wins. I don’t even know why I bothered setting up that gag, no one believed me, even for a second. Read the rest of this entry »
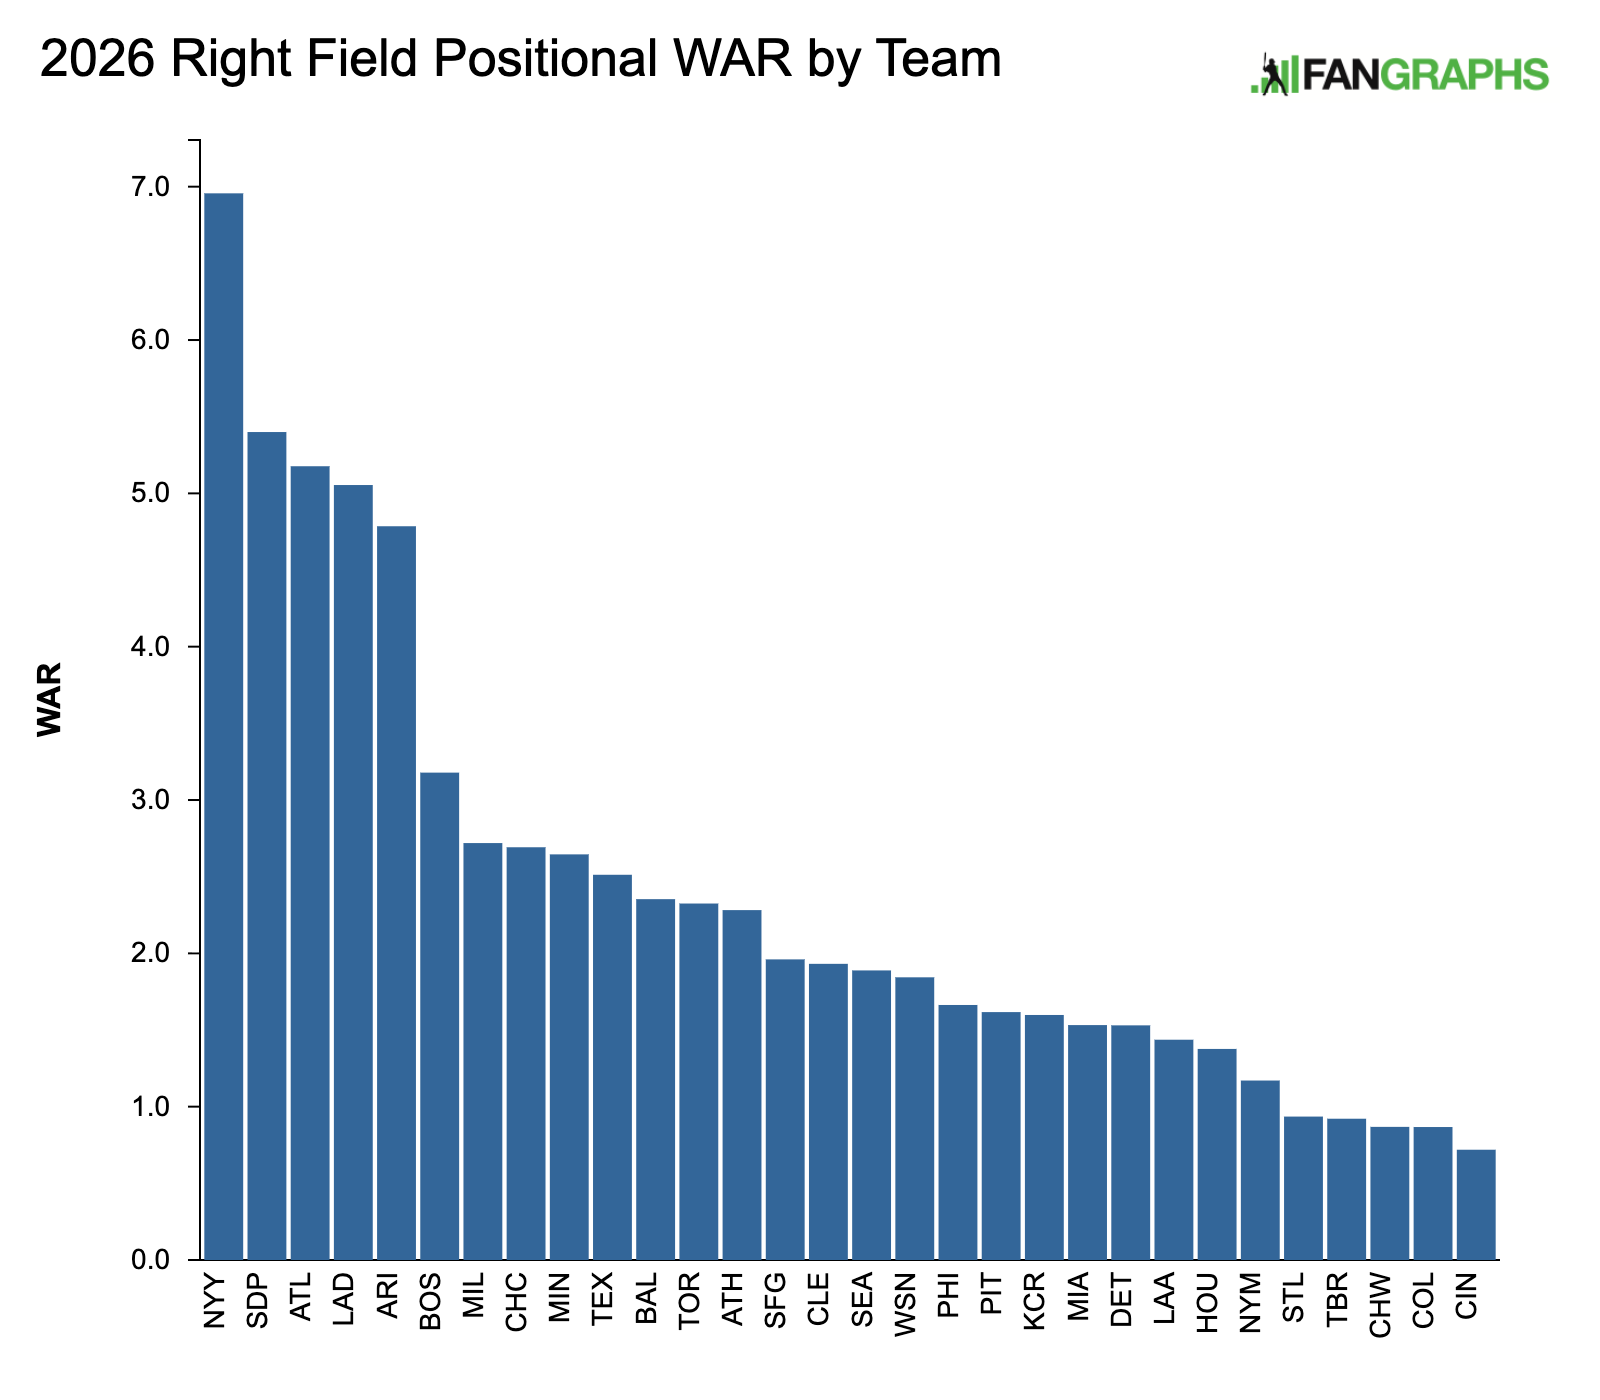
As with the league’s first basemen, right fielders as a group are at a comparatively low ebb when it comes to their offensive production. And likewise, the 2026 projection for one right fielder dwarfs the rest of the field, not that there isn’t a small handful of others who are pretty damn good.
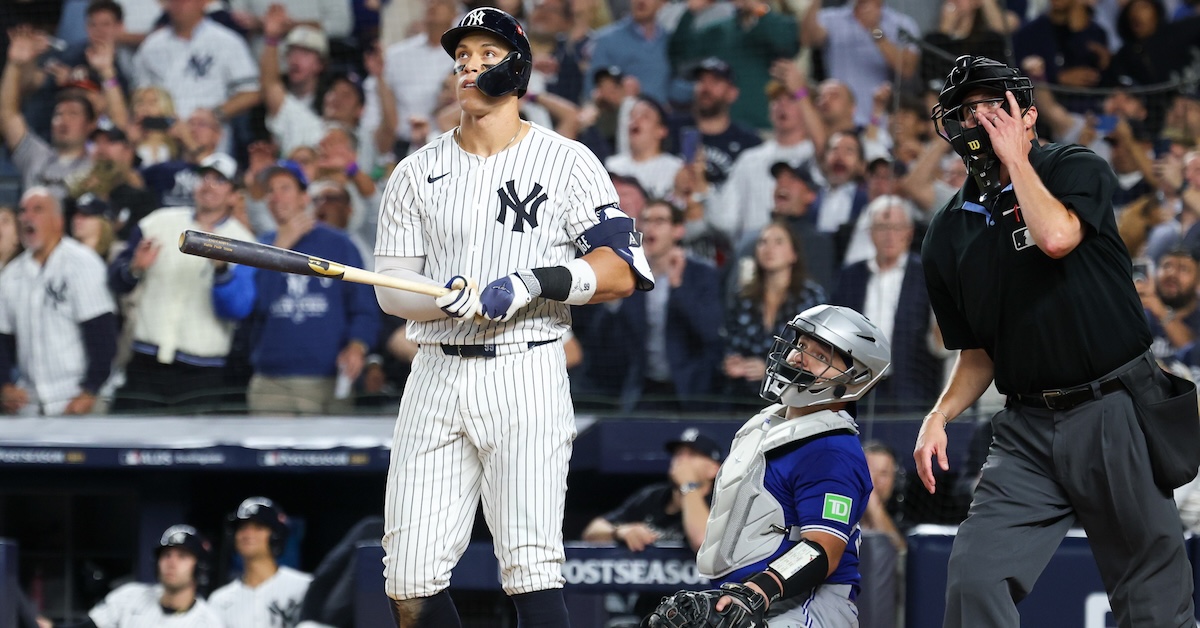
In this case, it should surprise no one that the towering presence at the position is Aaron Judge, winner of three of the past four American League MVP awards and author of three of the 12 10-WAR seasons of this millennium’s position players. Based on our Steamer/ZiPS blend, he has the highest overall projection of any position player in the game at 7.3 WAR, and even once you account for some of that value coming during his time as the Yankees’ designated hitter, he and his assorted fill-ins have a 1.6-WAR lead over the rest of the field. Of course, it helps that his former Yankees teammate Juan Soto has moved from right field (where he played while in the Bronx) to left, where he and his Mets backups have a 2.4-WAR advantage.
Fresh off his turn as the blander-than-Ned-Flanders captain of the World Baseball Classic’s runner-ups, Judge may not be the game’s most charismatic player, and likewise for the fourth-ranked Kyle Tucker, he of the record-setting annual salary. Still, the upper tier of the right field rankings also has the likes of Fernando Tatis Jr., Ronald Acuña Jr. and WBC Team Venezuela heroWilyer Abreu in all their bat-flipping glory. Baseball greatness comes in all shapes and sizes, and so Corbin Carroll and a muscled-up Sal Frelick stand tall, too.
What’s more, Abreu, Carroll, Frelick, and Tatis are just a handful of the regular right fielders who are entering their age-27 seasons or are even younger. In fact, nearly two-thirds of those forecast to get the most playing time for their teams at the position fit that description, including half a dozen from our 2025 or 2026 Top 100 Prospects lists (Dylan Beavers, Carson Benge, Owen Caissie, Jac Caglianone, Dylan Crews, and Chase DeLauter), with a handful of others (including Acuña and Tucker) who are still in their 20s. Those current or recent prospects might endure growing pains, but youth and the potential for further development offers some hope that this group as a whole can improve upon last year’s collective 105 wRC+, tied for the third-lowest mark since 2002, as far as our strict positional splits go back.
With three seasons out of his last four featuring a wRC+ of 204 or higher — that is, that is, three of the 13 such full-length seasons since integration — it’s hardly hyperbole to call Judge the best hitter on the planet, and the best since Barry Bonds. Depending on your stand regarding playing time cutoffs and mid-career measures, it’s reasonable to call the going-on-34-year-old the best right-handed hitter in AL/NL history. Call him future a future Hall of Famer, too: While winning his third MVP award, he rocketed from 18th to 11th in JAWS, blowing past the right field standard, and with the fourth-highest seven-year peak. Another 50-homer, 200-wRC+, 10-WAR season with an MVP award and a slash-stat Triple Crown (he won one last year with a .331/.457/.688 line) is unlikely, but this guy breaks the scale. Even while hitting it slightly less hard than he did in any of the previous three years, he still produced an xSLG of .708.
Judge was also above average (5 FRV, 3 DRS) while seeing the most right field action he has since 2021. So long as his right elbowhis right elbow and Giancarlo Stanton are healthy, Judge likely won’t match last year’s 56 games at DH, though his half-days off should allow Bellinger to play his best position according to the admittedly limited metrics, including last year’s 8 DRS and 4 FRV in 416 innings. Grichuk, an NRI, is a lefty-masher who still holds his own at the corners. Scenarios that would send Rosario or anyone else to right field reflect the possibility of a roster stretched thin by injury.
Tatis put together his best season since a fractured wrist and a PED suspension wiped out his 2022 campaign. He stayed healthy, set a career high with 155 games, and hit .268/.368/.446 with 25 homers while ranking 12th in the National League in wRC+ (131) and sixth in both steals (32) and WAR (6.1). Under the hood, a few developments do bear watching as he heads into his age-27 season. He was more disciplined than ever, with career lows in his swing and chase rates (45.4% and 23%, respectively) — both about five points below his 2024 marks — leading to career-best walk and strikeout rates (12.9% and 18.7%, respectively), and a 98th-percentile SEAGER score, which measures the quality of his swing decisions. Oddly, he did that even while setting a career high with a 48.9% groundball rate, and career lows in pull rate (36.2%), pulled air rate (12%), and xSLG (.488). Uncharacteristically, he struggled mightily with offspeed stuff, hitting .138, slugging .195, and whiffing on 44.7% of his swings. Defensively, he brought home his second Gold and Platinum Gloves while leading all right fielders with 9 FRV and tying for second with 15 DRS.
On the other side of the coin, Castellanos was the majors’ worst outfielder during his four-year run with the Phillies (-41 DRS, -45 FRV), and last year hit for a career-worst 90 wRC+ (.250/.294/.400). Laureano, slated to be the team’s regular left fielder, hit for a career-best 138 wRC+ (.281/.342/.512) with 24 homers and 3.0 WAR in a season split between Baltimore and San Diego. He’s actually got more experience in right field than left, with a strong arm offsetting his limited range.
In 2022, Acuña returned just over nine months after surgery to repair his torn right ACL but battled lingering soreness in his knee and produced a modest 115 wRC+ with 2.4 WAR in 119 games. In the wake of his torn left ACL, the Braves had him wait nearly a year after surgery before suiting up again. The additional rehab paid off; he returned on May 23 and hit .290/.417/.518 (161 wRC+) with 21 homers and 3.5 WAR in 95 games. He absolutely scalded the ball, with his average exit velocity, barrel and hard-hit rates, and xSLG all placing in the 92nd to 95th percentiles. He only stole nine bases in 10 attempts, representing a very cautious approach, but his 64th-percentile sprint speed was still on par with his 2023 mark, when he swiped 73 bags. He’s reportedly raring to resume running amok after stealing 11 bases in 16 games in the Venezuelan Winter League. A bigger question is whether he can regain his range in right; he set career worsts in both DRS (-12) and FRV (-8) last year, though his arm remained above-average.
Slated to platoon in left field, the lefty-swinging Yastrzemski and righty-swinging White are both adept in right. Far more experienced in this corner, Yastrzemski was very good defensively (7 DRS, 3 FRV) while hitting .233/.333/.403 (106 wRC+) for the Giants and Royals. White hit for just an 84 wRC+ but was league-average in 96 plate appearances against lefties. Gamel, a lefty-swinging NRI, didn’t play in the majors last year, but his glove gives him an advantage over Dominic Smith in the battle for the roster spot vacated by the suspendedJurickson Profar.
Coming off an uneven one-year stop with the Cubs, the 29-year-old Tucker signed a four-year, $240-million deal, setting a record for average annual value ($57.1 million after deferrals). That doesn’t mean he’s better than Aaron Judge, Juan Soto, or Shohei Ohtani, just that the Dodgers aren’t on the hook for his decline phase. In Chicago, he hit for a 157 wRC+ with 17 homers through the end of June, then slipped into a protracted slump that included a 39-game stretch with one homer; playing through a hairline fracture in his right finger was a factor, contributing to some changes in his swing mechanics that he appeared to iron out before a left calf strain cost him most of September. Set aside the distorted expectations produced by his injury-shortened 2024, when he had 4.2 WAR a 179 wRC+ in 78 games; his final .266/.377/.464 line (136 wRC+) and 4.5 WAR in 2025 were on par with his 2020–23 production, and if he can stay healthy, the projections suggest he could improve upon that.
Pages, the starting center fielder, is coming off a breakout 2025 season during which he was often shifted to right field in the late innings to replace Teoscar Hernández. He or Call, a righty-swinging reserve who played more right field than left for the Nationals before being traded at the deadline, could fill in when Tucker needs a break.
Building on the correction of some mechanical issues that depressed his numbers in 2024, Carroll soared to new heights, batting .259/.343/.541 (139 wRC+), joining the 30-30 club with 31 homers and 32 steals, and placing fourth in the NL with a career-high 6.5 WAR. Amid his 2024 struggles, he noticed his swing had flattened out, causing too many popups; Statcast data shows he restored his average swing tilt to match his 26 degrees from late 2023 — it had dipped to 22 degrees — and that by increasing his average attack angle from six degrees to 11, he had the highest rate of ideal contact (68.4%) in the majors. Carroll gained 2.8 mph of average exit velocity, his barrel rate more than doubled (from 7.2% to 14.5%), and his hard-hit rate jumped from 40.8% to 49.9%; his .529 xSLG represented a 126-point gain from 2024 and an 84-point gain from 2023. All of this came with a more aggressive approach, with his chase and swing rates increasing by about seven and eight points, respectively. It was an impressive set of adjustments, and to think, he’s still just 25 years old.
Carroll is already back to DHing after fracturing his right hamate on February 11 and undergoing surgery a day later, so he should be fine for Opening Day. Among his understudies, Thomas is a lefty who will spend most of his time backing up left and center, while Smith will serve as the long half of a DH platoon. Barrosa is a 25-year-old switch-hitter who’s listed at just 5-foot-6; he put up ugly numbers last year (.141/.169/.225 in 77 plate appearances) and is out of options, but his contact skills and above-average speed could keep him around.
Abreu put together a solid season while platooning with the since-departed Rob Refsnyder, though he was the subject of trade rumors given Boston’s crowded outfield, and missed 47 games due to oblique and calf strains; he made just six starts after August 17. When he was available, he hit .247/.317/.469 (110 wRC+) while improving from 15 homers to 22 and cutting his strikeout rate from 28% to 24.2%. Notably, where he hit just .202 and slugged .358 against breaking balls in 2024, he boosted that to a .275 AVG/.517 SLG in ’25; while he fell off against fastballs (from .274 AVG/.514 SLG to .218 AVG/.431 SLG), he did cut his whiff rate against them from 29.5% to 21.6%. Defensively, he won his second consecutive Gold Glove while placing second among all right fielders in both FRV (9) and DRS (15, tied with Tatis).
While Abreu hit just .230/.299/.377 (85 wRC+) in 68 plate appearances against lefties, that was a huge improvement from his 49 wRC+ against them in 2024. Manager Alex Cora says the team will push 26-year-old lefty to “figure out lefties” by giving him more playing time against them. Still, at times he may have to yield to the lefty-swinging Anthony, the team’s 21-year-old wunderkind and regular left fielder, so that Cora can find time for all of his outfielders. Eaton, a 29-year-old right-hander who had some small-sample success when Boston’s roster was particularly banged up late last year, is battling for the final spot on the Opening Day roster.
Frelick reportedly added 25 pounds of muscle during the 2024-25 offseason and it translated to a stronger performance in his third major league season, with his .288/.351/.405 (114 wC+) line representing gains of 29 points of average, 31 of on-base, 70 of slug, and 27 in wRC+. He did hit the ball harder — how else could he have increased his home run output from two to 12? — but that’s not to say he consistently hit it hard; his 85.5 mph average exit velo, 3% barrel rate, 27.2% hard-hit rate, and .339 xSLG all placed in the eighth percentile or lower. He increased his pulled air rate from 14% to 17.8% while spraying a flurry of singles over the heads of infielders and ripping the occasional worm-burner down the lines. Notably, he improved markedly against lefties (from an 85 wRC+ to 101), which earned him more playing time. With 19 steals in 25 attempts and outstanding defense — third among right fielders in FRV (7) and fifth in DRS (9) — his 3.6 WAR more than doubled his 1.5 mark from 2024.
Chourio, who played 20 games in right field, lost a month to a right hamstring strain and took a step backwards from his rookie season. He hit .270/.308/.463 (111 wRC+), losing 19 points of OBP on an otherwise nearly-identical line as his chase and swing rates both rose by around five points and his walk rate eroded from 6.8% to 5.1%. He’s still just 22 with a bright future ahead. Bauers is a 30-year-old lefty backing up first base and the outfield corners, while Lockridge, a 29-year-old righty, is organizational depth.
In his fourth season in the majors, Suzuki set a stateside high with 32 homers while hitting .245/.326/.478 (123 wRC+). Though his batting average was 38 points lower than in 2024, he dropped just four points of slugging percentage, as he barreled a career-high 16.6% of batted balls (a 95th-percentile performance) and improved his pulled air rate from 15.2% to 24.3%. He played just 48 games in the outfield (32 in right) compared to a career-high 102 at DH, but with Moisés Ballesteros ready for the majors, the 31-year-old veteran is slated to return to regular outfield duty. He did suffer a minor sprain of the posterior collateral ligament in his right knee during the World Baseball Classic quarterfinals, but he has not yet been ruled out for Opening Day.
Conforto collapsed so completely with the Dodgers (.199/.305/.333, 83 wRC+) that they left him off their postseason roster and then rolled to a championship. The lefty-swinging 33-year-old is in camp on an NRI, as is Carlson, a switch-hitting 27-year-old who hit just .203/.278/.336 (74 wRC+) for the Orioles last year. Shaw, who entered last year as the no. 13 prospect in our Top 100, struggled to make quality contact (84.9 mph average exit velo, 29.4% hard-hit rate) and hit just .226/.295/.394 (93 wRC+) with 13 homers and 17 steals. Displaced by the Alex Bregman signing, he’s vying for playing time at several positions he last played in the minors or collegiate summer leagues. McCormick, a 30-year-old righty, is yet another NRI, a former staple of the Astros outfield before back-to-back injury-plagued seasons with a wRC+ in the 60s.
Wallner is a 28-year-old lefty, a 6-foot-4, 220-pound thumper with exceptional raw power but major contact issues. Last year, he homered 22 times in 104 games while hitting .202/.311/.464 (114 wRC+) with a 29.1% strikeout rate, but he missed about eight weeks due to strains to his left hamstring and right oblique. After previously struggling against lefties, he put up a 118 wRC+ against them in 97 plate appearances. His drop from a 55th-percentile sprint speed in 2024 to the 33rd-percentile in ’25 may have owed to his hamstring injury, and likewise for his decline in the range components underlying his -6 DRS and -2 FRV in 654.1 innings in right field. He does have one of the strongest arms in the majors.
After years of impressive minor league slash stats, Roden entered last year’s Top 100 as a 50-FV prospect following a strong spring, then was traded to Minnesota from Toronto in the Louis Varland/Ty France deadline deal. Between the two teams, he hit just .191/.261/.294 (56 wRC+) in 153 plate appearances in the majors with a 24.2% strikeout rate, uncharacteristically high given his contact skills. The 26-year-old lefty profiles as a platoon bat, and still has options remaining.
The lefty-swinging Outman had a big rookie season for the Dodgers as a 26-year-old in 2023, but since then he’s hit just .141/.237/.293 (50 wRC+) with a 38.8% strikeout rate in 304 plate appearances between demotions to Triple-A. Acquired in the Brock Stewart trade, he’s battling for a bench role. Rodriguez is a 23-year-old lefty center field prospect who plays flashy defense, while Gonzalez a 22-year-old righty with a plus hit tool and the arm for right.
Though healthy enough to top 150 games annually from 2022–25, Nimmo has faded from a four- to five-win player to a three-win one since moving out of center field and into his 30s (he turns 33 on March 27). Traded for Marcus Semien in November, he’ll play right field regularly for the first time since 2018. While he’s hitting the ball much harder than half a decade ago — his 25 homers, 91.9 mph average exit velo, and 50.2% hard-hit rate all set career highs — he’s no longer an on-base machine. His 7.7% walk rate was over four points below his career norm, and his .262/.324/.436 line was 40 points of OBP off his career mark even while his average and slug were essentially on the money. Still, Nimmo should easily surpass the 1.0 WAR Adolís Garcia and his fellow right fielders produced for Texas last year.
The 31-year-old switch-hitting Haggerty has proven he can provide league-average production and some extra speed as a fourth outfielder, but he’s spent over 200 days on the injured list in the last two seasons. Osuna, a 23-year-old lefty, is a high-energy reserve who’s stretched in center and who struggled to a .212/.313/.278 (72 wRC+) line in 63 games as a rookie. The 37-year-old Canha and 39-year-old McCutchen are both NRIs at this stage. Canha, long a reliable righty bat, cratered last year while missing time due to a left abductor strain and left tennis elbow. McCutchen will likely platoon with Joc Pederson at DH; he logged fewer than 150 defensive innings over three seasons during his second stint in Pittsburgh.
Beavers, a lefty-swinging 24-year-old, placed 39th on this year’s Top 100 as a 50-FV prospect with long levers (he’s 6-foot-5), above-average power and speed, and a great approach at the plate. In 35 games with the Orioles, he hit .227/.375/.400 (125 wRC+) after a .304/.420/.515 (152 wRC+) showing with 18 homers and 23 steals at Triple-A. O’Neill, a 30-year-old righty, has a six-year streak of homering on Opening Day… and a five-year streak of making multiple trips to the IL. Last year, a left shoulder impingement and bouts of inflammation in his neck and right wrist limited him to 54 games and a .199/.292/.392 (91 wRC+) line. While he barreled the ball 16.5% of the time, he fell far short of his .243 xBA and .523 xSLG.
Jackson is a 25-year-old righty who hit a promising .276/.328/.447 (117 wRC+) in 48 games split mainly between right field and third base; he projects to spend most of his time at third and second given Jordan Westburg‘s torn UCL and Jackson Holliday’s fractured hamate. Taveras is a 27-year-old switch-hitter with outstanding speed but a career wRC+ of just 82. Kjerstad is a lefty-swinging 27-year-old who ranked 24th on our 2024 Top 100 as a 55-FV prospect, but he hasn’t reached his potential, with a concussion (2024) and a fatigue-related medical issue (2025) both looming large.
After scuffling as a rookie in 2024, Barger broke out to hit .243/.301/.454 (107 wRC+) with 21 homers while splitting time between third base and right field. He made a host of mechanical adjustments, adding bat speed while flattening his swing and taking a more controlled two-strike approach. The result was much better contact, with his barrel rate placing in the 70th percentile, his average exit velo in the 86th and his hard-hit rate in the 91st. In just 413 innings, his arm value (4 runs) ranked second among right fielders behind only Mike Yastrzemski, covering for below-average range. Given the signing of third baseman Kazuma Okamoto, the 26-year-old lefty will likely spend more time in right this year.
Springer is coming off his strongest season since 2019; in his age-35 campaign, he homered 32 times and hit .309/.399/.560 (166 wRC+), setting career bests in all of those rate stats except for slugging percentage. Notably, he improved his bat speed, cut his chase rate to a career-low 20.4%, and DHed a career-high 82 times, double his combined total for 2023–24; meanwhile, in 44 games in right, his metrics were bad (-6 DRS and -6 FRV). Lukes, a 31-year-old lefty who hit .255/.323/.407 (103 wRC+) in his first extended taste of the majors, played more right than left in 2025 but figures to reverse that in ’26, sharing time with Sánchez and Davis Schneider. Straw, a 31-year-old lefty whose primary selling points are elite speed and defense, is coming off a comparatively robust .262/.313/.367 (91 wRC+) line, but the Blue Jays have additional alternatives.
In the wake of his seven-year, $65.5-million extension, Butler couldn’t match his 2024 breakout performance. Even while hitting 21 homers and stealing 22 bases, his .234/.306/.404 (96 wRC+) line represented a loss of 86 points of slugging percentage and 34 points of wRC+. After slugging .474 with a 124 wRC+ through June 8, he tailed off dramatically, slugging .343 with a 73 wRC+ thereafter. His season strikeout rate rose from 23.9% to 28.4%, his wRC+ against lefties cratered from 139 to 52, and his quality of contact suffered. Though he played 152 games and put up solid defensive numbers, his knees may have contributed to his woes; in October, he had surgery to repair a torn right patellar tendon in his right knee and received a PRP injection for chronic patellar tendinitis in his left. The 25-year-old slugger didn’t make his Cactus League debut until March 17, but sim games and live batting practice have kept him on track for Opening Day.
Butler will probably see time in center field, while Thomas, a 25-year-old righty, covers left. As a rookie, he hit a lopsided .225/.267/.417 with six homers in 132 plate appearances and ungodly strikeout and walk rates (37.6% and 5.3%, respectively). Cortes, a lefty-swinging 28-year-old, hit .309/.323/.543 (132 wRC+) in 99 plate appearances as a rookie and made history as the majors’ first switch-throwing position player during an emergency one-inning appearance at third base (he played 121 games at second in the minors). Gelof is learning the outfield after being bumped off second by Jeff McNeil. Speaking of emergencies, that’s the best reason for Rooker, the team’s regular DH, to play right given appalling defensive metrics.
After a torn labrum in his left (non-throwing) shoulder curtailed his first stateside season before he fully adjusted to the majors, Lee made a much more representative showing, hitting .266/.327/.407 (107 wRC+) while striking out just 11.5% of the time. He made several mechanical adjustments, opening his stance from 33 degrees to 43, moving deeper in the batter’s box, and moving his point of contact closer to the front of the plate and to his center of mass. While his average exit velo, barrel and hard-hit rates merely placed in the 10th or 11th percentiles, his overall offensive performance resembled the ZiPS projections from when he signed. His metrics in center field diverged wildly (-18 DRS, -2 FRV) but with the addition of Harrison Bader, the 27-year-old Lee has been bumped to right, where he played 275 games in the KBO.
Matos, the Giants’ top prospect and no. 12 on The Board circa mid-2023, has yet to put it together in the majors. He hit for an uneven .221/.266/.424 (91 wRC+) while showing off exceptional contact skills, but subpar defense left him below replacement level. The 24-year-old righty, who’s out of options, could cover for Lee’s 77 wRC+ against lefties. Brennan, a 28-year-old lefty who was non-tendered by Cleveland, played just six games in the majors and 35 in the minors before undergoing Tommy John surgery in June. Gilbert, a 25-year-old lefty who’s been slowed by a shoulder impingement this spring, is a 2022 first-round pick by the Astros who hit just .190/.248/.350 (66 wRC+) last year. Notably, he played under new manager Tony Vitello at Tennessee.
With Cleveland giving four-time Gold Glove winner Steven Kwan a long look in center field this spring but not yet formally announcing a move, the working assumption is that the 25-year-old Valera and the 24-year-old DeLauter, both lefties, will man left and right respectively. A 2022 first-round pick out of James Madison, DeLauter is a 55-FV prospect who placed 26th on our preseason Top 100 after making his major league debut in the Wild Card Series. He’s a 6-foot-3 thumper with great contact skills, a selective approach, and plus power; in 34 games at Triple-A last year, he posted walk and strikeout rates of 14.8% and 15.4%, respectively. Unfortunately, he’s been beset by injuries. In 2025, he missed time for surgery to repair a sports hernia and remove a fractured right hamate, that after playing just 96 games in 2023–24 as well.
Kayfus, a 24-year-old lefty, hit .300/.390/.539 (151 wRC+) with 14 homers at Double- and Triple-A, then .220/.292/.415 (96 wRC+) in a 44-game trial with the Guardians. He profiles best as a platoon first baseman, but the presence of Kyle Manzardo pushed him to play more right field as a rookie. Rodríguez, a 26-year-old righty, hit a meager .176/.282/.304 (70 wRC+) in 117 plate appearances for Cleveland in 2024–25; he has huge power and an impact arm, but as his 30.8% strikeout rate attests, major contact issues threaten to consign him to Triple-A depth. Schneemann is a 29-year-old superutilityman with a career 84 wRC+.
Robles entered the 2025 season with a new lease on life. Released by the Nationals after years of failing to live up to his top prospect billing — he was as high as no. 5 on our 2019 Top 100 list — he broke out with the Mariners and earned a two-year, $9.75 million extension. Ten games into last season, he fractured the humeral head in his left shoulder while making a spectacular catch. He didn’t return until late August, had to serve a seven-game suspension for throwing a bat at a pitcher while on a rehab assignment, and hit just .245/.281/.330 (75 wRC+) in 32 games, production that recalled his struggles in Washington. Can he recapture the magic from 2024, when he hit .328/.393/.467 (155 wRC+) with a career-best 6.8% barrel rate following his move to Seattle? The Mariners don’t lack for alternatives if he can’t.
Raley, normally a solid lefty-swinging platoon bat, is trying to rebound himself after hitting .202/.319/.311 (91 wRC+) in 73 games and missing time due to an oblique strain and back spasms. The lefty-swinging Canzone and righty-swinging Refsnyder are expected to cover DH when Cal Raleigh doesn’t need to park there. Both raked in limited duty last year, with the former hitting .300/.358/.481 (141 wRC+) in 82 games while taking advantage of Robles’ absence and the latter batting .269/.354/.484 (128 wRC+) in 70 games as Wilyer Abreu’s platoon-mate in Boston. Donovan, a superutilityman acquired from the Cardinals in early February, will spend most of his time at third base but has 30 games of experience in right.
The second pick of the 2023 draft, the 24-year-old Crews has struggled in the majors thus far, including a .208/.280/.352 (77 wRC+) performance in 85 games in 2025. Losing 12 weeks to an oblique strain didn’t help, but he was absolutely eaten alive by breaking balls, hitting just .180 and slugging .220 against them with a 36.5% whiff rate; meanwhile he slugged .303 with a 40.6% whiff rate against offspeed stuff. Facing lefties was another problem, as he hit just .200/.241/.280 (44 wRC+) against them. While we’re used to seeing Nationals prospects hit the ground running — including Wood, their 23-year-old DH/left fielder, and already an All-Star — this one is going to take longer.
Despite his offensive shortcomings, Crews could see additional time in center field, opening up right for another young outfielder. Lile, a lefty-swinging 23-year-old who was a second-round pick in 2021, was a 45-FV prospect, a contact-oriented platoon bat who made the most of the opportunity afforded by Crews’ injury, hitting .299/.347/.498 (132 wRC+) with 11 triples and nine homers in 91 games. He didn’t make great contact (his hard-hit rate placed in the 35th percentile), but he did pull 20.1% of his balls in play in the air. His defense in right was DH-caliber (-7 FRV, -10 DRS in 445.1 innings), but he currently projects to get more playing time in left than Wood. The 24-year-old Hassell, a former first-rounder acquired from the Padres in the Juan Soto trade, hasn’t lived up to his billing and lacks a plus offensive trait. He managed just a 58 wRC+ with a 30.1% strikeout rate while playing mostly center field.
The 33-year-old García went from winning a Gold Glove and a World Series ring in 2023 thanks to a 39-homer, 4.7-WAR season with elite defense to being non-tendered last fall after a .227/.271/.394 (83 wRC+) showing — career worsts across the board — with just 19 homers. The plate discipline that fueled his 2023 breakout deserted him, as evidenced by his 35.7% chase rate and 5.1% walk rate; with declining bat speed, he didn’t produce enough power to offset those drops. He also played just 19 games after August 12 due to left ankle and right quad strains. After a dreadful defensive metrics in 2024 (-5 DRS, -11 FRV), he was back in the black to one degree or another (16 DRS, 2 FRV). He should provide at least a one-win upgrade over the since-released Nick Castellanos on defense alone, and if his spring work to rein in his free-swinging ways takes hold, he’ll be a substantial upgrade.
Rincones is a 6-foot-3, lefty-swinging 25-year-old with plus-plus raw power but a high tendency to whiff. He’s battled injuries throughout his career but has annihilated righties when healthy (.256/.362/.476) while being a pushover versus lefties (.164/.257/.224); at Triple-A last year, he hit .240/.370/.430 (115 wRC+) with 18 homers overall. He could get a shot at a platoon role at some point, though in the meantime Marsh, the long half of a left field platoon, or Moore, a superutilityman in camp on an NRI, will likely serve as backups. Marsh hit for a thoroughly representative 116 wRC+ last year while Moore uncharacteristically scuffled to an 83 wRC+ with Seattle and Texas after three straight years above 100.
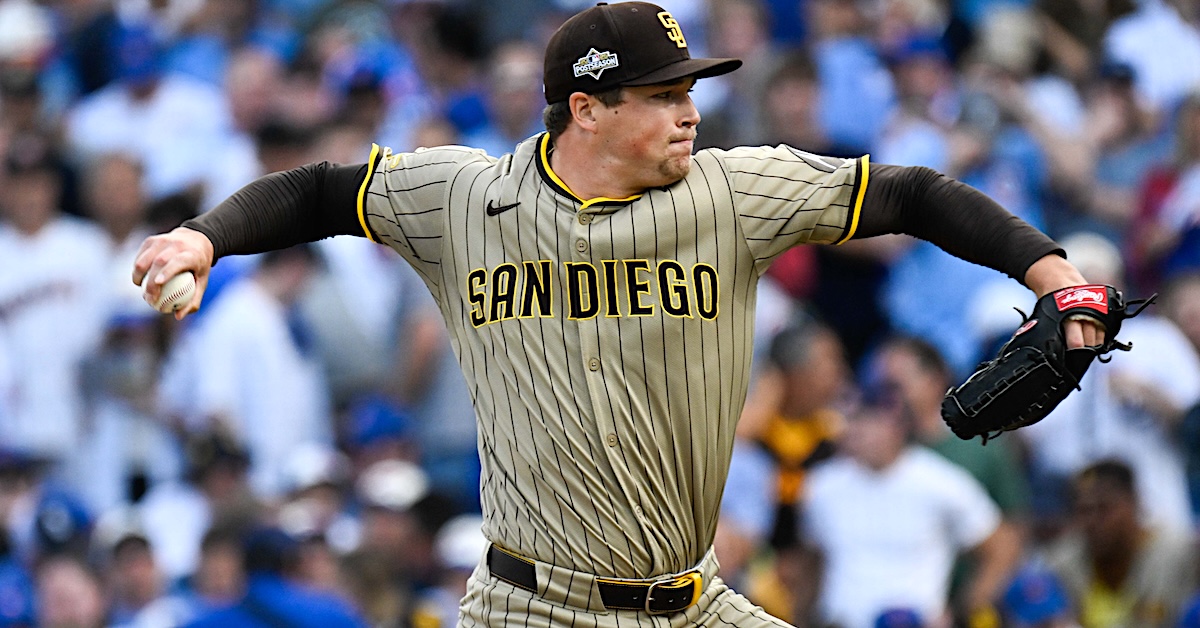
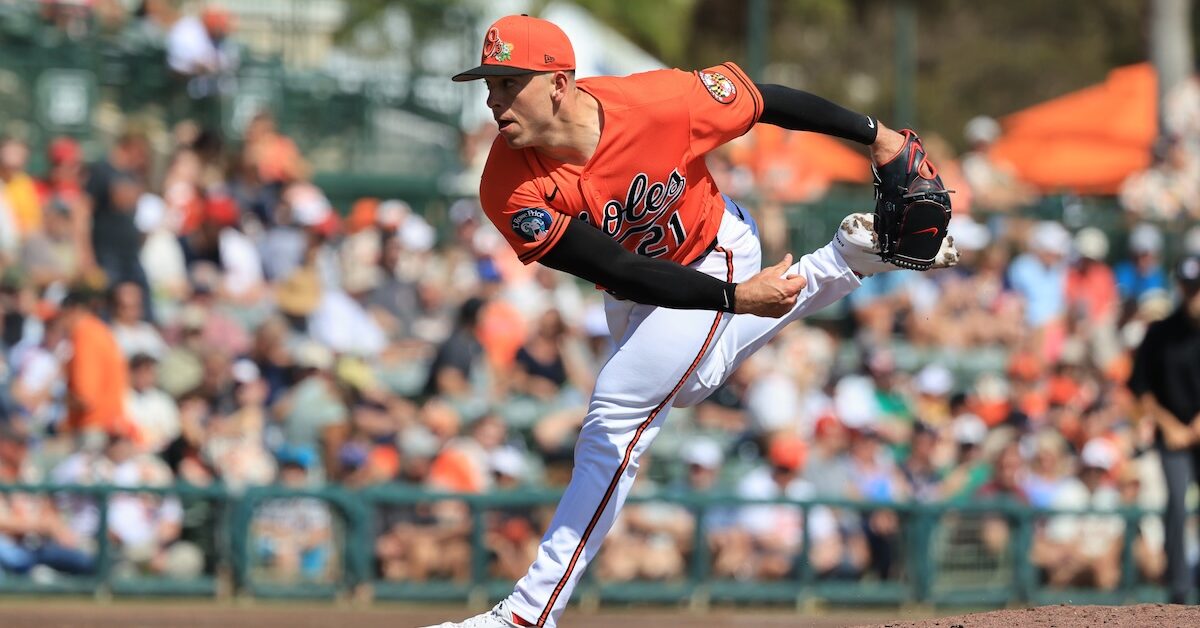
Remarkably, the two-year, $29 million contract to which the Pirates signed O’Hearn is the largest free agent outlay in franchise history. The 32-year-old lefty, who split last season between Baltimore and San Diego, is coming off a career-high 17 homers and a 127 wRC+ (.281/.366/.437), his highest mark since his abbreviated 2018 rookie campaign. His 135 wRC+ in a career-high 109 plate appearances against lefties has him lined up to see additional time at first base to complement lefty Spencer Horwitz; historically, he’s been shaky in right, with -11 DRS and -4 FRV in just 634 innings.
Mangum, a 30-year-old switch-hitter acquired from the Rays in the same deal that brought over Brandon Lowe, finally reached the majors with the Rays last year. The contact-oriented speedster hit .296/.330/.368 (95 wRC+) with 27 steals and 1.8 WAR in 118 games. He played all three outfield spots and was stronger against righties (102 wRC+) than lefties (81 wRC+). Known as “The Password” for his difficult-to-spell first name, Garcia is a 23-year old righty acquired from the Red Sox in December after getting a brief call-up in late August. He’s a toolsy 45+-FV prospect who can play center field and has some pop, but he struck out 26.8% of the time while batting .276/.340/.470 (116 wRC+) with 21 homers at Double- and Triple-A, and is especially vexed by sliders and high fastballs.
The sixth pick of the 2024 draft, Caglianone is a 6-foot-4, 250-pound lefty who tore up the minors before spending most of June, July and September with the Royals, interrupted by a return to Triple-A. Though he mashed 11 homers and slugged .705 in 28 games at Triple-A in the midst of that, he floundered in the majors, batting a cringeworthy .157/.237/.295 (46 wRC+) in 62 games, with -1.6 WAR. His 22.4% strikeout rate wasn’t awful, but despite his elite bat speed and power, he hit far too many grounders (his average launch angle was just 4.1 degrees). That said, his contact was better than that gruesome slashline suggests, with a .237 xBA and .431 xSLG. A pitcher and first baseman in college, he has the arm for right but not the mobility; he compiled -7 FRV and -4 DRS in just 402.1 innings. The Royals appear inclined to let the 23-year-old figure it out in the majors, so it could be a bumpy ride.
Thomas, a 30-year-old righty, has built a career thanks to his proficiency at hitting lefties (135 wRC+ career) and an ability to cover center, but his 2025 season with the Guardians was wrecked by a bone bruise in his right wrist and then plantar fasciitis in his right foot. He played just 39 games and hit .160/.246/.272 (48 wRC+) before undergoing season-ending surgery in late September. The 37-year-old Marte has battled injuries for years, having last played at least 100 games in 2022. Last year, he hit .270/.335/.410 (112 wRC+) in 98 games for the Mets, just 12 of which were in the outfield — a logical choice given his terrible defensive metrics in 2023–24.
Caissie, a lefty-swinging 23-year-old, was the headline prospect in the deal that sent Edward Cabrera to the Cubs in January. It was Caissie’s second time being dealt since the Padres chose him in the second round in 2020; he came to Chicago in the Yu Darvish trade. After hitting .286/.386/.551 (139 wRC+) with 22 homers in 99 games and getting a cup of coffee with the Cubs in August and September, he placed 62nd on this spring’s Top 100 as a 50-FV prospect with elite raw power but significant contact issues; mighty Caissie struck out 27.9% of the time at Triple-A last year.
Conine, a 28-year-old lefty who has hit a respectable .261/.320/.435 (109 wRC+) in 175 plate appearances over two seasons, will be an option in both outfield corners, and at DH and first base, a position he’s learning this spring. Hernández, a 26-year-old righty, garnered down-ballot Rookie of the Year support after hitting .266/.347/.438 (118 wRC+) in 87 games split between the outfield corners and DH. Stowers, the team’s primary left fielder, is a 28-year-old lefty coming off a 25-homer, 149-wRC+, 4.0-WAR breakout. He did play 42 games in right, and could fit with Caissie as part of a platoon at both corners.
Detroit’s outfield was plagued by injuries last spring, with Pérez’s lower back inflammation and Vierling’s right shoulder strain knocking both out of action from late March to late May, while center fielder Parker Meadows was sidelined as well. Pérez, a 26-year-old switch-hitter with minimal platoon splits, improved most facets of his game in his second major league season, hitting .244/.308/.430 (103 wRC+) with 13 homers while splitting time between right field (where he was above average by the metrics) and center (where he scuffled in limited duty). A sluggish spring has him battling with Meadows for an Opening Day roster spot, and he has two options remaining, but he’ll eventually figure prominently here.
Vierling made two additional trips to the IL for right shoulder inflammation and an oblique strain, and only played 31 games, hitting just .239/.310/.307 (76 wRC+) after two years of league-average-ish production. The 29-year-old righty, who owns a 100 wRC+ against lefties over the past three seasons, can platoon with the lefty-swinging Carpenter, though the latter will spend more of his time at DH. Carpenter set career highs with 130 games and 26 homers but chased more often than ever; he hit .252/.291/.497 (115 wRC+) with a 3.9% walk rate, fifth-lowest among hitters with a least 400 plate appearances. McKinstry, a lefty-swinging superutilityman, hit a career-best .259/.333/.438 (114 wRC+) with 12 homers and 19 steals while making his first All-Star team. He played at least 15 games at four different positions and spotted at two others, but figures to play mainly at third base this season.
The 10th pick of the 2017 draft and fourth on our Top 100 three years later, Adell — who turns 27 on April 8 — finally put together a workable major league season. He placed fourth in the American League with 37 homers and 12th in slugging percentage while finishing with a 112 wRC+ — not too shabby for someone who logged most of his time in center field. However, he walked just 5.8% of the time and struck out 26.4% — still almost six points below his previous career mark — en route to a lopsided .236/.293/.485 line. With his 99th-percentile bat speed, he put a charge in the ball when he connected, with average exit velocities, barrel and hard-hit rates ranging from the 87th to 97th percentiles, but he posted whiff rates of 35.1% against breaking balls and 41.1% against offspeed pitches. He was overmatched in center, with -8 FRV (dead last) and -13 DRS (fourth worst) in just 724 innings; he wasn’t so hot in right, either (-5 FRV, -1 DRS in 535 innings), but he’ll play there given plans to return Trout to center.
Lowe, a 2016 first-rounder, has been moving steadily backwards since his 2023 breakout amid a barrage of injuries. When he re-strained his right oblique on Opening Day 2025, it marked his third such injury within a year. After missing nearly seven weeks, he hit just .220/.283/.366 (79 wRC+), with decreased bat speed and a 5.9% barrel rate. Traded to the Angels in a three-way deal in January, he’ll mainly platoon in left while providing the lineup’s best hope for lefty power — you were expecting Frazier or Nolan Schanuel?
Smith went from being chosen by the Cubs as a third baseman with the 14th pick of the 2024 draft to debuting as the Astros’ Opening Day right fielder inside of nine months; the then 22-year-old righty was filling the shoes of Kyle Tucker, for whom he was traded in December 2024. With just 32 games of minor league experience, his intro was shaky; he hit .236/.312/.358 (90 wRC+) with a 27.8% strikeout rate, and plummeted from a 116 wRC+ before the All-Star break to a 41 after. While he showed off exceptional bat speed, his squared-up rate placed in just the third percentile, and his average exit velo, barrel and hard-hit rates ranged from the 19th percentile to the 40th. He hit just .175 and slugged .333 with a 25.6% whiff rate on four-seamers from righties and was similarly overwhelmed by breaking balls from them (.191 AVG/.313 SLG, 35% whiff). To his credit, he thrived at his new position (12 DRS, 0 FRV). The possibility of a Triple-A stint or some kind of job share looms, though he’s mashing the ball this spring.
Cole, a lefty-swinging 25-year-old, clubbed four homers in 15 games while sharing right field with Smith in September, that after hitting .279/.377/.539 (151 wRC+) with 19 homers and 18 steals, but also a 35.1% strikeout rate at Triple-A. Contact issues may make him an up-and-down fifth outfielder, though his handedness makes him a potential complement for Smith and gives him a leg up on the righty-swinging Dezenzo, who hit .245/.321/.367 in 34 games before left hand inflammation effectively ended his season in early June.
With Juan Soto moving to left to replace the departed Nimmo, the 23-year-old Benge, a 2024 first-round pick out of Oklahoma State, is getting a long look this spring despite playing just 56 games so far above A-ball and struggling mightily at Triple-A (.178/.272/.311 in 24 games). Benge is a lefty-swinging 55-FV prospect who placed 21st on our Top 100; though he lacks any standout tool, he projects to be above average everywhere except his game power (45 PV/50 FV), and his plus arm is well-suited to right. Even if he doesn’t crack the Opening Day roster, he has a real shot at significant time in the majors this year.
Taylor, a 32-year-old righty, got the bulk of the playing time in center field last year but hit a meager .223/.279/.319 (70 wRC+) and was displaced by the acquisition of Luis Robert Jr. Baty, a 26-year-old lefty, knows the feeling, having been unseated at third base by Bo Bichette and at second — a position he picked up on the fly last year — by Marcus Semien. After hitting a respectable .254/.313/.435 (111 wRC+), he’s adding right field and first base to his repertoire this spring, making him a potential multi-position successor to the since-traded Jeff McNeil. Tauchman, a 35-year-old NRI, is vying for a roster spot after hitting .263/.356/.400 (115 wRC+) with the White Sox; he’s a lefty but is platoon-neutral. Melendez, another NRI, is a lefty-swinging 27-year-old with a career 88 wRC+.
Though he won’t turn 24 until May 22, Walker has been moving steadily backwards since placing 12th on our 2023 Top 100 as a 60-FV prospect. Last year, in addition to losing about six weeks due to left wrist inflammation and appendicitis, he hit just .215/.278/.306 (66 wRC+) with a 31.8% strikeout rate, and was again unable to translate his 99th-percentile bat speed into consistent contact. He slugged just .305 against four-seamers with a 30.9% whiff rate, and even higher whiff rates against breaking balls (42.7%) and offspeed stuff (47.8%). His defense in right field was brutal as well (-6 FRV, -11 DRS). The Cardinals continue to tinker with his swing, hoping things click into place.
Nootbaar stayed healthier than before, playing a career-high 135 games while making only one trip to the IL (three weeks for a costochondral sprain) instead of two or three. Even so, he slipped to a 96 wRC+ (.234/.325/.361) after three seasons of 114 or better. He swung faster and hit the ball in the air far more often, but a slightly flatter swing path produced a 90th-percentile popup rate. He’ll open the season on the IL after undergoing bilateral heel surgery, then serve as the regular left fielder. Church, a 25-year-old lefty, is a 40-FV prospect with a fourth outfielder profile combining speed and above-average contact skills. He hit just .179/.254/.250 in 65 plate appearances for St. Louis after batting .329/.386/.524 (144 wRC+) in Double- and Triple-A. Velázquez, a 27-year-old righty NRI, homered 17 times in 53 games for the Cubs and Royals in 2023, but struggled in ’24 and spent last year struggling even more mightily in Triple-A.
Fraley hit .241/.332/.382 (97 wRC+) in 76 games amid three trips to the IL for a left calf strain, right labrum tear (he didn’t undergo surgery), and a strained oblique; between those last two stints, he was released by the Reds and caught on with the Braves. The 30-year-old lefty rarely hits the ball hard, but his speed and on-base skills keep him a playable platoon option. DeLuca, a 27-year-old righty, missed even more time than Fraley, playing just 20 games due to right shoulder and left hamstring strains. He’s an exceptional defender who can handle all three outfield spots, but he struggled to a .217/.278/.331 (77 wRC+) line in 2024 and has been less effective against lefties (75 wRC+) than righties (90 wRC+) in his brief career. Keeping with the theme, Palacios, a 28-year-old lefty, was limited to 17 games by a fractured ring finger and a right knee sprain last year, but he hit .223/.346/.318 (101 wRC+) in 2024 thanks to a 14.2% walk rate and went 19-for-20 in steals.
Malloy is a 26-year-old righty who hit .209/.311/.346 (89 wRC+) in 357 plate appearances over two seasons with the Tigers, striking out 32.8% of the time; he’s a lesser defender than DeLuca. Melton, a 45+-FV prospect who topped Houston’s updated list last summer, is a 25-year-old lefty acquired in the three-team Brandon Lowe trade. He scuffled in a 32-game trial with the Astros (.157/.234/.186) but projects as a solid fourth outfielder with power and some platoon risk. Vilade is a well-traveled 27-year-old righty who hasn’t hit a lick in his brief major league opportunities.
Signed to a one-year, $6-million deal in late January, Hays hit .266/.315/.453 (105 wRC+) with 15 homers in 103 games for the Reds last year. It was basically a carbon copy of the production he provided in the previous four seasons, albeit in a smaller footprint of playing time given a trio of IL stints for left hamstring, calf, and foot injuries (how’s that for consistency?). He doesn’t walk much or hit the ball especially hard, but he’s not glaringly bad at anything; his subpar defensive metrics from 2024 (a season also marked by injury) appear to be an aberration.
Pereira, who turns 25 on April 10, is a former Yankees prospect who was traded twice within the past eight months. He’s got excellent power and speed, but has struck out far too often — 38.6% through his first 176 plate appearances in the majors — to stick. He’s out of options, as is the 26-year-old Kelenic, an NRI whom the Braves gave up on after he struggled even worse to start 2025 than he had in ’24. Baldwin, a 25-year-old switch-hitter, is coming off a .240/.290/.407 (92 wRC+) performance as a superutilityman. He’ll play more center field than right, though he’s been shut down due to right elbow inflammation. Montgomery, not to be confused with the team’s shortstop, is a switch-hitting 22-year-old whom the Red Sox took in the first round in 2024, then sent to Chicago in the Garret Crochet trade. He placed 100th on our Top 100 this spring as a 50-FV prospect, with big power but contact issues. Despite playing just 34 games above A-ball, he could debut at some point in 2026.
The 38th pick of the 2022 draft, Beck struggled mightily as a rookie in ’24, managing a 31 wRC+ in 55 games and missing 10 weeks due to a left hand fracture. He was better in 2025 but not good, hitting .258/.317/.416 (90 wRC+) with 16 homers and 19 steals but a 29.6% strikeout rate. He’s been unable to translate his above-average bat speed to consistently good contact; while his barrel rate placed in the 50th percentile, his hard-hit rate was in the 28th and his average exit velo in the 14th. He was about average as the regular left fielder in 2025, but the Rockies have moved the going-on-25-year-old to right, which will take better advantage of his strong arm and allow the fleet-footed McCarthy to share left with Tyler Freeman.
McCarthy, a 28-year-old lefty who spent the past five seasons with the Diamondbacks, slipped from a 110 wRC+ and 3.0 WAR in 2024 to a 60 wRC+ and -0.1 WAR in ’25; after an ice-cold start, he spent two months back in Triple-A, but even his post-recall .236/.267/.406 (82 wRC+) performance was grim. Moniak, the lefty-swinging 27-year-old chosen first in the 2016 draft, set career highs in games (135) and homers (24) in ’25 while hitting a respectable but lopsided .270/.306/.518 (110 wRC+). He walked just 4.8% of the time, but that was two points better than during his weird 2023 breakout, while his 23.9% strikeout rate was about 11 points lower. Defensively, he was horrible, with a major league worst -23 DRS as well as -12 FRV in 887 innings spread across three positions.
A year after serving a PED suspension and producing just a 48 wRC+ in 66 games, Marte rebounded to hit .263/.300/.448 (101 wRC+) with 14 homers and 10 steals in 90 games; he started the season in Triple-A and additionally missed two months due to an oblique strain. He chased 33% of pitches and walked in just 4.4% of his plate appearances; while he cut his strikeout rate from 31% to 23.6%, his quality of contact was well below average save for a 50th-percentile barrel rate. With the deadline acquisition of Ke’Bryan Hayes, the Reds moved Marte from third base, where he had struggled, to right field, where he’d never played before. He showed promise, not only with his strong throwing but also a season-saving home run robbery of a Bryan Reynolds drive on September 25. He appears to have a future out there, and given his position on this list, there’s nowhere to go but up.
Benson, a 27-year-old lefty, has been lingering around replacement level after a solid inaugural season in Cincinnati in 2023. Last year, he hit just .226/.273/.435 (85 wRC+) while playing all three outfield positions. Bleday, a 28-year-old lefty, and Myers, a 30-year-old righty, are battling to be part of a multiposition platoon that would send TJ Freidl from center to left against lefties. Both performed well in 2024 but slipped to replacement level in ’25; the former was picked up after being non-tendered by the A’s, the latter acquired from the Marlins in a late December trade.
Yes, every once in a while a team will pretend to have four or six slots, but that team must inevitably confront the truth: Starting rotations have five slots. It’s a matter of policy, preference, and just plain practicality, Mariners general manager Justin Hollander said last year in an interview with Lookout Landing.
“The unfortunate thing about the roster rules is you only get 26 spots, and you only get 13 pitchers. And when you add a sixth starter, you take away a reliever. When you add a sixth starter, sometimes your starters pitch every six days, sometimes they pitch every eight or nine days. Starting pitchers are fussy. They don’t like that. They like to stay on a regular schedule. They like to know when they’re pitching.”
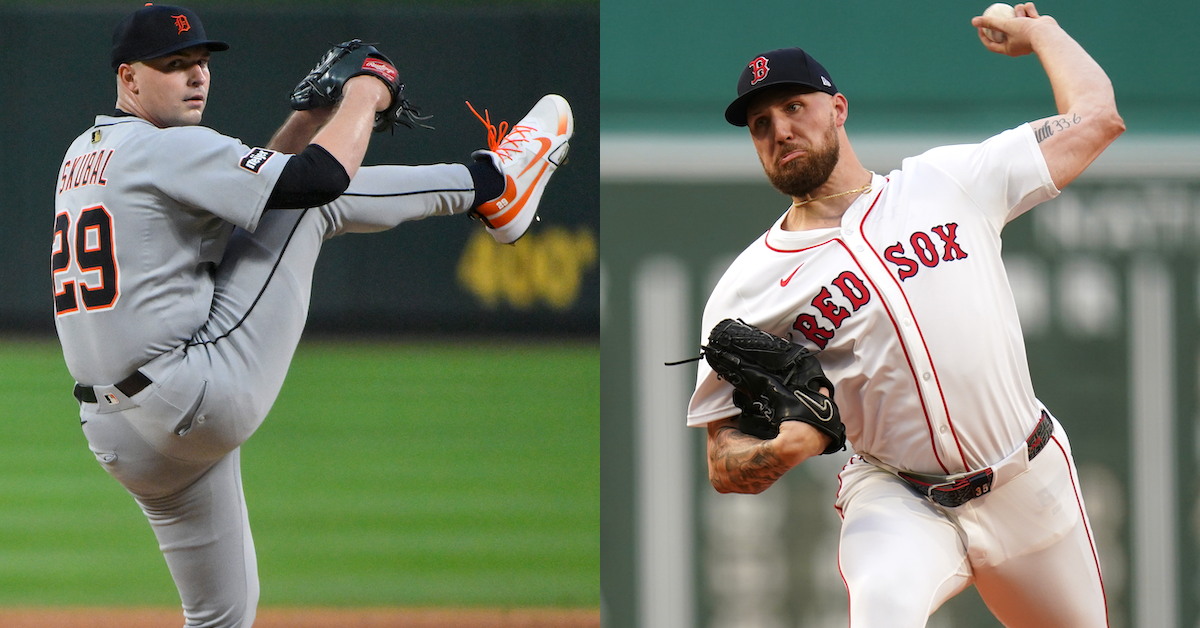
I’ve been thinking about the fixed-nature of rotations lately after reading this discussion between Eno Saris and Jen McCaffrey in The Athletic. They compare the rotations in Detroit and Boston by assigning each pitcher a label (one, two, three, four, five), sizing them up horizontally and vertically, and confronting the trade-offs in quality and depth. This reflects how many of us compare rotations in the abstract, and I wanted to see if this could be applied more broadly. Read the rest of this entry »
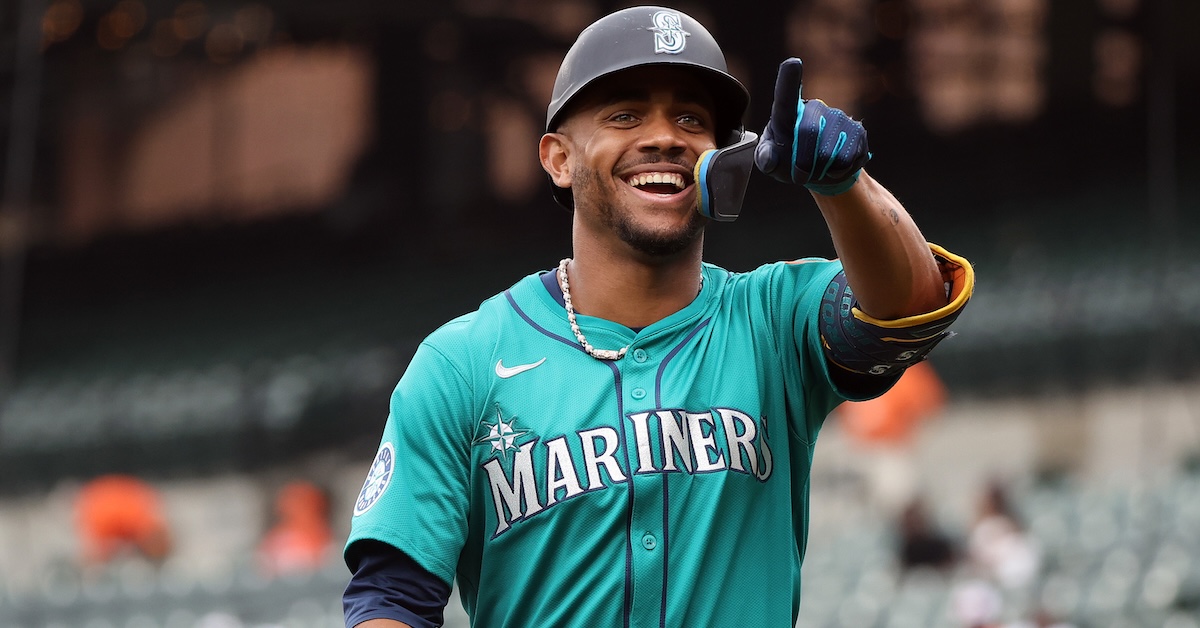
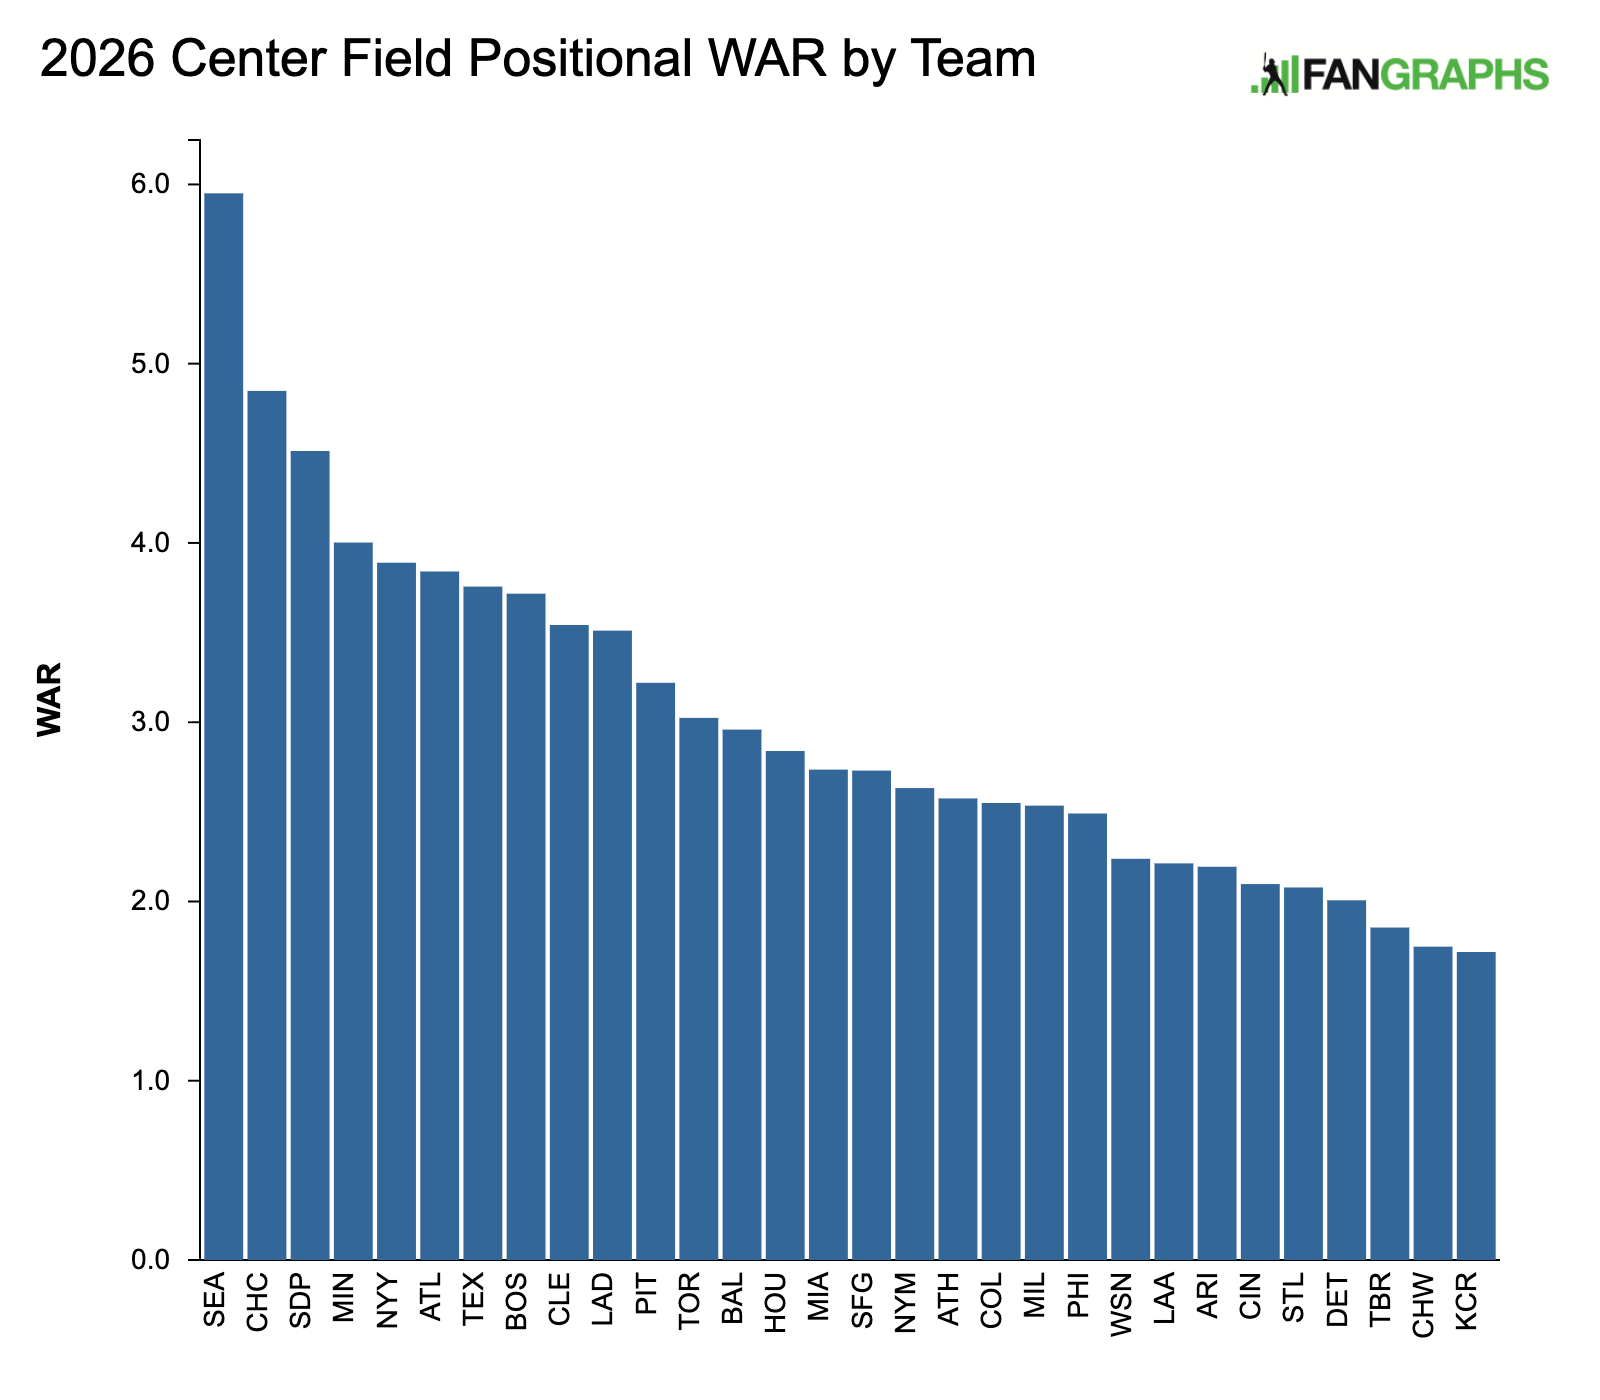
The introduction to last year’s center field rankings highlighted a changing of the guard at the position, initiated by Mike Trout’s departure from the top of the heap in 2024 and continuing with Aaron Judge vacating the no. 2 spot in the rankings in 2025. This year, Trout might be headed back to center field (👀👀👀), but this isn’t a return of the old guard. He no longer sits atop the hierarchy (spoiler alert: the Angels check in at 23rd); the transition is complete.
But the new guard isn’t just new; they’re also young. Which, duh. That’s how lifecycles work. Something gets old or ineffective, and we replace it with a newer, younger model. Perhaps this changing of the guard is enough to explain the simultaneous youth movement happening at the position. Because this is a very young crop of center fielders. This year, the average age of the player at the top of each team’s depth chart is 26.9. Is this data point merely a momentary dip before the average age of center fielders begins its gradual ascent once more? Or is it part of a larger trend? Has center field become a young person’s position? Is the middle pasture strictly playable by folks speedmaxxing and rangemogging their opponents? Will all center fielders soon be wearing JNCOs in their tunnel fits and dressing their Labubus in Gucci?
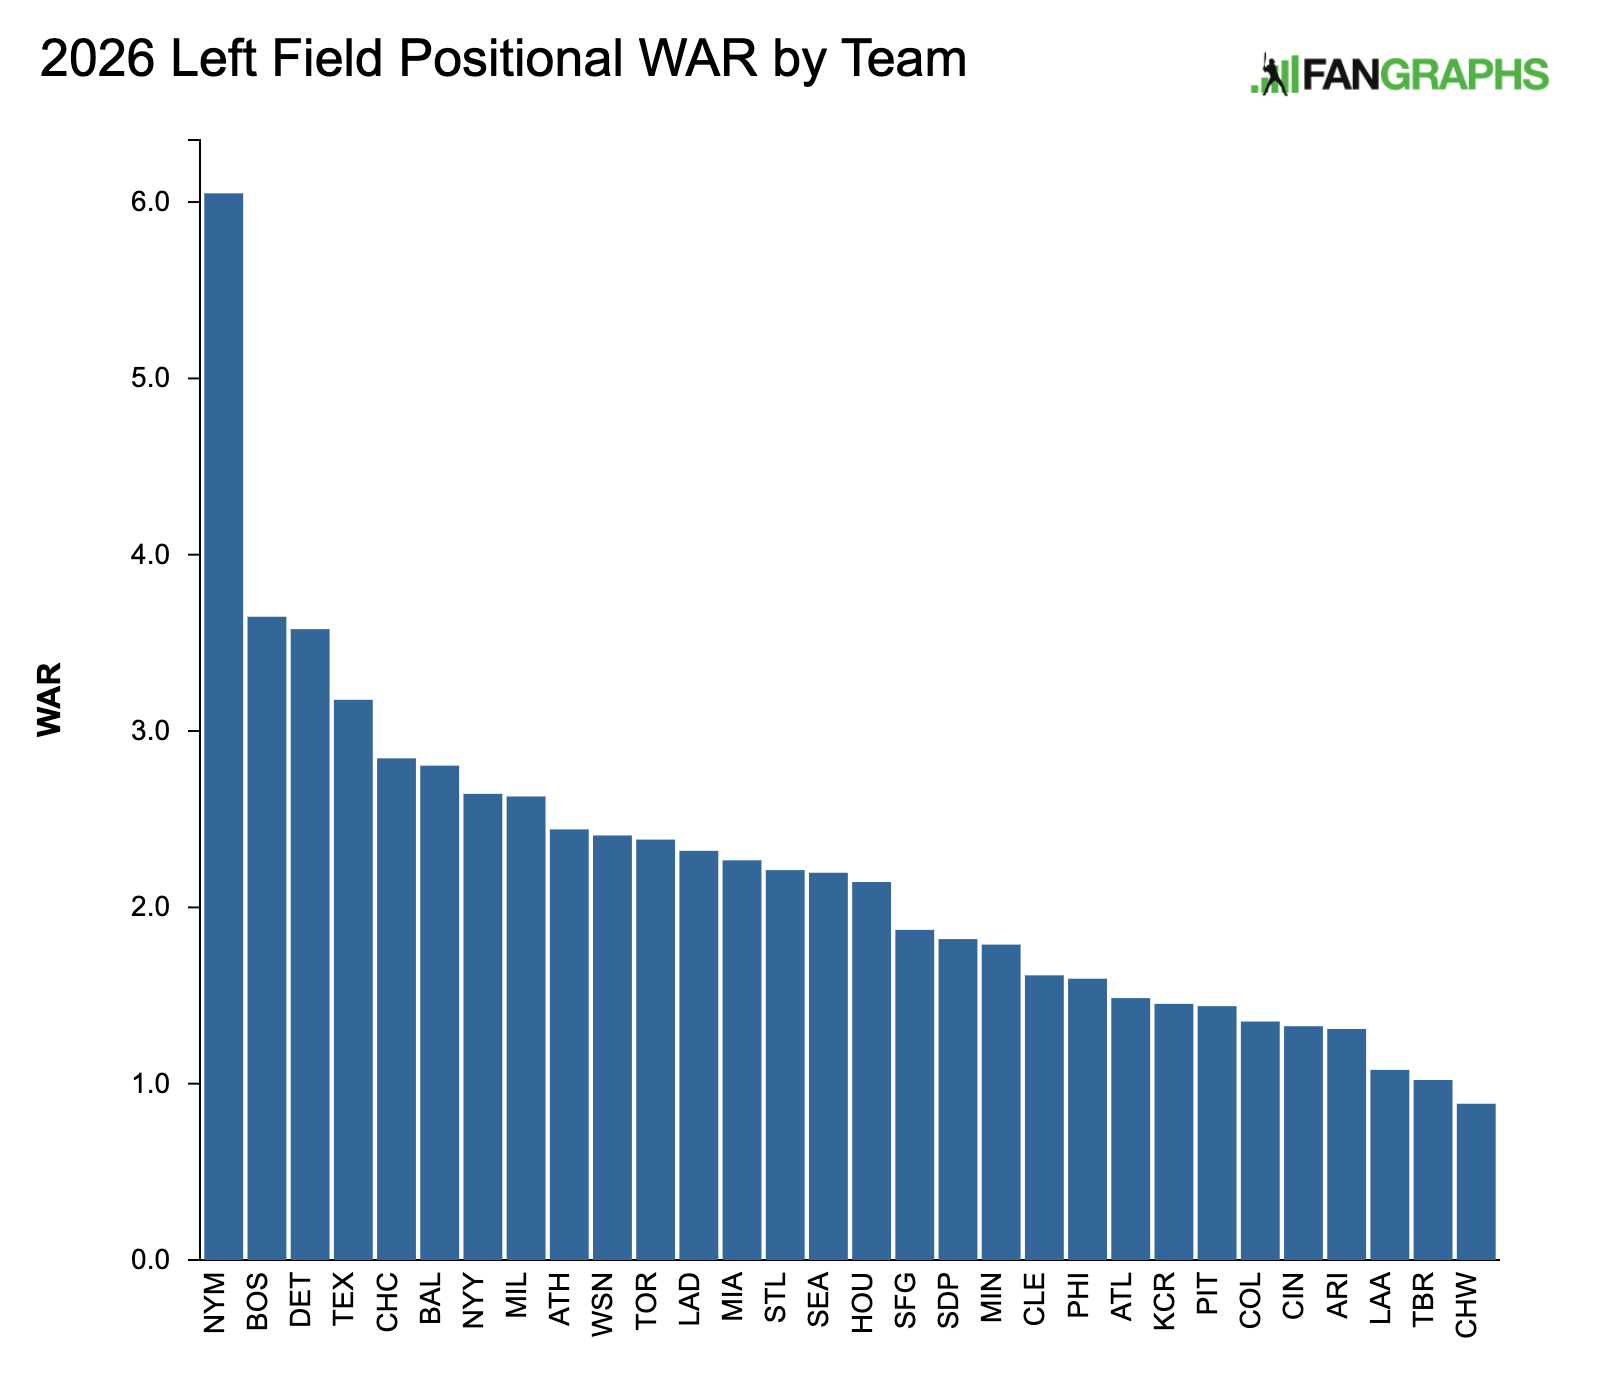
There was a fair amount of movement on this year’s left field list. Most notably, the New York Mets have jumped from ninth to first, and the Boston Red Sox from 13th to second, while the Miami Marlins are now 13th after being second from the bottom a year ago. Those are some of the climbers. Most notable among the teams going in the other direction are the Cleveland Guardians, who plummeted from third to 20th. Position switches play a role in many (but not all) of these season-to-season changes. Moreover, a recent switch actually resulted in a meaningful change to a team’s 2026 ranking. Where they’d have slotted a week ago is different from where they ultimately ended up.
Trades and injuries also move the needle on season-to-season rankings, as does age. The presence of burgeoning young stars like Roman Anthony and Jackson Chourio often (but not always, as you’ll see below) influence up arrows, while long-in-the-tooth veterans still holding onto their positions can result in down arrows. Ditto breakouts and down seasons, regardless of players’ ages. One year affects the next, although it bears noting that good projection systems are savvy enough not to overreact. Projections aren’t perfect, of course. Players outperform and underperform them every season, which will almost assuredly be the case again this year. Read the rest of this entry »