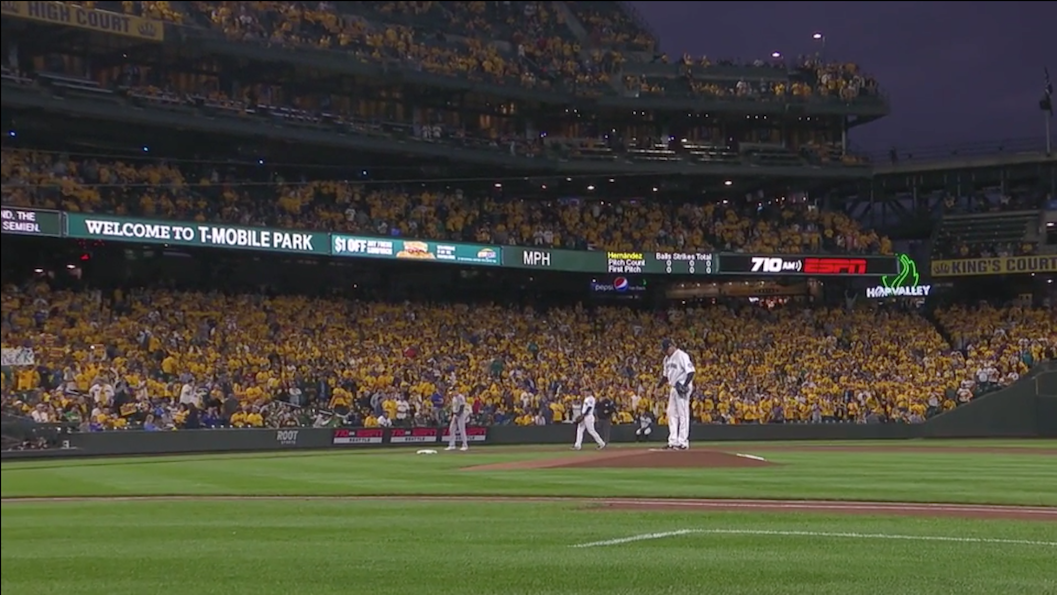
Last Night, Félix Hernández made his final start as a Seattle Mariner, and baseball is a little different for me now. Dimmer, further away. It has been on the road to different for a while, I suppose; it is not an original idea to note how one’s hobby becoming one’s job alters our relationship to our devotions, nor is it novel for a baseball fan or writer to have a guy. You know, your guy? The one who, among all the others, rendered the sport in its most vivid colors, made your appetite for it insatiable, transformed you into a lifer. Your guy. You love your guy! My guy is gone now; I wonder if I’ll ever have another.
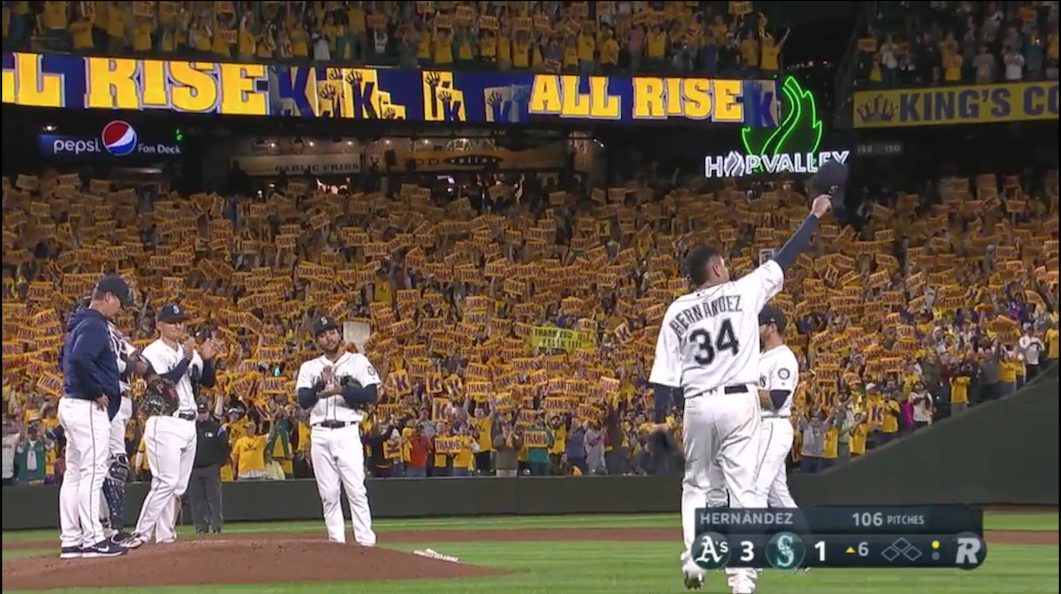
To expect that his last outing would mirror his halcyon days would have been to miss the point. Félix is altered, worn. He threw 106 pitches; at times he labored. When the time came, he wept, and the tears marked a father’s face, a man’s; and he had been so young when we came to know him. He added three strikeouts to his career total, which now stands at 2,524, but there were three runs, too. He pitched into the sixth; he never saw October. He may yet pitch again, decamping to some other city after having stayed all of these years, but it won’t be the same. He isn’t their guy. How could he be? He’s ours.
…
It’s such a funny thing, fandom. It houses within it theft; we make symbols of human beings, transfigure persons so as to serve the function of a satisfyingly smooth stone we transfer from pants pocket to pants pocket. We carry them around with our memories and sadness, spirit them into our bits of kindness paid and received. The special ones, the ones who stick with us, who become our guys, are both magical and not so dissimilar from the restaurant where we paused and realized we were in love, or the couch where we sat and learned that our grandma was sick, the familiar street corner in our hometown where we first thought, I need to go away for a while, and go see things. They become guideposts, markers in our memories for both what they are on the field, and who we were.
To imbue these strangers with so much is a bit silly, and I wonder if it isn’t also a bit rude. I have to imagine that franchise cornerstones know that fans will come to adore and scorn them, but Félix never asked to mean this to me; to be burdened with these expectations. He doesn’t know my name, but I call him by his first, casual. Familiar. He never meant to be a lesson; in patience; in greatness; in decline; in things left undone. In still being young; in being finished. To make of these guys what we do, to make them our guys, is to see them at once as they are and as we are. True to themselves but also infected with our own picayune trials.
When Félix debuted, I was distant; from Detroit, where he recorded his first four strikeouts, from home, where the faithful watched and waited for his promise to be fulfilled, from baseball, difficult as it was to make time for amidst school and laundry and finding my way. I grew up a baseball fan, and still observed its rituals, but the sport was now rendered in unfamiliar hues. Not the cool blues and greens I knew, but in a vibrant Phillies red, and later, as I navigated the post-college world of full-time work and financial crisis, a stately pinstripe, a garish Queens orange. Seattle baseball was a long ways off, removed from the normal evening hours it had once occupied, and relegated to a twilight time.
I don’t remember when I first read one more article at Lookout Landing than my lunch break comfortably fit; I don’t know that the first time was that remarkable. It was probably some dumb thing that Jeff wrote, to fill all the dumb, meaningless days when the Mariners still, somehow, had to play baseball. But soon, it was a place I toggled to without thinking, the destination of idle wanderings between meetings and during conference calls. I couldn’t watch Félix at home — home was so far, and not where I lived anymore — but I would watch him in the Bronx, trudge to 161st Street armed with my fellow expats and homemade K cards and a sense that this was time well spent even when it was dumb; even though it was meaningless. Because Félix made it mean something.
The day the Mariners announced Félix’s extension, I remember turning to my coworkers, many of whom were Yankees fans smugly convinced that our King was soon to establish a new court out East, and saying with all the defiance I could muster: Félix is ours, and you can’t have him. Later that evening, I spoke with the professor who would become my graduate school advisor. Félix had declared his home, and I was about to declare what I thought was mine. Félix was to me a connection to both to where I’d been and where I might go, a reminder of what I liked and who I wanted to be at a time when I was struggling to know myself, caught in a job that so often took me into the twilight hours where Félix would wait. To appreciate him for staying was to christen this place, my place, worthy of staying in, and more importantly, of getting back to. But it was more than that. It meant more than that.
Perhaps then it is less a theft and more a drawing of loans one can never fully repay. I cheered for Félix, sure, was one of his court, but I didn’t inspire him to a career. I loved to watch him play, celebrated his day, christened him My Guy, but the people he loves he came to know through other means. And yet Félix is why I am here; the stirring his pitches caused, a warmth that radiated into the tips of my fingers and into the space behind my eyes when that cambio flew shifted things around. The desire to know more, to understand the how of this man, even as he, with tears and yelps and a commitment to stay traced over too many innings, articulated his why, made up a pledge to write things down so as to pick them apart. I sought rigor to explain why he meant so much and how good he was; I embraced whimsy to do justice to all he made me feel. I wrote and wrote until all I wanted to do was write more, and then finally, I got to. And the road to being here is why I’ve collected the people I have, friends I love, and can’t imagine my life without, all new lines of credit, charged against this man. My guy.
…
My guy is gone, bound for other places, returned to a life peopled with his people, rather than one serving as a marker for mine, folks who I don’t know and in whose story I play no part, even as so many of those in whose lives I am firmly planted are there because of the years, and turns, and miseries he spent in this place that for so long, I couldn’t get back to. This guy, whose permission to mean all this I was never able to ask for but who has given me so much, by deciding to stay. He is gone, but the memory of him — perfect, resplendent, royal, wrecked, but importantly ours — will persist. Baseball is a little different now; my life unrecognizable. I am here now. The debt remains, and I can’t imagine I’ll ever be able to pay it back.