Nico Hoerner, Still At It

Before they fell into the turbulent wake of the white-hot Brewers, the Cubs were flirting with the best record in baseball for much of the season. You know the highlights: Pete Crow-Armstrong flies through the air and smacks homers. Kyle Tucker is a superstar making a name for himself before hitting free agency. Michael Busch is having a mini-breakout of his own. Seiya Suzuki is a consistent power threat. Dansby Swanson is a metronome in the form of a glove-first shortstop.
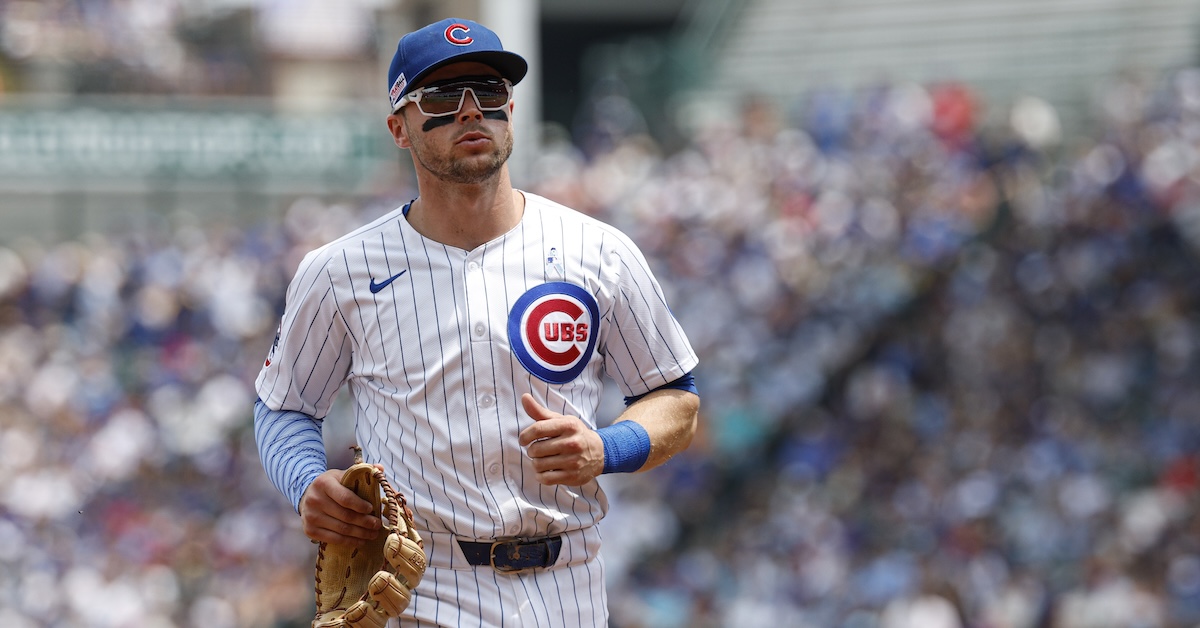
You can keep naming names for quite a while, in fact, before you get to the Cubs’ two longest-tenured hitters. Ian Happ debuted way back in 2017. He’s transitioned from a superutility role to the corner outfield while featuring in the middle of the lineup for nearly a decade, a first-division regular though rarely an All-Star. He’s not the focus of today’s article, though. That would be the other longest-tenured Cub, Nico Hoerner.
Hoerner got a cup of coffee at the end of the 2019 season, played a bench role in 2020, and got injured repeatedly just as he seemed to be settling in as a starter in 2021. He’s been a locked-in everyday guy ever since, at shortstop for a year and then at second after Swanson signed with the team in free agency. And between a succession of newer and more exciting Cubs debuting and the jack-of-all-trades nature of his game, Hoerner’s stardom is often overlooked. But overlooked or not, Hoerner is a star, and so I thought I’d examine his consistent excellence as he churns through yet another quietly outstanding season. Read the rest of this entry »