Archive for Featured

The Big Questions About the 2020 BBWAA Hall of Fame Ballot

On Monday, the Baseball Writers Association of America released its 2020 Hall of Fame ballot, with 14 holdovers, four of whom received at least 50% last year, joined by a group of 18 newcomers headlined by Derek Jeter. Lately, the writers have been working through a massive backlog of candidates, producing an unprecedented flood of 20 honorees in the past six cycles, including four apiece in each of the past two years. The flood is about to begin receding, however. If not for Jeter, this would rate as the weakest ballot for first-time candidates since 2012, when Bernie Williams was the only first-year candidate who even broke 5%. This year’s two top returnees, Curt Schilling (60.9%) and Larry Walker (54.6%), the latter in his final year of eligibility, are hardly slam dunks for immediate election.

Over the next six weeks, I’ll profile all 32 candidates, either at length or more in brief, examining their cases in light of my Jaffe WAR Score (JAWS) system, which I’ll be using to break down Hall of Fame ballots in an annual tradition that began at Baseball Prospectus (2004-12), then moved to SI.com (2013-18), which gave me an opportunity to go into greater depth on each candidate; last year, I brought the series to FanGraphs. The candidate profiles will begin later this week, after I complete my series covering the Modern Baseball Era Committee ballot. Today I’ll offer a quick look at the biggest questions attached to this year’s election cycle.

First, a review of the basics. To be eligible for election to the Hall of Fame via the BBWAA ballot, a candidate must have played in the majors for parts of 10 years (one game is sufficient to be counted as a year in this context), been out of the majors for five years (the minors or foreign leagues don’t count), and then been nominated by two members of the BBWAA’s six-member screening committee, which is usually a formality but can create some head scratching omissions down the ballot. Since the balloting is titled with respect to induction year, not the year of release, the current slate of players will have last appeared in the majors in 2014. Each new candidate has 10 years of eligibility, a reduction from the 15-year period that was in effect from 1936-2014. The last candidate grandfathered into the full run was Lee Smith, whose eligibility expired in 2017; six current candidates (Walker, Schilling, Barry Bonds, Roger Clemens, Jeff Kent, and Sammy Sosa) had their tenures unilaterally reduced mid-candidacy by the Hall.

To be elected, candidates must receive at least 75% of the ballots cast, and in this case, they don’t round up; 74.9% won’t cut it. Likewise, candidates who don’t receive at least 5% fall off the ballot and can then only be considered for election by the Today’s Game Committee, an entirely separate process — but not until what would have been their 10-year run of eligibility expires. Read the rest of this entry »


Baseball’s Competitive Balance Problem

The current landscape of the game might charitably be called an era of superteams. Last year, the Yankees, Astros, Twins, and Dodgers all won more than 100 games. In 2018, it was the Red Sox, Astros, and Yankees; the year before that, the Dodgers, Indians, and Astros all won at least 100 times. The Cubs won 103 on their way to a World Series title, bringing the total number of 100-win teams over the past four seasons to 11. In the 10 years heading into 2016, only four teams hit the 100-win mark, and only the 2009 Yankees and 2011 Phillies won more than 100 games. Superteams are made possible by great players and smart organizations, but they are also made possible by having a bunch of bad teams to beat up on. The lack of competitive balance in today’s game is worse than it’s been in more than 60 years, back when there were only 16 teams and the reserve clause kept players from ever choosing their own employer.

One way to test baseball’s competitive balance is simply to take every team’s winning percentage in a single year and find the standard deviation. The smaller the standard deviation, the more teams are bunched toward the middle in a more competitive atmosphere. The bigger the standard deviation, the more teams are spread apart. Going back to 1903, this is what the standard deviation for team winning percentage looks like:

Read the rest of this entry »


Sunday Notes: The White Sox Wanted Rafael Devers (and the Elbow Gods Got Their Revenge)

When the White Sox traded Chris Sale to Boston, they received a pair of top-shelf prospects in return. Yoan Moncada was seen as possessing superstar potential, while Michael Kopech was a first-round pick who pumped 100-mph gas. Also coming to Chicago in the deal were a pair of midrange prospects, Luis Alexander Basabe and Victor Diaz.

Which team got the better of the December 2016 blockbuster? It’s too early to say, but one thing is certain: The Red Sox dodged a bullet. Basabe and Diaz became part of the package only after then GM Dave Dombrowski balked on including a 20-year-old corner infielder who’d yet to advance beyond A=ball.

“At one point, I asked for Rafael Devers,” acknowledged White Sox GM Rick Hahn, when asked about the trade. “Marco Paddy, who runs our international operation, had mentioned him back when he originally signed with Boston [in 2013], and our pro scouts had obviously seen him in Greenville and Salem. Joe Butler, Joe Siers, and John Tumminia — John has since retired — were all high on him, and made sure he was in the mix. The reason we liked Devers so much was because of those guys.”

As for Kopech, the 23-year-old right-hander is currently recovering from Tommy John surgery. A pair of other notable White Sox pitching prospects are, as well. I asked for an update on all three. Read the rest of this entry »


Despite Stardom and Swagger, Dave Parker is Still Short of Cooperstown

This post is part of a series concerning the 2020 Modern Baseball Era Committee ballot, covering executives and long-retired players whose candidacies will be voted upon at the Winter Meetings in San Diego on December 8. For an introduction to JAWS, see here. Several profiles in this series are adapted from work previously published at SI.com, Baseball Prospectus, and Futility Infielder. All WAR figures refer to the Baseball-Reference version unless otherwise indicated.

2020 Modern Baseball Candidate: Dave Parker
Player Career WAR Peak WAR JAWS
Dave Parker 40.1 37.4 38.7
Avg. HOF RF 71.5 42.1 56.8
H HR AVG/OBP/SLG OPS+
2712 339 .290/.339/.471 121
SOURCE: Baseball-Reference

A five-tool player whose power, ability to hit for average, and strong, accurate throwing arm all stood out – particularly in the Pirates’ seemingly endless and always eye-catching assortment of black-and-yellow uniform combinations — Dave Parker was once considered the game’s best all-around player. In his first five full seasons (1975-79), he amassed a World Series ring, regular season and All-Star MVP awards, two batting titles, two league leads in slugging percentage, and three Gold Gloves, not to mention tremendous swagger, a great nickname (“The Cobra”), and a high regard for himself. “Take Willie Mays and Roberto Clemente and match their first five years up against mine, and they don’t compare with me,” he told Roy Blount in a 1979 Sports Illustrated cover story.

Parker, who had debuted with the Pirates just seven months after Clemente’s death and assumed full-time duty as the team’s right fielder a season and a half later, once appeared to be on course to join the Puerto Rican legend in Cooperstown. Unfortunately, cocaine, poor conditioning, and injuries threw him off course, and while he recovered well enough to make three All-Star teams, play a supporting role on another World Series winner, accrue hefty career totals and play past the age of 40, his game lost multiple dimensions as he aged. Hall of Fame voters greeted his case with a yawn; he debuted with just 17.5% on the 1997 ballot, peaked at 24.5% the next year, and while he remained eligible for the full 15 seasons, only one other time did he top 20%. He made appearances on both the 2014 Expansion Era ballot as well as the ’18 Modern Baseball one, but even after going public with his diagnosis of Parkinson’s Disease, he didn’t come close to election. Aside from the precedent set by Harold Baines‘ election last year — a small committee can throw us a wild card now and then — there’s little reason to believe his fate will be different this time. Read the rest of this entry »


The Worst Teams in Baseball History

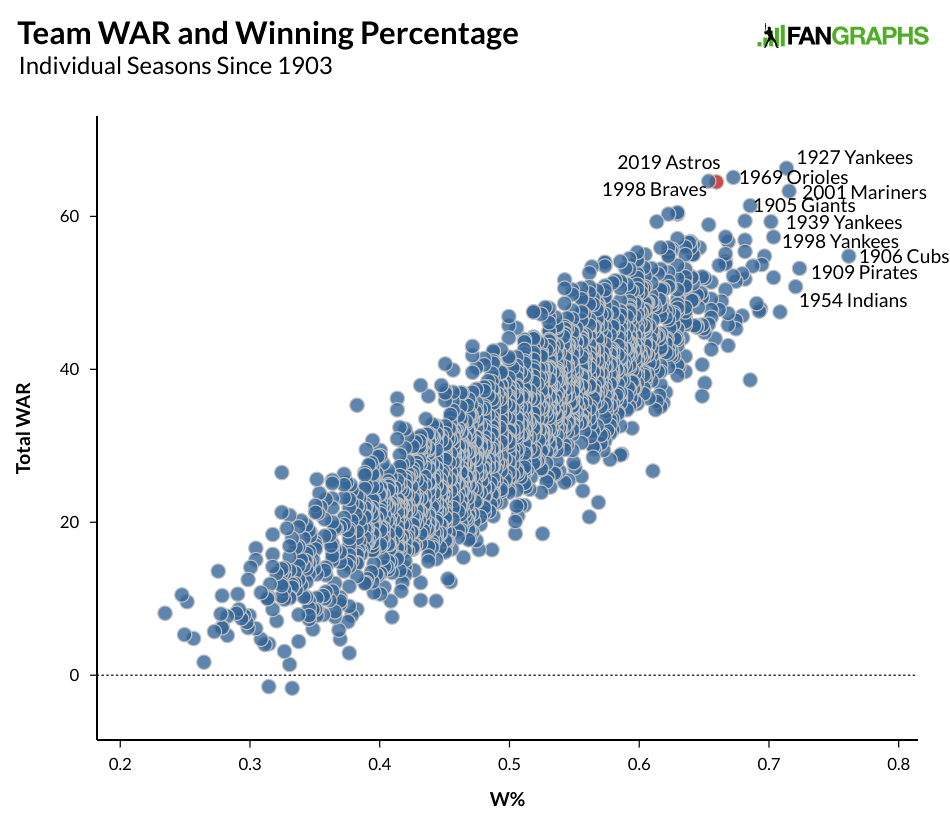
After the World Series ended and the Nationals emerged victorious, I wrote about how the Astros had put together one of the greatest regular seasons of all time and joined the (perhaps ignominious) list of great teams without a title. In doing so, I created the below graph, which shows team winning percentage and WAR, highlighting some of the greatest teams of all time:

At the time, I didn’t mention the teams at the very bottom-left of the graph. If the teams at the top-right are the greatest, then the teams in the bottom-left are the worst. In trying to find a single number to determine just how good or bad a team was, I created an IQ-like score for both winning percentage and team WAR, where 100 is average and every standard deviation away from the mean was worth 15 points. Then I took the average of the two scores for one final number. For reference, this year’s Astros team ended up at 136.5; more than 90% of all teams from 1903 through this season were between 75 and 125. Read the rest of this entry »


The Red Sox Shouldn’t Trade Mookie Betts

The Red Sox have had a sad start to the offseason, even by the standards of baseball’s recent payroll doomsaying. While some teams have intimated that they won’t increase payroll, the Sox have gone further; owner John Henry announced that they plan on dropping below the luxury tax threshold for 2020, setting the tone for a strange winter where cutting salary might matter more than the eventual product on the field.

Viewed through that lens, it’s somehow a bad development when one of the best hitters in baseball chooses to stay on your team. J.D. Martinez was the 16th-best qualified hitter by wRC+ last year, and that was a down year. He elected not to opt out of his current contract, and is slated to make $23.75 million next season — a steal if he hits his Steamer projection, and a useful piece for a team with no other DH options. And yet, when you set artificial salary constraints on yourself, things tend to snowball.

With Martinez in the fold, things took an even weirder turn. The offseason rumor mill seems increasingly convinced that the Sox will offload Mookie Betts to save the last year of his salary and avoid an appropriately costly extension, reaping some prospects in return and cutting payroll in the bargain. I’ll attempt to quantify what this might do to the team, but let me say upfront: this seems like an obviously bad choice to me. Dan Shaughnessy hit pieces aside, Betts is probably the best non-Trout player in baseball. You don’t trade someone like that and take a step forward.

But okay, fine, let’s go through the math of trading Betts. We’ll do the grim calculus of turning player contracts into cash amounts first: if you value a win on the free market at $8 million, Betts’ 6.6 WAR projection is worth $52.8 million. If Betts earns his projected arbitration salary of $27.7 million, that works out to $25 million in surplus value. That sounds reductive, and it is. Mookie Betts isn’t an asset worth $25 million to the Red Sox; he’s one of the best players in baseball, and also a great bowler in his spare time. But if we’re doing the math, that’s the starting point. Read the rest of this entry »


The Pitch Behind Jake Odorizzi’s Career Year

In 2019, Jake Odorizzi went from being a promising middle of the rotation arm to one of the best starting pitchers in baseball. With a career-best 3.36 FIP and a nearly 5% jump in his strikeout rate, he was able to post the highest WAR (4.3) of his six-plus seasons in the major leagues. His pitching arsenal, spearheaded by improvements to his four-seam fastball, became as effective as it’s ever been and transformed Odorizzi into a front-line starter.

Throughout his career, Odorizzi’s fastball has been somewhat pedestrian. From 2016 to 2018, it seemed to get worse; his fastball velocity dipped a little each year, as it gradually dropped more than 1 mph. In fact, almost all of his pitches got slower over that span. In an interview with our own David Laurila, Odorizzi confessed he was dealing with some mechanical issues that could have stemmed from past health problems.

But in 2019, Odorizzi’s four-seamer never dipped below 90 mph; the aforementioned drop in his fastball velocity was reversed, with the right-hander again sitting closer to the mid-90s, and for just the third season in his major league career, the pitch maxed out at over 95 mph.

That extra tick in velocity might not seem like a lot, but moving from the 90-92 mph range to 93-95 mph can make a big difference. In 2019, the league-average wOBA on 90-92 mph four-seamers was .398. Moving up to 93-95 mph (Odorizzi’s 2019 range) drops that figure 46 points to .352; Odorizzi saw an improvement on his four-seamer wOBA from a .301 to .245. Read the rest of this entry »


Do Clean Innings Matter?

If you watched any baseball at all this postseason, the topic of using starters as relievers probably came up. The Nationals used the tactic frequently, and the Cardinals, Dodgers, Braves, Yankees, Twins, Astros, and A’s all had at least one pitcher who was primarily a starter appear in relief. And when those pitchers came in, the same concern was always raised. “Hey,” the concern roughly goes, “this team should put the starter in at the beginning of the inning to put him in the best position to succeed.”

Teams mostly stick to this advice. But I’ve never been one to take rules like this for granted. After all, plenty of other baseball aphorisms turned out to be nothing but high-minded nonsense. Bat your best hitter third. Bunt runners into scoring position. Focus on batting average. The list goes on.

Some of those are nonsense. But there’s a kernel of logic to using only starters with a clean start to an inning. Starters are creatures of habit, with complex pre-game routines designed to get them to peak readiness just in time for the start of a game. Take them out of this environment, ask them to get ready on a moment’s notice, and they might not be completely up to speed when they step on the mound.

It’s not that starters can’t handle having runners on base, in other words. After all, starters pitch with runners on base all the time. Instead, the issue is that with runners on base, the first batter a pitcher faces is sure to be important. Could it be that starters simply aren’t throwing at 100% for the first batter they face when they’re coming into the game in relief?

To test this theory out, I looked at every instance of a starter pitching in relief in the playoffs over the last five years. It’s inherently a limited sample, but starters pitch in relief in the regular season in very different circumstances, and I deemed them different enough that the playoff data would be more relevant. I bundled mid-inning appearances and start-of-inning appearances together; after all, my theory is that insufficient warmups cause pitchers to underperform against the first batter, regardless of the base/out state. Read the rest of this entry »


A Deep Dive Into My National League Rookie of the Year Ballot

Voting for baseball’s various awards is a small part of BBWAA membership, but it’s an undeniably cool part of it, one of the things you dream of doing when you’re a kid. As a member of one of the BBWAA’s smallest city-chapters, I’ve been fortunate to be asked to vote in most of the years I’ve been in the BBWAA, and it’s a responsibility I take quite seriously. I loved baseball for decades before I was employed in the game’s orbit, so it’s important to me to get my microscopic contribution to its history right.

This year, my vote was for the National League Rookie of the Year award. While you only submit three names on your official ballot and I was reasonably sure of who those names would be, my rough draft contained 10 players. I make ballots that are longer than necessary for the express purpose of making sure I’m exercising proper due diligence. Going into my ballot for the 2017 National League Cy Young award, I did not expect Gio Gonzalez to rank fifth (he was eighth in WAR in the NL), but I felt — and still do — that it should be more than a FIP ranking. There’s a philosophical quandary when it comes to BABIP-type measures, after all, and it’s hard to entirely chuck out success that actually occurred simply because that success isn’t necessarily predictive.

Here’s my final 10-player ballot for National League Rookie of the Year. (Naturally, I only submitted three names, as that’s all the form has space for, and because I didn’t want to leave the BBWAA’s secretary-treasurer, Jack O’Connell, questioning my functional literacy.)

10. Kevin Newman (.308/.353/.446, 110 wRC+, 2.4 WAR)

Several other players could have taken the final spot on my imaginary ballot. Some readers will probably object to me leaving off Sandy Alcantara and his 2.4 WAR, but his worse xFIP (5.17) than FIP (4.55) meshes with something that ZiPS saw in Alcantara’s 2019. The system is exceptionally skeptical of Alcantara’s low HR/9, and while I don’t dismiss performance that isn’t predictive outright, there were a lot of excellent back-ballot candidates, and it was enough for him to miss the ballot. You can even shave another couple of runs off from his -0.2 WAR as a hitter.

Merrill Kelly lost -0.6 WAR as a hitter, enough to demote the reliable-if-unexciting innings-eater. Dakota Hudson‘s FIP-ERA difference was simply too large for me to overlook. Adrian Houser got too much of his value from low-leverage situations. Christian Walker’s numbers weren’t thrilling for a first baseman. Some of these objections are quibbles, but this was a very close decision. In the end, I went with Kevin Newman, who hit as well as Walker did while playing three infield positions. Given how volatile defensive numbers are, I didn’t want to be overly reliant on one year’s worth of data at short, which is what I’d have ended up doing in a straight WAR ranking.

9. Mike Yastrzemski (.272/.334/.518, 121 wRC+, 2.2 WAR)

Of the players on the ballot, Li’l Yaz is the one of whose future performance I’m most skeptical. Teams have been wrong about minor league veterans many times in the past, but I’m still not sure they were completely wrong about Yastrzemski. A .251/.342/.442 career line in Triple-A doesn’t scream starting major league corner outfielder, but I can’t deny that his performance actually happened. He also put up his 2.2 WAR in relatively few plate appearances. And it’s worth noting that ZiPS has always liked his defense in the corners, and there’s a real chance that his true ability may be closer to his DRS (+8) than his UZR (+0.8), adding a few runs of value. Read the rest of this entry »


What the Crowd Tells Us About Free Agent Trends

Every year, FanGraphs asks our readers to provide contract predictions for the game’s top free agents and every year, our readers do an admirable job with their winter forecast. The predictions for this offseason’s most notable free agents can be found in our Top 50 Free Agents post; if you prefer a sortable, filterable table where you can easily see all the predictions, plus players’ actual contracts (when signed), we have that option as well. While their predictions are important and valuable to the site, I hope our readers will not take offense when I say that over the last few years, their contract prognostications have not been as good as they were in the past.

Going back to the winter prior to the 2014 season, here is what our readers predicted teams would spend, as well as the actual dollars spent, by year, with some figures coming from this 2018 post and Max Rieper’s prior research:

Free Agent Contract Crowdsourcing Results
Year Players Crowd ($/M) Contract ($/M) Difference % Difference
2014 43 1320.8 1366.9 $46.1 M 3.5%
2015 45 1396.0 1498.4 $102.37 M 7.3%
2016 52 2340.0 2215.0 -$125.0 M -5.3%
2017 42 1441.0 1147.0 -$294.0 M -20.4%
2018 50 1711.0 1279.0 -$432.0 M -25.3%
2019 63 2068.3 1707.4 -$360.9 M -17.5%
TOTAL (’14-’19) 295 10277.1 9212.6 -$1064.4 M -10.4%

Over six offseasons, the crowd’s predictions were roughly a billion dollars too high. That total is only about 10% off, which doesn’t seem so bad. Looking at the individual years above, we can see that the billion dollar difference is housed almost entirely in the last three winters. From 2014 through 2016, the crowd fluctuated a bit but with over five billion dollars in predicted salary, the crowd was off the actual mark by just $23 million, less than half a percent off the total amount. Over the last three seasons, major league payrolls have remained static. The lack of upward movement in spending has come almost entirely at the expense of free agents, who make up roughly two-thirds of total payroll. Based on the crowdsourced predictions, it’s fair to say that readers expected payrolls to rise. The lack of a decent increase in 2017 was a surprise, as was the fact that there was no upward correction in 2018. Last year, readers were closer than they had been the previous two offseasons, but still missed the mark by 17% compared to the actual contracts signed. Read the rest of this entry »

