Centers of Attention: Carlos Beltrán and Andruw Jones Elected to the Hall of Fame
The following article is part of Jay Jaffe’s ongoing look at the candidates on the BBWAA 2026 Hall of Fame ballot. For a detailed introduction to this year’s ballot, and other candidates in the series, use the tool above; an introduction to JAWS can be found here. For a tentative schedule, see here. All WAR figures refer to the Baseball Reference version unless otherwise indicated.
When it comes to center fielders and the Hall of Fame, BBWAA voters have been a particularly picky lot. It’s all too easy to say, “This guy was no Ty Cobb,” or “This guy was no Willie Mays.” Who can live up to standards like that? Until Tuesday, just nine center fielders had been elected by the writers, fewer than any other position, but when Josh Rawitch announced the results of the 2026 balloting, two more joined them: fourth-year candidate Carlos Beltrán and ninth-year candidate Andruw Jones.
Beltrán, a five-tool player with 2,725 career hits, 312 stolen bases and the no. 9 ranking among center fielders in JAWS, received 84.2% of the vote, up from 70.3% last year. He had to overcome some initial resistance to his candidacy owing to his involvement in the Astros’ illegal sign-stealing scandal at the end of his career while helping the Astros win the 2017 World Series. Commissioner Rob Manfred’s 2020 report placed him at the center of Houston’s scheme, and it cost him his job as Mets skipper before he could manage a single game. Despite his transgression, he received 46.5% of the vote in his 2023 ballot debut, and followed with three straight years of double-digit gains.
Jones, who hit 434 homers, won 10 Gold Gloves as the defensive centerpiece of the Braves’ playoff dynasty, and ranks 11th among center fielders in JAWS (and first in fielding runs), received 78.4% of the vote, up from 66.2% last year. Roughly speaking, it’s a coin toss as to whether candidates within 10 points of the magic 75% make up the distance in one year or two, and in his case, the coin came up heads. Which isn’t to say it was all smooth sailing. Jones was amazing in his 20s, but his career fell apart in his 30s. He played his last game in the majors at age 35 in 2012, with an arrest for battery against his then-wife, and his subsequent guilty plea to a lesser disorderly conduct charge, contributing to his disappearance from the majors and giving some voters pause.
Setting that aside — and understandably, not every voter was willing to do so — Jones finished his career with just 1,933 hits. Until Tuesday, the writers hadn’t elected anyone with fewer than 2,000 hits since 1975, when Ralph Kiner (1,451 hits in a career delayed by World War II) got the nod. The writers had bypassed every candidate from the post-1960 era with fewer than 2,000 hits, though Era Committees have recently elected Dick Allen, Gil Hodges, and Tony Oliva. Additionally, Jones debuted on an especially crowded ballot in 2018, one from which 11 players have since been elected, nine by the writers; he received just 7.3% of the vote that year, so in crossing the 75% threshold, he set a record. More on that topic below.
This is the first time since 2009 that two players at the same primary position (besides pitchers) were elected by the writers in the same year. That year, first-time candidate Rickey Henderson and 15th-year candidate Jim Rice were both elected. In more ways than one, they don’t make ’em like that anymore.
Here’s a look at the writers’ history of electing center fielders:
| Player | Year | YoB | Pct |
|---|---|---|---|
| Ty Cobb | 1936 | 1 | 98.2%* |
| Tris Speaker | 1937 | 2 | 82.1% |
| Joe DiMaggio | 1955 | 4** | 88.8% |
| Mickey Mantle | 1974 | 1 | 88.2% |
| Willie Mays | 1979 | 1 | 94.7% |
| Duke Snider | 1980 | 11 | 86.5% |
| Kirby Puckett | 2001 | 1 | 82.1% |
| Andre Dawson | 2010 | 9 | 77.9% |
| Ken Griffey Jr. | 2016 | 1 | 99.3%* |
| Carlos Beltrán | 2026 | 4 | 84.2% |
| Andruw Jones | 2026 | 9 | 78.4% |
Cobb headed the original 1936 class, outdoing even Babe Ruth (95.1%) but — audible sigh — his being left off four ballots helped to create the “tradition” of non-unanimity that stood until Mariano Rivera ran the table in 2019. For as ridiculous as it was that Mays was left off of 23 ballots (don’t get me started), his share was the highest since those of Cobb, Ruth, and Honus Wagner (95.1%) in 1936.
What follows here are a few quick take-home points from the electoral results. I’ll have a candidate-by-candidate breakdown in my next installment.
Giant Leaps… Toward Cooperstown?
Chase Utley was the only other candidate to cross the 50% threshold, reaching 59.1% in just his third year on the ballot, strongly suggesting he’s got a future in Cooperstown. And as voters debated how to handle starting pitchers in an age of reduced workloads and increasingly remote milestones, Andy Pettitte (48.5% in his eighth year of eligibility) and Félix Hernández (46.1% in his second) both surged as well. Their shares suggest they’ll eventually be elected, whether by the writers or an Era Committee to be named later.
What’s more, all three of those candidates landed on the leaderboard for the largest year-to-year jumps in voting share since the writers returned to annual balloting in 1967, with Hernández barely setting a record:
| Rk | Player | Yr0 | Pct0 | Yr1 | Pct1 | Gain |
|---|---|---|---|---|---|---|
| 1 | Félix Hernández | 2025 | 20.6% | 2026 | 46.1% | 25.56% |
| 2 | Luis Aparicio+ | 1982 | 41.9% | 1983 | 67.4% | 25.45% |
| 3 | Barry Larkin+ | 2011 | 62.1% | 2012 | 86.4% | 24.3% |
| 4 | Gil Hodges+ | 1969 | 24.1% | 1970 | 48.3% | 24.2% |
| 5 | Nellie Fox+ | 1975 | 21.0% | 1976 | 44.8% | 23.8% |
| 6 | Hal Newhouser+ | 1974 | 20.0% | 1975 | 42.8% | 22.8% |
| 7 | Jim Rice+ | 1999 | 29.4% | 2000 | 51.5% | 22.1% |
| 8 | Don Drysdale+ | 1976 | 29.4% | 1977 | 51.4% | 22.1% |
| 9 | Larry Walker+ | 2019 | 54.6% | 2020 | 76.6% | 22.0% |
| 10 | Vladimir Guerrero+ | 2017 | 71.7% | 2018 | 92.9% | 21.2% |
| 11 | Andy Pettitte | 2025 | 27.9% | 2026 | 48.5% | 20.6% |
| 12 | Larry Walker+ | 2018 | 34.1% | 2019 | 54.6% | 20.5% |
| 13 | Todd Helton+ | 2022 | 52.0% | 2023 | 72.2% | 20.2% |
| 14 | Johnny Sain | 1974 | 14.0% | 1975 | 34.0% | 20.0% |
| 15 | Early Wynn+ | 1970 | 46.7% | 1971 | 66.7% | 20.0% |
| 16 | Chase Utley | 2025 | 39.8% | 2026 | 59.8% | 19.3% |
| 17 | Minnie Minoso+ | 1985 | 1.8% | 1986 | 20.9% | 19.1% |
| 18 | Phil Cavarretta | 1974 | 16.7% | 1975 | 35.6% | 18.9% |
| 19 | Early Wynn+ | 1969 | 27.9% | 1970 | 46.7% | 18.8% |
| 20 | Yogi Berra+ | 1971 | 67.2% | 1972 | 85.6% | 18.4% |
That trio pushed a pair of back-to-back jumps by Scott Rolen out of the top 20. He went from 17.2% in 2019 to 35.3% in ’20 (a gain of 18.1%), and then to 52.9% in ’21 (a gain of 17.6%) — more than tripling his support in that span and turning him from a long shot into a likely honoree.
With Beltrán, Jones, and Utley the only candidates to reach 50%, this was the first time so few did so since 2000, when second-year candidate Carlton Fisk, ninth-year candidate Tony Perez, and sixth-year candidate Jim Rice were the only ones to do so, with Fisk and Perez both elected.
Biggest Comebacks, Re-Re-Revisited
While he was part of the famous triumvirate of superstar center fielders from New York City baseball teams in the 1950s along with Mickey Mantle and Mays, Duke Snider didn’t get the respect he deserved upon landing on the BBWAA ballot in 1970, four years ahead of the former and seven ahead of the latter. He received just 17% of the vote, and as noted above, it took him until 1980, his 11th year on the ballot (of what was then a 15-year eligibility window) to surpass 75%. Until 2023, that stood as the biggest comeback of any BBWAA-elected candidate, but with Jones’ election, candidates have surpassed Snider’s low mark in each of the past four years. Again, Jones now has the record for the biggest comeback:
of BBWAA-Elected Players
| Player | Year | % | Year Elected | YoB |
|---|---|---|---|---|
| Andruw Jones | 2018 | 7.3% | 2026 | 9 |
| Scott Rolen | 2018 | 10.2% | 2023 | 6 |
| Billy Wagner | 2016 | 10.5% | 2025 | 10 |
| Todd Helton | 2019 | 16.5% | 2024 | 6 |
| Duke Snider | 1970 | 17.0% | 1980 | 11 |
| Bert Blyleven | 1998 | 17.5% | 2011 | 14 |
| Larry Walker | 2011 | 20.31% | 2020 | 10 |
| Mike Mussina | 2014 | 20.32% | 2019 | 6 |
Seven of those eight lowest first-year percentages are from the past 16 years, within the timespan that I’ve been covering Hall of Fame elections. Overcrowded ballots caused some of these candidates to slip through the cracks the first time around, but tools like JAWS and Ryan Thibodaux’s Tracker have helped cue voters that it’s worth taking another look… or nine.
This Time, the First Time Isn’t the Charm
As The Athletic’s Jayson Stark pointed out last week, in the last 12 cycles before this one (2014–25), BBWAA voters elected 18 first-year candidates, the most of any 12-year span in Hall history. The only cycles within that span that lacked one came in 2021, when the writers didn’t elect anybody, and ’23, when Rolen, a sixth-year candidate, was the only honoree.
Now we have a third such instance within a six-year span. Usually when this happens, it’s a single holdover breaking through, but this time it’s a pair. Prior to Tuesday, the last time multiple holdovers were elected without a first-year candidate joining them was in 2011, when second-year candidate Roberto Alomar and 14th-year candidate Bert Blyleven made it. In the last 40 years, the only other times that’s happened were in 1987 (third-year candidate Catfish Hunter and sixth-year candidate Billy Williams) and 2000 (Fisk and Perez).
Underlying this was the reality that this was a particularly weak class of first-year candidates from a Hall standpoint, with Cole Hamels and Ryan Braun the only ones with a JAWS above 33.0 — which is to say the only ones within 20 points of the standards at their respective positions. With Braun’s candidacy hamstrung by both his short career and two suspensions for violating the game’s drug policy (the first of which was overturned by an arbitrator), he received just 3.5%, knocking him off the ballot, leaving Hamels (23.8%) as the only second-year holdover for 2027. The last time such a thing happened was in 2012, when Bernie Williams was the only first-timer to make the cut, receiving just 9.6%. When the deluge of strong and controversial first-year candidates (Barry Bonds, Roger Clemens et al.) arrived the next year, Williams dropped to 3.3% and fell off the ballot. Hamels is at least in much better shape than that.
The Electorate Grows, the Ballot Shrinks
A total of 425 ballots were cast during this cycle, an increase of nearly 8% over last year and the first time since 2012 that at least 400 votes have been cast. Driven by an influx of MLB.com writers and editors (more on which below), this was the largest electorate since 2019 (also 425), though it fell far short of the high of 581 ballots, set in ’11. The Hall’s decision to sunset voters more than 10 years removed from active coverage decreased the size of the electorate from 549 voters in 2015 to 440 in ’16, and it’s been slowly dwindling since then, with industry trends — layoffs, closures, ill-considered pivots to video — contributing to the decline.
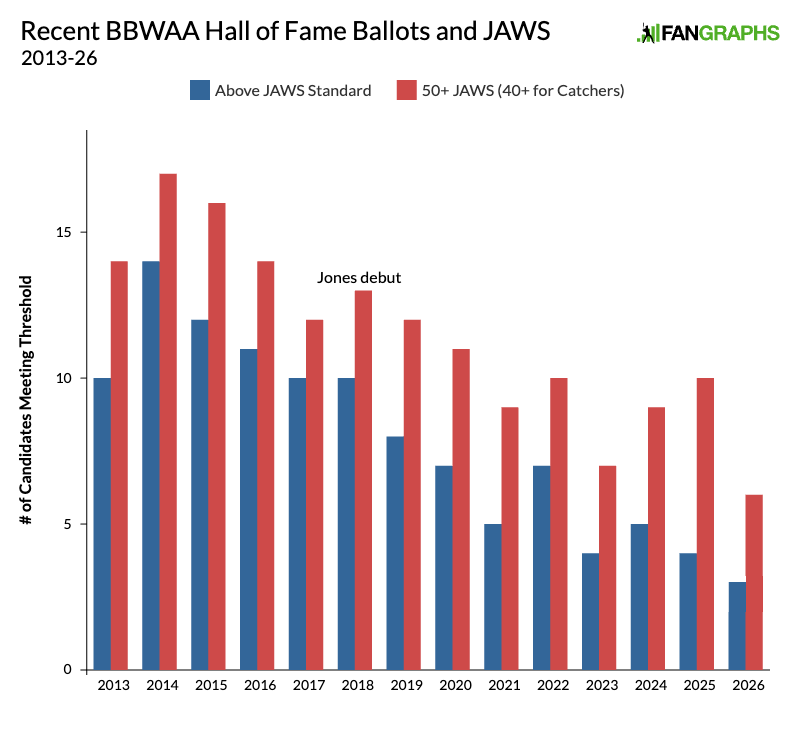
This was a comparatively weak ballot in general, with just three candidates meeting the JAWS standard at their respective positions, the lowest total since 2006, and just six with a JAWS of 50.0 or higher (40.0 or higher for catchers), the lowest total since ’08. Given that landscape, the voters used just 5.77 slots per ballot, 1.0 fewer than last year, and the lowest average since 2012, but not far off from a couple of other recent cycles. This was the second time within that 15-cycle span that the number of blank ballots reached double digits:
| Year | Votes | Votes Per Ballot | All 10 | Elected | Blank |
|---|---|---|---|---|---|
| 2012 | 573 | 5.10 | N/A | 1 | 9 |
| 2013 | 569 | 6.60 | 22% | 0 | 5 |
| 2014 | 571 | 8.39 | 50% | 3 | 1 |
| 2015 | 549 | 8.42 | 51% | 4 | 1 |
| 2016 | 440 | 7.95 | 41.6% | 2 | N/A |
| 2017 | 442 | 8.17 | 45.2% | 3 | 2 |
| 2018 | 422 | 8.46 | 50.0% | 4 | 1 |
| 2019 | 425 | 8.01 | 42.8% | 4 | 0 |
| 2020 | 397 | 6.61 | 20.5% | 2 | N/A |
| 2021 | 401 | 5.87 | 14.5% | 0 | 14 |
| 2022 | 394 | 7.11 | 33.8% | 1 | 6 |
| 2023 | 389 | 5.86 | 13.9% | 1 | 8 |
| 2024 | 385 | 7.00 | 24.4% | 3 | 0 |
| 2025 | 394 | 6.77 | 24.9% | 3 | 0 |
| 2026 | 425 | 5.77 | 20.9% | 2 | 11 |
New Kids on the Bloc
One of the key factors shaping the results this year was the influx of new voters. In 2015, the BBWAA voted to admit MLB.com writers and editors into the organization, and now, with 10 years under their belt, they’re eligible to vote. According to the folks at the Tracker, at the outset of this cycle, as many as 40 or even 50 new voters were expected to join the rolls, with about 25 of those coming from MLB.com. Those estimates may have been low, because as of 6 PM ET on Tuesday, 37 first-time voters had published their ballots, as many as there were in 2024 and ’25 combined.
Perhaps even more interesting is how consistently those newcomers voted for the most favored candidates. All 37 included Beltrán, and all but three included Jones, helping to push them across the finish line. They gave Utley and Hernández more than 75% of their votes, and helped several other candidates set new highs as well:
| Player | New (37) | Others (388) | Dif |
|---|---|---|---|
| Félix Hernández | 75.7% | 43.3% | +32.4% |
| Cole Hamels | 51.4% | 21.1% | +30.2% |
| Bobby Abreu | 56.8% | 28.4% | +28.4% |
| Chase Utley | 83.8% | 56.7% | +27.1% |
| Andy Pettitte | 70.3% | 46.4% | +23.9% |
| Mark Buehrle | 40.5% | 18.0% | +22.5% |
| Carlos Beltrán | 100.0% | 82.7% | +17.3% |
| Andruw Jones | 91.9% | 77.1% | +14.8% |
| Dustin Pedroia | 29.7% | 19.8% | +9.9% |
| David Wright | 21.6% | 14.2% | +7.4% |
| Manny Ramírez | 40.5% | 38.7% | +1.9% |
| Álex Rodríguez | 40.5% | 39.9% | +0.6% |
| Gio González | 0.0% | 0.0% | +0.0% |
| Howie Kendrick | 0.0% | 0.0% | +0.0% |
| Daniel Murphy | 0.0% | 0.0% | +0.0% |
| Alex Gordon | 0.0% | 0.3% | -0.3% |
| Nick Markakis | 0.0% | 0.3% | -0.3% |
| Matt Kemp | 0.0% | 0.5% | -0.5% |
| Hunter Pence | 0.0% | 0.5% | -0.5% |
| Rick Porcello | 0.0% | 0.5% | -0.5% |
| Torii Hunter | 8.1% | 8.8% | -0.7% |
| Shin-Soo Choo | 0.0% | 0.8% | -0.8% |
| Francisco Rodríguez | 10.8% | 11.9% | -1.0% |
| Edwin Encarnación | 0.0% | 1.5% | -1.5% |
| Ryan Braun | 0.0% | 3.9% | -3.9% |
| Jimmy Rollins | 13.5% | 26.5% | -13.0% |
| Omar Vizquel | 5.4% | 19.6% | -14.2% |
With the Tracker likely to add something on the order of another 100 ballots over the next couple of weeks, those percentages will shift and probably converge. But for now, wow!
Everybody Gains
As was the case in my year-to-year comparisons of our crowdsourced balloting, every returning candidate received a higher share from the voters in 2026 than in ’25 — even Hunter, the only candidate who lost ground from the writers (and our crowd) last year. Eleven candidates did receive less than 5% and are ineligible for further consideration by the BBWAA, none of whom were surprises; three were shut out. Ramirez has aged off the ballot after a 10-year run, unable to escape the impact of his two suspensions. Six holdovers posted double-digit gains:
| Player | YOB | Votes | 2026% | 2025% | Change |
|---|---|---|---|---|---|
| Carlos Beltrán | 4 | 358 | 84.2% | 70.3% | +13.9% |
| Andruw Jones | 9 | 333 | 78.4% | 66.2% | +12.2% |
| Chase Utley | 3 | 251 | 59.1% | 39.8% | +19.3% |
| Andy Pettitte | 8 | 206 | 48.5% | 27.9% | +20.6% |
| Félix Hernández | 2 | 196 | 46.1% | 20.6% | +25.5% |
| Alex Rodriguez | 5 | 170 | 40.0% | 37.1% | +2.9% |
| Manny Ramirez* | 10 | 165 | 38.8% | 34.3% | +4.5% |
| Bobby Abreu | 7 | 131 | 30.8% | 19.5% | +11.3% |
| Jimmy Rollins | 5 | 108 | 25.4% | 18.0% | +7.4% |
| Cole Hamels | 1 | 101 | 23.8% | — | — |
| Dustin Pedroia | 2 | 88 | 20.7% | 11.9% | +8.8% |
| Mark Buehrle | 6 | 85 | 20.0% | 11.4% | +8.6% |
| Omar Vizquel | 9 | 78 | 18.4% | 17.8% | +0.6% |
| David Wright | 3 | 63 | 14.8% | 8.1% | +6.7% |
| Francisco Rodríguez | 4 | 50 | 11.8% | 10.2% | +1.6% |
| Torii Hunter | 6 | 37 | 8.7% | 5.1% | +3.6% |
| Ryan Braun* | 1 | 15 | 3.5% | — | — |
| Edwin Encarnación* | 1 | 6 | 1.4% | — | — |
| Shin-Soo Choo* | 1 | 3 | 0.7% | — | — |
| Matt Kemp* | 1 | 2 | 0.5% | — | — |
| Hunter Pence* | 1 | 2 | 0.5% | — | — |
| Rick Porcello* | 1 | 2 | 0.5% | — | — |
| Alex Gordon* | 1 | 1 | 0.2% | — | — |
| Nick Markakis* | 1 | 1 | 0.2% | — | — |
| Gio González* | 1 | 0 | 0.0% | — | — |
| Howie Kendrick* | 1 | 0 | 0.0% | — | — |
| Daniel Murphy* | 1 | 0 | 0.0% | — | — |
I’ll have a look at what these results mean for each candidate in my next installment.
Brooklyn-based Jay Jaffe is a senior writer for FanGraphs, the author of The Cooperstown Casebook (Thomas Dunne Books, 2017) and the creator of the JAWS (Jaffe WAR Score) metric for Hall of Fame analysis. He founded the Futility Infielder website (2001), was a columnist for Baseball Prospectus (2005-2012) and a contributing writer for Sports Illustrated (2012-2018). He has been a recurring guest on MLB Network and a member of the BBWAA since 2011, and a Hall of Fame voter since 2021. Follow him on BlueSky @jayjaffe.bsky.social.
Congrats to both players!
And look at Utley. Very promising. And pitchers taking steps forward
Very cool all around
Hamels should be up there higher than he is